The non-segregated population of blue straggler stars in the remote globular cluster Palomar 14
Abstract
We used deep wide-field observations obtained with the Canada-France-Hawaii Telescope to study the blue straggler star (BSS) population in the innermost five arcminutes of the remote Galactic globular cluster Palomar 14. The BSS radial distribution is found to be consistent with that of the normal cluster stars, showing no evidence of central segregation. Palomar 14 is the third system in the Galaxy (in addition to Centauri and NGC 2419) showing a population of BSS not centrally segregated. This is the most direct evidence that in Palomar 14 two-body relaxation has not fully established energy equipartition yet, even in the central regions (in agreement with the estimated half-mass relaxation time, which is significantly larger than the cluster age). These observational facts have important implications for the interpretation of the shape of the mass function and the existence of the tidal tails recently discovered in this cluster.
Subject headings:
globular clusters: general — globular clusters: individual(PAL14)1. Introduction
Blue straggler stars (BSS) are hydrogen-burning stars located bluer and brighter than the main sequence (MS) turn-off (TO) point in the optical color-magnitude diagram (CMD) of star clusters. There is a general consensus in considering BSS as the most massive (with ; see Shara et al. 1997, Ferraro et al 2006a) luminous objects in the CMD of a globular cluster (GC). Two physical mechanisms (both affecting and affected by the dynamical processes occurring in the cluster) have been proposed for their formation: direct stellar collisions and mass transfer activity in binary systems (Hills & Day, 1976; McCrea, 1964). The former is expected to be particularly important in high-density environments, while it should be less efficient in loose GCs and in the cluster external regions, with respect to the undisturbed evolution of primordial binaries. On the other hand, the discovery (Ferraro et al., 2009) of two distinct and parallel BSS sequences in M30, possibly populated by objects generated by the two formation processes during the core collapse phase, further supports the idea that BSS of different origins can coexist within the same stellar system. Observational proof of the connection between the binary and the BSS populations in low-density environments is testified by the correlation between the number fraction of these two species recently found in the core of 13 loose GCs (Sollima et al., 2008). In addition, being more massive than the average, BSS tend to sink toward the bottom of the cluster potential well, under the action of energy equipartition. In most of the surveyed GCs ( to date) BSS appear to be strongly concentrated in the core (see, e.g., Figure 2 in Ferraro et al. 2003 and Figure 6 in Ferraro & Lanzoni 2009), with their fraction, measured with respect to ordinary cluster stars, decreasing at increasing distance from the center and showing an upturn in the external regions (see also Ferraro et al., 1993, 2004; Dalessandro et al., 2009). This feature has been interpreted by means of numerical simulations (Mapelli et al., 2004, 2006; Lanzoni et al., 2007a, b) showing that the central peak is due both to BSS formed in place because of stellar collisions, and to mass transfer BSS sunk to the centre under the effect of mass segregation. In contrast, the rising branch in the cluster outskirts is due to BSS generated by the unperturbed evolution of primordial binaries, which are preferentially orbiting in regions where the dynamical friction timescale is longer than the cluster age. The only two exceptions currently known are Centauri (Ferraro et al., 2006) and NGC 2419 (Dalessandro et al., 2008), where BSS show the same radial distribution as that of the other cluster stars. This fact indicates that these two GCs have not yet reached a status of energy equipartition, and their BSS result from the evolution of binary systems whose radial distribution has not been altered by the the process of mass segregation.
Based on these results, here we use the BSS radial distribution to investigate the dynamical state of the remote GC Palomar 14 (hereafter Pal14), located in the outer Halo of the Milky Way, at a distance of kpc (Sollima et al., 2011, hereafter S11).
Pal14 has been indicated as one of the best candidates to test alternative theories of gravity (Baumgardt et al., 2005; Sollima & Nipoti, 2010) and recent analyses have shown a peculiar structure and kinematics of this cluster. Adopting a sample of 17 stars Jordi et al. (2009) measured a very small velocity dispersion ( km/s). Küpper & Kroupa (2010) claimed that such a small value is not compatible with the presence of the fraction of binaries () expected in a loose GC. They argued that either this cluster hosts a low fraction of binaries, or it constitutes a “deep-freeze” with an unusually low velocity dispersion. By measuring the cluster mass function between 0.53 and 0.78, Jordi et al. (2009) found a significantly flatter slope than the canonical value and concluded that either Pal14 formed with only few low-mass stars, or it is mass segregated and lost most of its low-mass stars through interaction with the Galactic tidal field. Indeed, two well defined and extended tidal tails associated with Pal14, likely due to an active process of tidal stripping, have been recently detected (S11). However, no measurement of the degree of mass segregation was available to date and the estimated half-mass relaxation time ( Gyr; S11) is much longer than the cluster age ( Gyr; Dotter et al., 2008). On the basis of these results and using N-body simulations, Zonoozi et al. (2011) concluded that either a primordial mass segregation or a non-canonical initial mass function must have been established in this cluster after the initial gas expulsion.
With the aim of clarifying the dynamical state of Pal14, here we study the radial distribution of its BSS population. In Sect. 2 the adopted photometric dataset is presented. In Section 3 and 4 the BSS and the reference populations are defined and their radial distribution is derived and analyzed. In Section 5 we present our conclusions.
2. Catalogue and completeness level
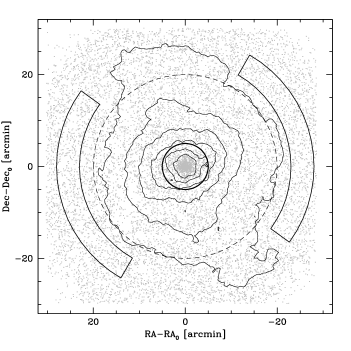
This work is based on observations performed with the wide-field camera MegaCam, mounted at the Canada-France-Hawaii Telescope (CFHT). The photometric dataset and the adopted reduction procedures are described in S11. The final catalogue includes 40,000 objects sampled in the ’ and ’ filters over an area of 1 deg2 centered on the cluster. A map of the MegaCam dataset is shown in Fig. 1 and the CMD for the innermost of the cluster is shown in the left panel of Fig. 2.
The loose structure of Pal14 guarantees that the photometric analysis is accurate and complete even in the very central regions of the cluster. However, in order to quantitatively estimate the level of completeness of the photometric sample in the central region of the cluster, we performed a detailed comparison with high-resolution images of the cluster obtained with the Hubble Space Telescope (HST). We retrieved a set of deep, multi-band images (with total integration times of 8540s and of 10320s in the and filers, respectively) secured with the Wide Field Planetary Camera 2 (WFPC2, GO-6512; PI: Hesser). We analyzed these images by using DAOPHOTII (Stetson, 1987). Briefly, an accurate Point Spread Function (PSF) was estimated on each frame and adopted for the first run of the PSF fitting procedure. A master list of stars was extracted from a deep, high signal-to-noise image obtained from the montage of the entire dataset. Then, the average of the magnitudes measured (through ALLFRAME; Stetson, 1987) in each single frame for every master list object was adopted as the star magnitude in the final catalogue, and the error of the mean was assumed to be the associated photometric error. The WFPC2 catalogue includes 2766 stars with and sharpness parameter down to , i.e. 5 mag below the MS-TO. The number of sampled stars is fully compatible with the 2752 stars sampled by Jordi et al. (2009) and the completeness study shown in their Fig. 4, safely assumed as representative of the quality of our WFPC2 photometry, indicates that our WFPC2 catalogue is complete well below the MS-TO. The completeness of the MegaCam catalogue is quantified as the fraction of stars in common with the WFPC2 catalogue in a given magnitude interval, with respect to the total number of stars sampled by the WFPC2 in the same range. We find , and of stars at and 22.5, respectively.
2.1. Center of Gravity
By following the procedure described in Montegriffo et al. (1995, see also Dalessandro et al. 2008), we have estimated the center of gravity () of Pal14 as the barycenter of the resolved stars. To this aim, we first performed a rough selection of the cluster stars along the canonical evolutionary sequences in the CMD. Then, through a sigma clipping procedure, we averaged the and positions of all the stars contained within three circular areas of radius and around the centre quoted by Harris (1996). Three barycenters were measured in each area by using stars brighter than ’. The mean of these nine measures of the barycenters turns out to be , , with standard deviations and in RA and Dec, respectively (a large scatter is expected because of the extremely low stellar density even in the core region of the cluster). This position of the cluster center is in agreement (within the errors , ) with the one found by Hilker (2006).
3. Population selection and BSS radial distribution
In order to investigate the cluster dynamical state, we studied the BSS radial distribution and compared it to that of red giant branch (RGB) and horizontal branch (HB) stars, taken as representative of the “normal” cluster population (see Ferraro & Lanzoni, 2009, for a recent review). This requires a proper selection of the samples in radial annuli around the cluster centre and an accurate analysis of the contribution due to field stars located in the foreground/background of the cluster. Given the tidal distortion recently detected in Pal14 (S11), its stellar distribution can be considered to have a spherical symmetry only for (see Fig. 1, and Fig. 4 in S11). This corresponds to (or ), a distance where any signature of mass segregation in the radial distribution of the cluster populations is expected to be well visible. Moreover, at these radial distances the field contamination is still acceptable with respect to the number of cluster stars. Hence, we limit the following analysis to this portion () of the cluster.

In order to define the BSS sample we have considered the selection box shown in Fig. 2. While Sandquist (2005) also included stars much closer to the MS-TO (see his Fig. 1), we chose a more conservative limit in order to minimize the risk of contamination by spurious (blended) sources, which are expected to be very few or zero, but could be critical because of the small number of stars in Pal14. The same magnitude range was used to define the RGB sample, which include some sub-giant stars. The selection boxes used for the RGB and HB populations are shown in Fig. 2. We count a total of 24 BSS, 191 RGB and 24 HB stars.111We have carefully checked that slightly different assumptions about the selection boxes (e.g. using the definitions provided by Sandquist 2005) do not change the results of the analysis presented in this paper.
The cumulative radial distributions of the three samples are shown in Fig. 3. No significant difference is found among the three distributions, thus indicating that none is distinctly segregated towards the cluster center with respect to the others. A Kolmogorov-Smirnov test indicates a 99% probability that the three samples are extracted from the same parent population.
We also used the Anderson-Darling test, which is more sensitive to the tails of the empirical cumulative distribution function than Kolmogorov-Smirnov, to assess possible differences at small and large radial distances. Using the -sample variant of the Anderson-Darling test (Scholz & Stephens, 1987), we found that for any pair of samples (=2) the probability that they arise from the same underlying distribution is 63%, while for the combined set (=3) of samples, the probability raises to 79%. There is therefore no statistically significant radial segregation between the samples of BSS, HB and RGB stars.
To further investigate this issue, we studied the radial distribution of the population ratios by following the procedure described, e.g., in Ferraro & Lanzoni (2009). The field of view was divided in three concentric annuli, each one sampling approximately the same luminosity fraction. The number of objects belonging to the three populations was then counted in each annular area (see Table 1).
| annulus | ||||
|---|---|---|---|---|
| 0.76 | 8 (0.05) | 64 (0.12) | 9 (0.04) | |
| 2.43 | 9 (0.18) | 62 (0.47) | 6 (0.16) | |
| 5.83 | 7 (1.29) | 65 (3.11) | 9 (1.04) |
Inorder to estimate the contamination from field stars to the selected populations we have taken advantage of the wide radial coverage of the MegaCam catalogue. Two areas between and (i.e., at from ) and orthogonal to the direction of the tidal tail (thus to minimize the possibility that genuine cluster stars fall in field sample; see Fig. 1) have been selected as representative of the Galactic field population. As shown in Fig. 2 (right panel) no signature of the cluster stellar populations is found in the field CMD. We count, respectively, 8, 21 and 7 field stars within the same BSS, RGB and HB selection boxes discussed above. We estimate a contamination of , and field stars per square arcminute, to the BSS, RGB and HB populations, respectively. By taking into account the area sampled by the three radial bins, the number of contaminating field stars in each annulus and for each population has been derived and it is quoted in parenthesis in Table 1. Finally, to compute the average ratio of the number of RGB, HB and BSS stars we used Eq. (26) in Cerviño & Valls-Gabaud (2003) for uncorrelated Poisson variables.

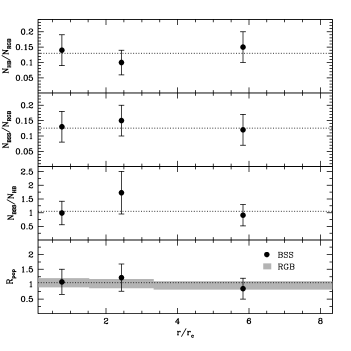
As shown in Fig. 4 (upper panel), the radial distribution of the ratio between HB and RGB stars is flat, in agreement with what expected for normal cluster stars, which all have (essentially) the same mass. Consistently with what found above, and despite their higher mass, also BSS are distributed as the normal cluster population and show no evidence of central segregation (Fig. 4, second and third panels).
We have also investigated the radial behavior of the double normalized ratio (Ferraro et al., 1993), which reports, per each considered annulus, the fraction of stars observed in a given evolutionary stage (BSS, HB, RGB) divided by the faction of cluster light sampled in that annulus by the observations: , with pop=BSS, HB, RGB. Since the number of stars in any post-MS stage scales linearly with the total luminosity of the stellar population (Renzini & Fusi Pecci, 1988), this ratio is predicted to be equal to 1 for any (not segregated) reference populations, while a larger (smaller) value is expected for populations which are more (less) concentrated. In order to estimate the sampled light, we have integrated the King profile best-fitting the surface density distribution (from S11). The radial trend of and in the same annuli previously defined is shown in the lower panel of Fig. 4. As apparent, it turns out to be constant and equal to 1 not only for the RGB (and the HB) stars, but also for the BSS, thus further demonstrating that this population has a radial distribution fully consistent with that of the reference ones.
4. Discussion
The radial distribution of BSS in Pal14 is indistinguishable from that of its normal (and less massive) stars. As in the case of the only two other clusters showing the same feature (Cen and NGC2419; Ferraro et al., 2006; Dalessandro et al., 2008, respectively), this is an observational proof that Pal14 is dynamically young, still far from having established energy equipartition even in its innermost regions. This is in agreement with the extremely long half-mass radius relaxation time ( Gyr) recently estimated by S11. Moreover, our results suggest that the unusually flat mass function measured by Jordi et al. (2009) cannot be explained by energy equipartition developed during the cluster dynamical evolution, but should be primordial (as suggested by Zonoozi et al., 2011). We note that since the mass range covered by that study is quite limited, further investigation is needed. Finally, the negligible degree of relaxation of Pal14 suggests that the observed tidal tails should not be preferentially populated by low mass stars evaporated from the cluster.
The flat BSS radial distribution also suggests that (as expected in such a low density environment) stellar collisions played a minor role in generating these exotica and affecting the binary population. Hence, as in the case of Centauri and NGC 2419, the BSS we are observing likely derive from the evolution of primordial binaries and can be used to get a rough estimate of the fraction of such a population. As a first consideration, we note that the number of BSS normalized to the sampled luminosity (in units of , see Ferraro et al., 1995) is in Centauri and in NGC 2419. The same ratio in Pal14 rises to 29 (i.e. a value 10 times larger than what found in the two clusters with similar BSS radial distribution). However this value is not that surprising when compared to the field. In fact, as discussed by Ferraro et al. (2006), the observed BSS specific frequency in Centauri turned out to be times lower that what observed in the field () by Preston & Sneden (2000). The value found in Pal14 is , in much better agreement with the above field sample.
Under the hypothesis that all the BSS are originated by primordial binaries, this possibly suggests that the binary fraction in Pal14 (and in the field) might be much higher than in the other two GCs (in Cen it amounts to ; Sollima et al., 2007a). A rough estimate of the binary fraction in Palomar 14 can be derived from the correlation between the measured binary fraction and the cluster integrated magnitude found by Sollima et al. (2010) in a sample of 18 open and low-density globular clusters. From their Figure 7, and adopting (S11) we predict for Palomar 14. In addition, the comparison between the number of BSS per unit luminosity (from Ferraro et al., 1995) and the fraction of binaries (Sollima et al., 2007b) measured in a sample of low-density GCs (in which the collisional channel of BSS formation is expected to be negligible) shows that while BSS-poor GCs (with ) host a small fraction of binaries (), the only cluster (Palomar 12) with a value of similar to Pal14 has a binary fraction of . Despite the uncertainty affecting these estimates, such a result and, even more robustly, the existence of a non-collisional BSS population, suggest that Pal14 might have a non-negligible fraction (of the order of ) of binaries.
Deep and high-quality imaging of Pal14 main sequence are urged for a direct estimate of the binary fraction and a measurement of the mass function in a wide range of masses. Additional spectroscopic campaigns able to more precisely estimate the cluster velocity dispersion would also be very useful to constrain more tightly the dynamical state of the cluster.
References
- Baumgardt et al. (2005) Baumgardt, H., Grebel, E. K., & Kroupa, P. 2005, MNRAS, 359, L1
- Cerviño & Valls-Gabaud (2003) Cerviño, M., & Valls-Gabaud, D. 2003, MNRAS, 338, 481
- Dalessandro et al. (2008) Dalessandro, E., Lanzoni, B., Ferraro, F. R., Vespe, F., Bellazzini, M., & Rood, R. T. 2008, ApJ, 681, 311
- Dalessandro et al. (2009) Dalessandro, E., Beccari, G., Lanzoni, B., Ferraro, F. R., Schiavon, R., & Rood, R. T. 2009, ApJS, 182, 509
- Dotter et al. (2008) Dotter, A., Sarajedini, A., & Yang, S.-C. 2008, AJ, 136, 1407
- Ferraro et al. (1993) Ferraro, F. R., Pecci, F. F., Cacciari, C., Corsi, C., Buonanno, R., Fahlman, G. G., & Richer, H. B. 1993, AJ, 106, 2324
- Ferraro et al. (1995) Ferraro, F. R., Fusi Pecci, F., & Bellazzini, M. 1995, A&A, 294, 80
- Ferraro et al. (2003) Ferraro, F. R., Sills, A., Rood, R. T., Paltrinieri, B., & Buonanno, R. 2003, ApJ, 588, 464
- Ferraro et al. (2004) Ferraro, F. R., Beccari, G., Rood, R. T., Bellazzini, M., Sills, A., & Sabbi, E. 2004, ApJ, 603, 127
- Ferraro et al. (2006) Ferraro, F. R., Sollima, A., Rood, R. T., Origlia, L., Pancino, E., & Bellazzini, M. 2006, ApJ, 638, 433
- Ferraro & Lanzoni (2009) Ferraro, F. R., & Lanzoni, B. 2009, Revista Mexicana de Astronomia y Astrofisica Conference Series, 37, 62
- Ferraro et al. (2009) Ferraro, F. R., et al. 2009, Nature, 462, 1028
- Harris (1996) Harris, W.E. 1996, AJ, 112, 1487
- Hilker (2006) Hilker, M. 2006, A&A, 448, 171
- Hills & Day (1976) Hills, J. G., & Day, C. A. 1976, Astrophys. Lett., 17, 87
- Jordi et al. (2009) Jordi, K., et al. 2009, AJ, 137, 4586
- Küpper & Kroupa (2010) Küpper, A. H. W., & Kroupa, P. 2010, ApJ, 716, 776
- Lanzoni et al. (2007a) Lanzoni, B., Dalessandro, E., Ferraro, F. R., Mancini, C., Beccari, G., Rood, R. T., Mapelli, M., & Sigurdsson, S. 2007a, ApJ, 663, 267
- Lanzoni et al. (2007b) Lanzoni, B., et al. 2007b, ApJ, 663, 1040
- Mapelli et al. (2004) Mapelli, M., Sigurdsson, S., Colpi, M., Ferraro, F. R., Possenti, A., Rood, R. T., Sills, A., & Beccari, G. 2004, ApJ, 605, L29
- Mapelli et al. (2006) Mapelli, M., Sigurdsson, S., Ferraro, F. R., Colpi, M., Possenti, A., & Lanzoni, B. 2006, MNRAS, 373, 361
- McCrea (1964) McCrea, W. H. 1964, MNRAS, 128, 147
- Montegriffo et al. (1995) Montegriffo, P., Ferraro, F. R., Fusi Pecci, F., & Origlia, L. 1995, MNRAS, 276, 739
- Renzini & Fusi Pecci (1988) Renzini, A., & Fusi Pecci, F. 1988, ARA&A, 26, 199
- Sandquist (2005) Sandquist, E. L. 2005, ApJ, 635, L73
- Scholz & Stephens (1987) Scholz, F.W. & Stephens, M.A. 1987, Journal of the American Statistical Association, 82, 918
- Sollima et al. (2007a) Sollima, A., Ferraro, F. R., & Bellazzini, M. 2007, MNRAS, 381, 1575
- Sollima et al. (2007b) Sollima, A., Beccari, G., Ferraro, F. R., Fusi Pecci, F., & Sarajedini, A. 2007, MNRAS, 380, 781
- Sollima et al. (2008) Sollima, A., Lanzoni, B., Beccari, G., Ferraro, F. R., & Fusi Pecci, F. 2008, A&A, 481, 701
- Sollima & Nipoti (2010) Sollima, A., & Nipoti, C. 2010, MNRAS, 401, 131
- Sollima et al. (2010) Sollima, A., J. A. Carballo-Bello, G. Beccari, F. R. Ferraro, F. Fusi Pecci and B. Lanzoni, 2010, MNRAS, 401, 577
- Sollima et al. (2011) Sollima, A., Martinez-Delgado, D., Valls-Gabaud, D., & Peñarrubia, J. 2011, ApJ, 726, 47 (S11)
- Stetson (1987) Stetson, P. B. 1987, PASP, 99, 191
- Zonoozi et al. (2011) Zonoozi, A. H., Küpper, A. H. W., Baumgardt, H., Haghi, H., Kroupa, P., & Hilker, M. 2011, MNRAS, 411, 1989