A Sino-German 6 cm polarization survey of the Galactic plane
Abstract
Context. Supernova remnants (SNRs) were often discovered in radio surveys of the Galactic plane. Because of the surface-brightness limit of previous surveys, more faint or confused SNRs await discovery. The Sino-German 6 cm Galactic plane survey is a sensitive survey with the potential to detect new low surface-brightness SNRs.
Aims. We want to identify new SNRs from the 6 cm survey map of the Galactic plane.
Methods. We searched for new shell-like objects in the 6 cm survey maps, and studied their radio emission, polarization, and spectra using the 6 cm maps together with the 11 cm and 21 cm Effelsberg observations. Extended polarized objects with non-thermal spectra were identified as SNRs.
Results. We have discovered two new, large, faint SNRs, G178.24.2 and G25.12.3, both of which show shell structure. G178.24.2 has a size of with strongly polarized emission being detected along its northern shell. The spectrum of G178.24.2 is non-thermal, with an integrated spectral index of . Its surface brightness is , which makes G178.24.2 the second faintest known Galactic SNR. G25.12.3 is revealed by its strong southern shell which has a size of . It has a non-thermal radio spectrum with a spectral index of .
Conclusions. Two new large shell-type SNRs have been detected at 6 cm in an area of 2200 deg2 along the the Galactic plane. This demonstrates that more large and faint SNRs exist, but are very difficult to detect.
Key Words.:
ISM: supernova remnants – ISM: individual objects: G178.24.2, G25.12.3 – Radio continuum: ISM1 Introduction
Supernova remnants (SNRs) are the post-explosion relics of massive stars that have reached the end of their evolutionary life times. It has been predicted that the total number of Galactic SNRs is between 1 000 and 10 000 (Berkhuijsen 1984; Li et al. 1991; Tammann et al. 1994). However, up to now just 274 SNRs have been identified (Green 2009). Among these, G192.81.1 has recently been disapproved as being a SNR (Gao et al. 2011). This low SNR detection rate results from the insufficient sensitivity and resolution of available observations. Diffuse radio emission and discrete source complexes are not uniformly distributed along the Galactic disk, whose own emission confuses that from faint SNRs and hinders their identification.
A large number of SNRs have been identified from radio survey maps (e.g. Reich et al. 1988; Brogan et al. 2006). Shell-type SNRs can be recognized by their morphology, non-thermal spectra, and ordered polarization. Most known Galactic SNRs have a bright shell, with intrinsic magnetic fields running along the shell. The radio spectrum of a SNR is often described by single power law, . Here represents the integrated flux density of a SNR at the observing frequency . In general, SNRs have a spectral index of , which is expected for SNRs in the adiabatic expansion phase with a compression factor of four (e.g. Reich 2002). Young SNRs can have steeper spectra () and show radial magnetic fields (e.g. Reich 2002).
To discover new SNRs, observations of high sensitivity are needed, which resolve confusing structures. We have conducted the Sino-German 6 cm polarization survey of the Galactic plane (Sun et al. 2007; Gao et al. 2010; Sun et al. 2011; Xiao et al. 2011) in the region of Galactic longitude and latitude , with an angular resolution of 95. The sensitivity of the Urumqi survey, if extrapolated from 4.8 GHz to 1 GHz with a typical spectral index of , is on average , lower than the surface brightness of the faintest Galactic SNR known to date, which is for G156.2+5.7 (Reich et al. 1992; Xu et al. 2007). Therefore, it should be possible to detect new faint SNRs in the 6 cm survey. Here, we report the discovery of two new SNRs, G178.24.2 and G25.12.3, and study their radio properties.
2 The 6 cm maps of the two new SNRs
The Sino-German 6 cm polarization survey of the Galactic plane was conducted by using the Urumqi 25-m radio telescope. The 6 cm maps are not only important for studies of the diffuse Galactic emission (Sun et al. 2011; Xiao et al. 2011), but also for studies of Galactic sources like SNRs (e.g. Sun et al. 2006; Xu et al. 2007; Shi et al. 2008; Xiao et al. 2008, 2009; Gao et al. 2011).
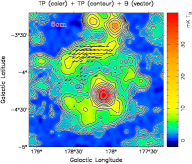
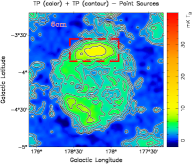
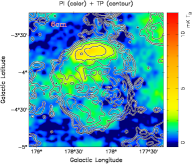
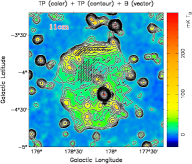
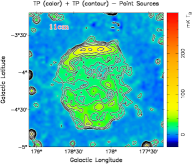
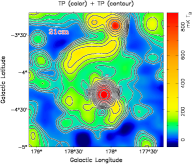
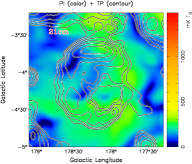
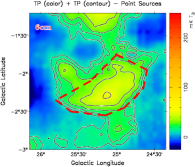
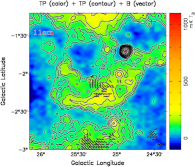
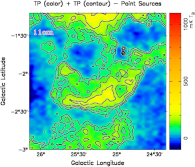
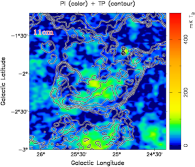
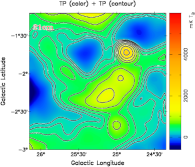
We have identified two extended shell-like sources, G178.24.2 and G25.12.3, in the survey maps. We used the “background filtering” technique (Sofue & Reich 1979) with a filter beam size larger than that of the objects to remove the diffuse large-scale Galactic radio emission. G178.24.2 has a size of , and G25.12.3 has a size of . Following Gao et al. (2011) we measured the mean values at the corners of the Stokes , , and maps in areas without obvious structures. A hyper plane defined by these corner mean values was subtracted to get the ‘intrinsic’ total intensity () and polarization intensity () images of the objects (Figs. 1 and 2). The values were calculated as following Wardle & Kronberg (1974). To study these objects and obtain their integrated flux densities, it is necessary to first subtract point-like sources in the field of the objects. Obvious discrete point-like radio sources were directly subtracted from the Urumqi 6 cm, and also the Effelsberg 11 cm and 21 cm maps as we will use in the next Section, by Gaussian fitting. Some unresolved sources were identified in the NVSS catalog (Condon et al. 1998). The flux densities of these sources in our observing bands were extrapolated from the NVSS flux density at 1.4 GHz, , using a spectral index either derived between the flux densities from the NVSS and the Effelsberg 11 cm survey or quoted from Vollmer et al. (2005). Otherwise, the mean spectral index for a large sample of radio sources in the NVSS and WSRT surveys, (Zhang et al. 2003), was used, if the spectral index of a source could not be determined. The total-intensity maps with point-like sources subtracted are shown in the central panels of Fig. 1 and 2.
| Objects | G178.24.2 | G25.12.3 |
|---|---|---|
| () | 178.2 | 25.1 |
| () | 4.2 | 2.3 |
| RAJ2000 (H M S) | 05 25 06 | 18 45 09 |
| DECJ2000 ( ) | 28 11 02 | 07 59 42 |
| Size (arcmin arcmin) | 7262 | 8030 |
| (Jy) | 1.00.1 | 3.70.4 |
| (Jy) | 1.60.2 | 4.70.5 |
| (Jy) | 1.80.2 | 6.70.7 |
| Spectral index | 0.480.13 | 0.490.13 |
| : central observing frequencies can be found in the labels of Fig. 5. | ||
2.1 G178.24.2
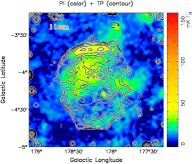
G178.24.2 is located in the anti-center region of the Galaxy and displays a circular morphology with a prominent shell in its north. Three strong radio sources, NVSS J052423+281232, NVSS J052427+281255, and NVSS J052432+281313 are located in the center of the SNR, which are the three components of the double-sided radio source 3C 139.2 (Leahy & Williams 1984; Liu & Zhang 2002) and not related to the SNR. Subtracting these and other point-like sources, the extended emission of the entire SNR G178.24.2 is clearly visible (see the central panels of Fig. 1). Strong polarized emission from the northern shell of G178.24.2 is detected at 6 cm, with the B-field directions orientated tangential to the shell.
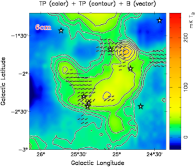
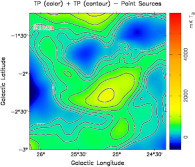
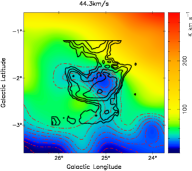
2.2 G25.12.3
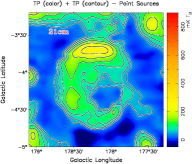
A well-pronounced half-shell structure of 80 in length is visible at , after strong diffuse emission from the Galactic plane is filtered out (see Fig. 2). The background radio source centered at is composed by NVSS J184245075613 and NVSS J184249075604 (Condon et al. 1998) and is subtracted. It is not clear whether the extended structure around is a part of G25.12.3, because its spectral index from a TT-plot analysis remains inconclusive. In this paper we only discuss the radio properties of the shell region outlined in Fig. 2.
3 Radio properties of G178.24.2 and G25.12.3
The radio morphologies of G178.24.2 and G25.12.3 at 6 cm, as well as the properties discussed below, suggest that both objects are SNRs. Using the radio maps at three bands, i.e. 6 cm observed by using the Urumqi 25-m telescope as described above, 11 cm and 21 cm by the Effelsberg 100-m telescope, we hereby study the radio spectrum and polarization properties of G178.24.2 and G25.12.3.


We extracted the maps of G178.24.2 and G25.12.3 from the Effelsberg Galactic plane surveys at 11 cm (Fürst et al. 1990; Reich et al. 1990a) and 21 cm (Reich et al. 1990b, 1997), see Fig. 1 and Fig. 2. The angular resolution is 44 for the 11 cm Effelsberg observations and 94 for the 21 cm observations. The 21 cm map of G178.24.2 was extracted from an unpublished section of the ‘Effelsberg Medium Latitude Survey (EMLS)’ (Reich et al. 2004).
We noticed, however, that G178.24.2 was poorly traced in the 11 cm survey map due to its limited sensitivity. The northern part of G178.24.2 is clearly detected near the edge of the recent Effelsberg 11 cm map of S147 (Xiao et al. 2008) made with a new receiver. We therefore observed G178.24.2 again in March 2011 with the Effelsberg 100-m telescope for the new 11 cm map. The 80 MHz bandwidth of the 11 cm receiver was connected to an 8-channel polarimeter centered at 2639 MHz. The lowest 10 MHz channel was corrupted by interference and could not be used. The radio source, 3C286, was used as the main calibrator assuming Jy and 9.9% linear polarization and a polarization angle of 33. We obtained six full coverages of the field with in total 4 sec integration time per pixel. We added the maps of seven channels without interference, and applied the standard data reduction and calibration procedures as already described by Xiao et al. (2008, 2009). The rms-noise measured in emission-free areas was 3.2 in the total-intensity and 2.9 in the polarization-intensity map. The G178.24.2 11 cm maps in Fig. 1 are from the new observations, rather than extracted from the 11 cm survey data.
We measured the integrated flux densities of G178.24.2 and G25.12.3 from the radio maps at 6 cm, 11 cm, and 21 cm. We got Jy, Jy, and Jy for G178.24.2, and Jy, Jy, and Jy for the outlined area of G25.12.3 (see Fig. 2). The spectral indices fitted from these integrated flux densities (see Fig. 3) are for G178.24.2 and for the shell of G25.12.3, which indicate the non-thermal nature of radio emission of these two objects. These results are summarized in Table 1.
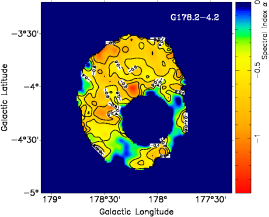
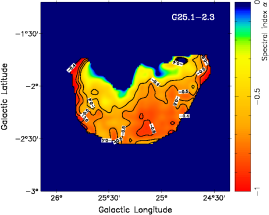
Spectral index maps for these two objects were derived from radio maps at three wavelengths, as shown in Fig. 4. The spectral indices vary in different areas. The spectral index of the northern shell of G178.24.2 is about , and that of the southern shell of G25.12.3 is about .


These spectral indices were verified by TT-plots (Turtle et al. 1962). From the brightness temperatures at two frequencies plotted against each other, the brightness spectral index, , is defined as , so that . As shown in Fig. 5, we got and for the northern shell of G178.24.2, and and for the southern shell of G25.12.3. These values all agree with the results derived from the integrated flux densities and spectral index maps.
Using the total intensity and the radio spectral index, we calculated the surface brightness of both objects at 1 GHz (e.g. Kothes et al. 1998), obtaining for G178.24.2, and for the southern shell of G25.12.3. The surface brightness for G178.24.2 is to date the second lowest for a Galactic SNR, and only slightly above that of the lowest, reported for SNR G156.2+5.7 (Reich et al. 1992).
Polarization observations of the G178.24.2 field are available at 6 cm, 11 cm, and 21 cm. The diffuse extended polarized emission at 21 cm (see the right bottom panel in Fig. 1) varies and has no obvious structural relation to G178.24.2. We therefore conclude that at 21 cm, most probably we see polarized diffuse foreground or background Galactic emission and will not consider it in the following discussion.
At 11 cm, the new sensitive Effelsberg observations of G178.24.2 not only show significant polarized emission in the northern shell but also two large patches of weak polarized regions (see the middle right panel in Fig. 1). The shell structure is better resolved at 11 cm than at 6 cm, and the detected polarized emission appears strong along the shell ridge. The small polarization patch near , has a very different morphology when compared with the total-intensity map, and hence is most likely not the emission from the SNR. The large polarization patch between and has a polarization percentage exceeding 100%. The total-intensity radio emission from the SNR is very weak and flocculent in this area, while the polarized emission is significant and continuous, which indicates that this polarized emission patch is likely also not physically related to the SNR, otherwise it should also appear at 6 cm. However, neither of the 11 cm polarization patches has a counterpart at 6 cm, which strongly suggests that these polarized 11 cm features originate from unrelated Galactic emission within the interstellar medium. Polarization along the shell is clearly detected at both frequencies.
At 6 cm, strong polarized emission is detected from the northern shell of G178.24.2, while weak polarized emission is spread over a large area both within and outside of the SNR. These weak polarization patches are diffuse and extended and have a brightness of a few mK . The lower and the central patches inside the SNR are clearly not related to the total-intensity emission and thus unlikely related to the SNR. Therefore, the polarized emission reliably detected from G178.24.2 at both 6 cm and 11 cm is of the shell region. The polarization angles of the two frequencies differ by about 20, corresponding to a rotation measure of about 36 + n 350 rad m-2 (n = 1, 2 …) by accounting for the n-ambiguity. Because of low values in the anti-center region (e.g. Spoelstra 1984; Sun et al. 2008), is the most reasonable choice, so that = 36 rad m-2. This value is slightly larger but comparable to rad m-2 for the source NVSS J052423+281232 at within the SNR and rad m-2 for NVSS J052734+285134 at outside the SNR (Taylor et al. 2009) and the mean value of about 10 rad m-2 found for the nearby SNR S147 region (Xiao et al. 2008).
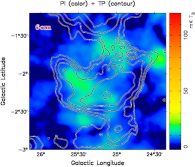
Polarization observations of the G25.12.3 field are available at 6 cm, and 11 cm. Some weak polarization patches have been detected at 6 cm and 11 cm (see Fig. 2, right panels). They have a very different morphology to the total-intensity emission, and seem not to be associated with the southern shell of G25.12.3. In general, intrinsic polarized emission of a SNR should be detectable at a higher frequency. This is not the case for G25.12.3. Comparing the morphologies of the 6 cm and 11 cm polarization map of G25.12.3, we conclude that the detected polarized radio emission at both wavelengths is not associated with the SNR. This is not unusual in this direction of the inner Galaxy, where the polarized emission originates from diffuse emission in a complex environment within the 6 cm polarization horizon of about 3 kpc (see Sun et al. 2011).
4 Signatures in other bands
We have overlaid the radio maps of these two SNRs onto images from other bands to see whether there is any spatial coincidence.
We superimposed the 6 cm total intensity contours of G178.24.2 and G25.12.3 onto the images of the integrated CO image (Dame et al. 2001), the soft X-ray image in the 0.4-2.4 keV band and the super-soft X-ray image in the 0.1-0.4 keV band111http://www.xray.mpe.mpg.de/cgi-bin/rosat/rosat-survey. We could find no structural coincidence in these images with G178.24.2 and G25.12.3.
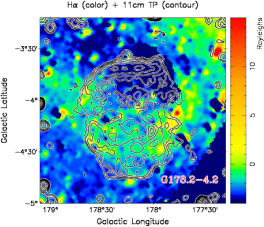
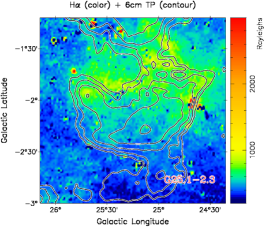
Using “The Virginia Tech Spectral-Line Survey (VTSS)222http://www.phys.vt.edu/~halpha/” and “The Southern H-Alpha Sky Survey Atlas (SHASSA)333http://amundsen.swarthmore.edu/” (Gaustad et al. 2001) for arcmin-resolution digital images of interstellar H emission, we have overlaid the total-intensity contour map of G178.24.2 at 6 cm onto the VTSS H image and that of G25.12.3 at 11 cm onto the SHASSA H image (Fig. 6). In the area of G178.24.2, a very weak broad band of H emission runs across the SNR area and is considered to be background or foreground emission. In the field of G25.12.3, a strong H emission patch is found to the north of the radio shell. The H emission appears to be weak within the shell areas of both G178.24.2 and G25.12.3. Therefore, we consider that the H emissions present in these directions are probably not physically associated with the SNRs.
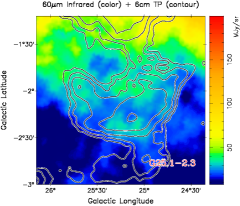
We compared the radio maps of G178.24.2 and G25.12.3 with the IRIS444http://www.ias.fr/IRIS/ 60 m infrared images (Miville-Deschênes & Lagache 2005). No coincidence was found for G178.24.2. Fig. 7 shows G25.12.3, where the infrared patch positions have clear offsets to the radio shell. Therefore, we conclude that both G178.24.2 and G25.12.3 have no corresponding infrared emission.
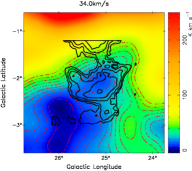
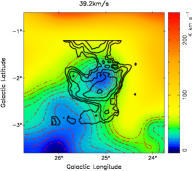
Very often SNRs show an associated H I cavity. The Leiden/Argentina/Bonn (LAB) H I survey data with a velocity resolution of 1.3 km/s (Hartmann & Burton 1997; Kalberla et al. 2005) was used to search for H I structures related to the SNRs in the velocity range from 450 to 400 km/s, although the angular resolution of 36 for the H I data is coarse. In the area of G178.24.2, there is a H I shell centered at , seen at a central radial velocity of 3.2 km/s over a velocity range of 17.5 km/s (Ehlerová & Palouš 2005). This is clearly larger than the SNR extent, and its relation to the SNR cannot be settled. In the area of G25.12.3, an H I cavity is found in the velocity range of 37.1 to 41.2 km/s (see Fig. 8), which has a very similar shape to G25.12.3 and hence might be related to the SNR. The kinetic distance for the central velocity of 39.2 km/s is 2.9 or 12.4 kpc according to the Galactic rotation model by Fich et al. (1989). These two values correspond to a span of 67 pc or 288 pc of the shell structure, respectively. Considering the physical size of the SNR shell, the nearer distance is preferred.
For some SNRs, the empirical relation between the surface brightness and diameter (e.g. Clark & Caswell 1976) is the only tool to estimate their distances, though with large uncertainties (e.g. Green 1984, 2004). We used the updated relation of Case & Bhattacharya (1998) to estimate the distances of both objects we newly found. For G178.24.2, we found the corresponding diameter of that surface brightness is 197 pc, so that its distance is 9.4 kpc, which places the object very outside the Galaxy and seems not possible. For G25.12.3, we found the diameter for the shell is 72 pc and the distance is 3.1 kpc, consistent with those derived from the HI data. Note, however, that the uncertainties of these estimates could be as large as 40%.
Several pulsars are known within the field of G25.12.3 (Fig. 2). They have distances of 4 6 kpc according to the pulsar dispersion measure and the electron distribution model of the Galaxy, NE2001 (Cordes & Lazio 2002). It is not possible to associate any of these pulsars with the SNR unambiguously.
5 Summary
We have found two shell-like objects, G178.24.2 and G25.12.3, from the radio map of the Sino-German 6 cm polarization survey of the Galactic plane. In addition, using the Effelsberg 11 cm and 21 cm continuum and polarization maps, a shell-type morphology is confirmed for both. Their radio spectra are characteristic of non-thermal emission with spectral indices for the shells of for G178.24.2 and for G25.12.3. Such values are typical for SNRs. An ordered magnetic field runs along the northern shell of G178.24.2. An H I cavity, likely at a distance of about 2.9 kpc, is probably associated with the SNR G25.12.3. This would imply a diameter of up to 67 pc in size.
Acknowledgements.
We like to thank the anonymous referee for helpful comments. The Sino-German 6 cm polarization survey was carried out with a receiver system constructed by Mr. Otmar Lochner at MPIfR mounted at the Nanshan 25-m telescope of the Urumqi Observatory of NAOC. The MPG and the NAOC/CAS supported the construction of the receiving system by special funds. We thank Mr. Maozheng Chen and Mr. Jun Ma for qualified maintenance of the receiving system for many years. The new 11 cm map of G178.24.2 is based on observations with the 100-m telescope of the MPIfR at Effelsberg. The Chinese authors are supported by the National Natural Science foundation of China (10773016, 10821061, and 10833003), the National Key Basic Research Science Foundation of China (2007CB815403), and the Partner group of the MPIfR at NAOC in the frame of the exchange program between MPG and CAS for many bilateral visits. XYG thanks the joint doctoral training plan between CAS and MPG and the financial support from CAS and MPIfR. XHS thanks the MPG and Prof. Michael Kramer for financial support during his stay at the MPIfR. We used the H images for G178.24.2 from the Virginia Tech Spectral-Line Survey (VTSS), which is supported by the National Science Foundation. We thank Prof. Ernst Fürst for critically reading the manuscript.References
- Berkhuijsen (1984) Berkhuijsen, E. M. 1984, A&A, 140, 431
- Brogan et al. (2006) Brogan, C. L., Gelfand, J. D., Gaensler, B. M., Kassim, N. E., & Lazio, T. J. W. 2006, ApJ, 639, L25
- Case & Bhattacharya (1998) Case, G. L., & Bhattacharya, D. 1998, ApJ, 504, 761
- Clark & Caswell (1976) Clark, D. H., & Caswell, J. L. 1976, MNRAS, 174, 267
- Condon et al. (1998) Condon, J. J., Cotton, W. D., Greisen, E. W., et al. 1998, AJ, 115, 1693
- Cordes & Lazio (2002) Cordes, J. M., & Lazio, T. J. W. 2002, ArXiv Astrophysics e-prints
- Dame et al. (2001) Dame, T. M., Hartmann, D., & Thaddeus, P. 2001, ApJ, 547, 792
- Ehlerová & Palouš (2005) Ehlerová, S., & Palouš, J. 2005, A&A, 437, 101
- Fich et al. (1989) Fich, M., Blitz, L., & Stark, A. A. 1989, ApJ, 342, 272
- Fürst et al. (1989) Fürst, E., Reich, W., Kühr, H., & Stickel, M. 1989, A&A, 223, 66
- Fürst et al. (1990) Fürst, E., Reich, W., Reich, P., & Reif, K. 1990, A&AS, 85, 691
- Gao et al. (2011) Gao, X. Y., Han, J. L., Reich, W., et al. 2011, A&A, 529, A159
- Gao et al. (2010) Gao, X. Y., Reich, W., Han, J. L., et al. 2010, A&A, 515, A64
- Gaustad et al. (2001) Gaustad, J. E., Rosing, W., McCullough, P., & Van Buren, D. 2001, in Astronomical Society of the Pacific Conference Series, Vol. 246, IAU Colloq. 183: Small Telescope Astronomy on Global Scales, ed. B. Paczynski, W.-P. Chen, & C. Lemme, 75
- Green (1984) Green, D. A. 1984, MNRAS, 209, 449
- Green (2004) Green, D. A. 2004, Bulletin of the Astronomical Society of India, 32, 335
- Green (2009) Green, D. A. 2009, Bull. Astron. Soc. India, 37, 45
- Hartmann & Burton (1997) Hartmann, D., & Burton, W. B. 1997, Atlas of Galactic Neutral Hydrogen, Cambridge University Press
- Kalberla et al. (2005) Kalberla, P. M. W., Burton, W. B., Hartmann, D., et al. 2005, A&A, 440, 775
- Kothes et al. (1998) Kothes, R., Fürst, E., & Reich, W. 1998, A&A, 331, 661
- Leahy & Williams (1984) Leahy, J. P., & Williams, A. G. 1984, MNRAS, 210, 929
- Li et al. (1991) Li, Z., Wheeler, J. C., Bash, F. N., & Jefferys, W. H. 1991, ApJ, 378, 93
- Liu & Zhang (2002) Liu, F. K., & Zhang, Y. H. 2002, A&A, 381, 757
- Miville-Deschênes & Lagache (2005) Miville-Deschênes, M., & Lagache, G. 2005, ApJS, 157, 302
- Reich et al. (1997) Reich, P., Reich, W., & Fürst, E. 1997, A&AS, 126, 413
- Reich (2002) Reich, W. 2002, in Neutron Stars, Pulsars, and Supernova Remnants, ed. W. Becker, H. Lesch, & J. Trümper, 1
- Reich et al. (1992) Reich, W., Fürst, E., & Arnal, E. M. 1992, A&A, 256, 214
- Reich et al. (1988) Reich, W., Fürst, E., Reich, P., & Junkes, N. 1988, in IAU Colloq. 101: Supernova Remnants and the Interstellar Medium, ed. R. S. Roger & T. L. Landecker, 293
- Reich et al. (1990a) Reich, W., Fürst, E., Reich, P., & Reif, K. 1990a, A&AS, 85, 633
- Reich et al. (2004) Reich, W., Fürst, E., Reich, P., et al. 2004, in The Magnetized Interstellar Medium, ed. B. Uyanıker, W. Reich, & R. Wielebinski, 45
- Reich et al. (1990b) Reich, W., Reich, P., & Fürst, E. 1990b, A&AS, 83, 539
- Shi et al. (2008) Shi, W. B., Han, J. L., Gao, X. Y., et al. 2008, A&A, 487, 601
- Sofue & Reich (1979) Sofue, Y., & Reich, W. 1979, A&AS, 38, 251
- Spoelstra (1984) Spoelstra, T. A. T. 1984, A&A, 135, 238
- Sun et al. (2007) Sun, X. H., Han, J. L., Reich, W., et al. 2007, A&A, 463, 993
- Sun et al. (2006) Sun, X. H., Reich, W., Han, J. L., Reich, P., & Wielebinski, R. 2006, A&A, 447, 937
- Sun et al. (2011) Sun, X. H., Reich, W., Han, J. L., et al. 2011, A&A, 527, A74
- Sun et al. (2008) Sun, X. H., Reich, W., Waelkens, A., & Enßlin, T. A. 2008, A&A, 477, 573
- Tammann et al. (1994) Tammann, G. A., Loeffler, W., & Schroeder, A. 1994, ApJS, 92, 487
- Taylor et al. (2009) Taylor, A. R., Stil, J. M., & Sunstrum, C. 2009, ApJ, 702, 1230
- Turtle et al. (1962) Turtle, A. J., Pugh, J. F., Kenderdine, S., & Pauliny-Toth, I. I. K. 1962, MNRAS, 124, 297
- Vollmer et al. (2005) Vollmer, B., Davoust, E., Dubois, P., et al. 2005, A&A, 431, 1177
- Wardle & Kronberg (1974) Wardle, J. F. C., & Kronberg, P. P. 1974, ApJ, 194, 249
- Xiao et al. (2008) Xiao, L., Fürst, E., Reich, W., & Han, J. L. 2008, A&A, 482, 783
- Xiao et al. (2011) Xiao, L., Han, J. L., Reich, W., et al. 2011, A&A, 529, A15
- Xiao et al. (2009) Xiao, L., Reich, W., Fürst, E., & Han, J. L. 2009, A&A, 503, 827
- Xu et al. (2007) Xu, J. W., Han, J. L., Sun, X. H., et al. 2007, A&A, 470, 969
- Zhang et al. (2003) Zhang, X., Reich, W., Reich, P., & Wielebinski, R. 2003, ChJAA, 3, 347