Measurements of the CKM angle at the Factories
Himansu Sahoo on behalf of the Belle and BaBar Collaborations
Department of Physics and Astronomy, University of Hawaii at Manoa, Honolulu, Hawaii, 96848, USA, himansu@phys.hawaii.edu
Abstract
In this proceeding, we report the recent measurements of the CKM angle using large data samples collected by the Belle and BaBar experiments. The experiments have collected more than 1 billion pairs of data sample at the resonance using the facilities of the asymmetric-energy colliders KEKB and PEP-II.
PRESENTED AT
The Ninth International Conference on
Flavor Physics and CP Violation
(FPCP 2011)
Maale Hachamisha, Israel, May 23–27, 2011
1 Introduction
In the standard model (SM), violation in meson decays originates from an irreducible complex phase in the Cabibbo-Kobayashi-Maskawa (CKM) mixing matrix [1]. The unitarity condition of the CKM matrix gives rise to a relation , which can be represented by a triangle in the complex plane, known as the Unitarity Triangle (UT). The main objective of the -factories is to test the SM picture of the origin of violation by measuring the angles (denoted by , and )***BaBar uses an alternative notation , and corresponding to , and . and sides of the UT using different decays. In this paper, we report the recent measurements concerning the angle ().
2 Experimental Apparatus
The measurements discussed in this paper have been obtained by the Belle and BaBar experiments, located at the KEKB and PEP-II asymmetry-energy factories. The accelerators operate at the resonance, which is produced with a Lorentz boost of 0.43 at KEKB (3.5 on 8.0 GeV) [2] and 0.56 at PEP-II (3.1 on 9.0 GeV) [3]. The KEKB accelerator of the factory in Japan achieved the current world record with a peak luminosity of . Both the experiments have already stopped data dating. BaBar stopped operation in April 2008 and collected more than 430 of data at resonance. Belle stopped operation in June 2010 and collected more than 710 of data. After a decade of successful operation, the factories have a data sample of nearly pairs. The Belle and BaBar detectors are described in detail elsewhere [4, 5].
3 Measurements of
Measurements of time-dependent CP asymmetries in meson decays that proceed via the dominant CKM favored tree amplitude, such as , have provided a precise measurement of the angle , thus providing a crucial test of the mechanism of violation in the SM. For such decays the interference between the tree amplitude and the amplitude from mixing is dominated by the single phase . Other decay modes, which allow the measurements of are transitions like , , . These modes are dominated by tree diagram, but loop may contribute. We can also measure from pure penguin decays like , , , , and . In these decays sensitivity to new physics (NP) increases.
The measurement from the factories is one of the main constraints in the global fit by CKM fitter Collaboration. Recently CKM fitter reported a tension () between the measurement of and the value predicted from other observables excluding this measurement. So further measurements of will help to clarify this tension.
4 Analysis Technique
In the meson system, the violating asymmetry lies in the time-dependent decay rates of the and decays to a common -eigenstate (). The asymmetry can be written as:
where
| (1) |
Here is the decay rate of a meson decays to at a proper time after the production, is the mass difference between the two neutral mass eigenstates, is a complex parameter depending on the mixing as well as the decay amplitudes of the meson decays to the eigenstate. The parameter is the measure of mixing-induced violation, whereas is the measure of direct violation†††Note that BaBar uses the convention = ..
In the factories, in order to measure the time-dependent violation parameters, we fully reconstruct one neutral meson into a eigenstate. From the remaining particles in the event, the vertex of the other meson is reconstructed and its flavor is identified. In the decay chain , where one of the mesons decays at time to a eigenstate , which is our signal mode, and the other decays at time to a final state that distinguishes between and , the decay rate has a time dependence given by [6]
| (2) |
Here is the neutral lifetime, , and the -flavor charge equals () when the tagging meson is identified as (). Since the and are approximately at rest in the center-of-mass system, can be determined from the displacement in between the and decay vertices: , where is the speed of light. The vertex position of the decay is reconstructed using charged tracks (for example, lepton tracks from in decays) and that of the decay from well-reconstructed tracks that are not assigned to [7]. The is approximately 200 m in Belle and 250 m in BaBar. We also consider the effect of detector resolution and mis-identification of the flavor [8]. Finally, the violation parameters are obtained from an unbinned maximum likelihood fit to the distribution.
5 Decay Modes
The decays are known as the golden modes for violation measurements. They have clean experimental signatures: many accessible modes with relatively large branching fractions , low experimental background levels and high reconstruction efficiencies. These modes are dominated by a color-suppressed tree diagram and the dominant penguin diagram has the same weak phase. The violation comes from the element in the mixing box diagram, which contains the phase. For final states resulting from a transition, the SM predicts and , where is known as the eigenvalue and have values () for -even (-odd) final states. The asymmetry is given as
| (3) |
We can verify this experimentally by measuring the number of decays to eigenstate. Because of the high experimental precision and low theoretical uncertainty these modes provide a reference point in the SM. A non-zero value of or any measurement of that has a significant deviation indicates an evidence for NP.
Belle recently reported new measurements with its full data sample ( pairs) using the modes , and . The candidates are reconstructed from their decays to and , with the reconstructed from . The candidates are reconstructed from , as well as decays. The is reconstructed from its decays to . Belle reported nearly 15600 -odd signal events with a purity of and nearly 10000 -even signal events with a purity of . Belle observed violation in all charmonium modes and the results are summarized in Table 1.
| Decay Mode | ||
|---|---|---|
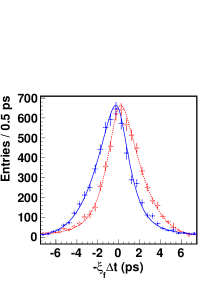
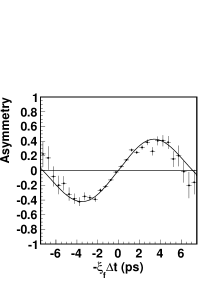
Figure 1 shows the background-subtracted distributions for good-tagged events only (all charmonium modes are combined). We define the raw asymmetry in each bin as , where is the number of observed candidates with . The systematic uncertainties are significantly improved compared to the previous Belle measurements [9, 10] due to a better model for the resolution function (decay mode independent). Combining all charmonium modes, Belle reported the world’s most precise measurements:
| (4) |
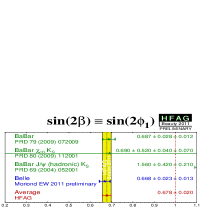
BaBar reconstructed the decay modes , , , and . Using a data sample of pairs, BaBar reported nearly 8400 -odd signal events with a purity of and nearly 5800 -even signal events with a purity of . Combing all charmonium modes BaBar measured and [11].
Combining the measurements from Belle and BaBar, the new world average calculated by the Heavy Flavor Averaging Group (HFAG) is [12]
| (5) |
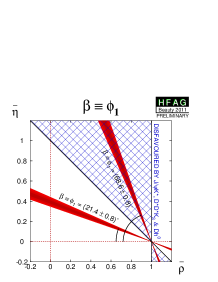
Figure 2 summarizes the results of for decays from Belle and BaBar. The measurements of the two experiments agree very well within the statistical uncertainties. The experimental uncertainty on is reduced to and thus serves as a firm reference point for the SM. The value of is consistent with zero. The new results will definitely provide a better constraint on the allowed region in the CKM fitter. The measurement of leaves a two-fold ambiguity in the value of . Both Belle and BaBar measured the sign of to be positive at and confidence levels, respectively. This favors the smaller value of solution. The new measurements give the value [12]
| (6) |
which is the most precise measurement with error.
6 Decay Modes
The decay takes place through a transition. The dominant tree diagram is Cabibbo-suppressed. However, there is a penguin diagram of the same order that has a different weak phase. So, small deviation in from golden modes is expected in the SM. The BaBar result provides an evidence of violation at level [13], while the value for Belle result is [14]. The decay also goes through the transition. This mode requires an angular analysis to separate -even and -odd events. Belle reports a statistical significance of for direct violation in the mode [15].
7 Decay Modes
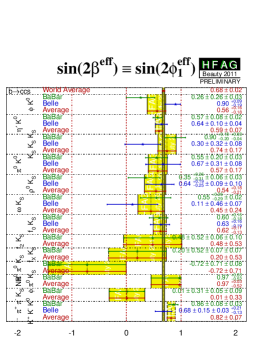
An alternative way to measure the angle is to measure the time-dependent asymmetries in charmless hadronic final states. These are penguin dominated decays. Any non-SM particles, like Higgs or SUSY particles can enter the loop. So, these are sensitive to NP. The value of is expected to be for a pure penguin amplitude, but can be different if there is an extra phase from NP. As a consequence, an effective value is measured. Significant deviation from in golden modes would indicate NP. The deviations have been estimated in several theoretical models and are expected to be positive. These estimates are mode and model dependent.
Belle and BaBar have recently performed time-dependent Dalitz analyses in the [16] final state using [17] and pairs, respectively. This gives directly the value of (we do not need to worry about the two-fold ambiguity here). The results are consistent with the SM expectation from decays. The in various penguin modes is summarized in Fig. 3. The results are consistent between Belle and BaBar and also consistent with the SM expectation within the statistical uncertainties. It is fair to say that we need more data to see a sensitivity comparable with theoretical uncertainties.
8 Conclusion
In this review, we have presented the recent measurements of the CKM angle by Belle and BaBar. Thanks to the excellent performance of the two factories, which collected large data sample at the resonance; the angle has been measured with precision. The violating parameters in decays are the most precise measurements and provides a reference point for new physics searches. The time-dependent asymmetry in penguin dominated decays is consistent with standard model expectations within the uncertainties of the measurement.
ACKNOWLEDGEMENTS
I would like to thank my Belle colleagues for their valuable help in providing information regarding the measurements of . I am also thankful to the conference organizers for their invitation to present this review.
References
- [1] N. Cabibbo, Phys. Rev. Lett. 10, 531 (1963); M. Kobayashi and T. Maskawa, Prog. Theor. Phys. 49, 652 (1973).
- [2] S. Kurokawa and E. Kikutani, Nucl. Instrum. Methods Phys. Res., Sect. A 499, 1 (2003), and other papers included in this volume.
- [3] PEP-II Conceptual Design Report, SLAC-PUB-0418 (1993).
- [4] A. Abashian et al., Nucl. Instrum. Methods Phys. Res., Sect. A 479, 117 (2002).
- [5] B. Aubert et al., Nucl. Instrum. Methods Phys. Res., Sect. A 479, 1 (2002).
- [6] A. B. Carter and A. I. Sanda, Phys. Rev. D 23, 1567 (1981); I. I. Bigi and A. I. Sanda, Nucl. Phys. B 193, 85 (1981).
- [7] H. Tajima et al., Nucl. Instrum. Methods Phys. Res., Sect. A 533, 370 (2004).
- [8] H. Kakuno et al., Nucl. Instrum. Methods Phys. Res., Sect. A 533, 516 (2004).
- [9] K.-F. Chen et al. (Belle Collaboration), Phys. Rev. Lett. 98, 031802 (2007).
- [10] H. Sahoo et al. (Belle Collaboration), Phys. Rev. D 77, 091103 (2008).
- [11] B. Aubert et al. (BaBar Collaboration), Phys. Rev. D 79, 072009 (2009).
- [12] Heavy Flavor Averaging Group, winter 2011 update. Check their webpage for updated results: http://www.slac.stanford.edu/xorg/hfag/.
- [13] B. Aubert et al. (BaBar Collaboration), Phys. Rev. Lett. 101, 021801 (2008).
- [14] S. E. Lee et al. (Belle Collaboration), Phys. Rev. D 77, 071101 (2008).
- [15] S. Fratina et al. (Belle Collaboration), Phys. Rev. Lett. 98, 221802 (2007).
- [16] Y. Nakahama et al. (Belle Collaboration), Phys. Rev. D 82, 073011 (2010).
- [17] B. Aubert et al. (BaBar Collaboration), arXiv:0808.0700.