22institutetext: Physics Dept., UMIST, PO Box 88, Manchester, M60 1QD, UK
33institutetext: University of Manchester, Jodrell Bank Observatory, Macclesfield, Cheshire SK11 9DL, UK
The Masers Towards IRAS
We present MERLIN observations of OH, water and methanol masers towards the young high mass stellar object IRAS . Emission from the 1665-MHz OH, 22-GHz H2O and 6.7-GHz CH3OH masers is detected and all originates very close to the central source. The OH and methanol masers appear to trace part of the circumstellar disk around the central source. The positions and velocities of the OH and CH3OH masers are consistent with Keplerian rotation around a central mass of 5 M⊙. The water masers are offset from the OH and CH3OH masers and have significantly changed since they were last observed, but still appear to be associated to the outflow from the source. All the OH masers components are circularly polarised, in some cases reaching 100 percent while some OH components also have linear polarisation. We identify one Zeeman pair of OH masers and the splitting of this pair indicates a magnetic field of strength mG within (850 AU) of the central source. The OH and CH3OH maser emission suggest that the disk material is dense, cm-3, and warm, K and the high abundance of CH3OH required by the maser emission is consistent with the evaporation of the mantles on dust grains in the disk as a result of heating or shocking of the disk material.
Key Words.:
stars: formation, masers, ISM: individual: IRAS1 Introduction
The extreme brightness and compact size of masers make them valuable probes of regions of high mass star formation. However it is not clear how, or indeed if, the different types of maser, H2O , OH and CH3OH, are related to each other towards typical high mass protostars. Studies of H2O and CH3OH masers towards a number of sources have failed to find a coherent view of their relationship (e.g. Beuther et al 2002), however statistical studies of OH and CH3OH masers suggest that their associations can tell us about the evolutionary sequence of star formation (e.g. Caswell 1997; Szymczak, & Gerard 2004).
While the presence of particular types of maser towards a source may trace the evolutionary stage of the source, many sources show emission from multiple types of masers. Since the different masers can require different excitation conditions, these multiple species can be used as high resolution probes of different components of the circumstellar environment. Theoretical models suggest that the spatial coincidence of different maser transitions or maser species can be used to infer the properties of the emitting material. For example, Cragg et al. (2002) found that gas phase molecular abundance is the key determinant of observable maser activity for both OH and CH3OH molecules. Detailed modelling of high resolution observations towards particular sources can also provide value insights on the structure of the circumstellar material. For example, models have shown that the complexity of observed magnetic field structure in W75N can be explained by the maser emission originating from different depths within the protostellar disk (Gray et al. 2003).
With these possibilities in mind, we present here the results of a study of the H2O , OH and CH3OH masers associated with the well studied high mass young source IRAS . This source is located in the Cygnus X region at an estimated distance of 1.7 kpc (Wilking et. al. 1989). It has a luminosity of L⊙ and is perhaps the best studied example of massive protostar associated with a Keplerian disk and a jet/outflow system. The molecular outflow has been mapped by Cesaroni et al. (1997; C97) and observations at centimetre wavelengths have shown that the outflow is fed by a jet (Hofner et al. 1999). On the other hand, CH3CN (5-4) observations (C97) have revealed a molecular disk almost perpendicular to the jet axis and rotating around the embedded young stellar object (YSO) at the origin of the outflow/jet. Subsequent observations in the CH3CN (12-11) (Cesaroni et al. 1999; C99) and NH3 (1,1) lines (Zhang et al. 1998) have found evidence for Keplerian rotation, implying a central disk plus stellar mass of 24 M⊙.
The source is associated with OH, H2O and CH3OH masers. Two features of OH masers were detected in the 1665-MHz line by Cohen et al. (1988) and more recent unpublished VLA data (Cohen, priv. comm.). Observations of the water masers using the VLA with angular resolution of identified three emission regions (Tofani et al. 1995). Moscadelli et al. (2000; hereafter MCR) resolved two of these into 26 unresolved spots using the VLBA. The velocity and spatial structure of these spots were well fitted by a model with the spots arising at the interface between a jet and the surrounding molecular gas. Maser emission from the 6.7-GHz line of CH3OH has recently been observed by Minier et al. (2001). Using the EVN, they found two maser clumps separated by 100 AU and to the north of the central source, a region relatively remote from the central source and with no other known indication of activity related to star formation.
To determine how these three types of masers are related to the circumstellar disk and/or the jet and investigate the connection between them, we have observed IRAS at high angular resolution using MERLIN. The details of the observations and reduction are given in Sec. 2 and the results presented in Sec. 3. In Sec. 4 we discuss the interpretation while conclusions are drawn in Sec. 5.
| Type of maser | OH | H2O | CH3OH |
|---|---|---|---|
| Date of observation | 20 | 28 & 29 | 16 & 17 |
| Jan 2002 | Mar 2002 | May 2002 | |
| Antenna Used | De CA DA | CA MK2 DA | CA MK2 |
| KN MK2 TA | KN TA | ||
| Field centre (2000) | |||
| Rest frequency (MHz) | 1665.402 1667.359 | 22235.0798 | 6668.518 |
| No. of frequency channels | 1024 | 256 | 512 |
| Total band width (MHz) | 1 | 4 | 2 |
| bandpass calibrator | 3C84 | 4C39.25 | 3C84 |
| Polarisation angle calibrator | 3C286 | No | No |
| Phase calibrator | 2005+403 | 2005+403 | 2005+403 |
2 Observations and data reduction
Table 1 gives the parameters for the MERLIN observations. All measurements used the same phase calibrator source 2005+403 to retrieve the absolute position of the maser spots and therefore compare their locations from one line to another with high accuracy. A bandpass calibrator was observed to calibrate the variation of instrumental gain and phase across the spectral bandpass. For OH, observations of 3C286 were also made during the observing run, with the same correlator configuration and bandwidth, to calibrate the polarisation characteristics. The data were reduced in Jodrell Bank observatory using the MERLIN d-programs and the AIPS software package.
2.1 OH masers
IRAS was observed in the 1665- and 1667-MHz OH maser transitions in January 2002 using six telescopes of the MERLIN network. The frequencies were alternated during the observations, cycling between the two OH line frequencies, to provide data on both transitions spread over the whole observing track. The velocity resolution was 0.42 km s-1 for a total of 1 MHz spectrum bandwidth corresponding to 180 km s-1 velocity range. The left- and right-hand circular (LHC and RHC) polarisation data for each baseline were simultaneously correlated in order to obtain all Stokes parameters. Using d-programs (see Diamond et al. 2003), the data were edited and corrected for gain-elevation effects. The flux density of the amplitude calibrator 3C84, was determined by comparing the visibility amplitudes on the shortest baselines with those of 3C286. Using flux densities of 13.6 Jy at 1665 MHz and 1667 MHz for 3C286 (Baars et al. 1977), the flux density of 3C84 at the time of the observation was determined to be Jy.
In AIPS the data were calibrated for all remaining instrumental and atmospheric effects. Starting from a point source model, the phase calibrator source was mapped, with a total of three rounds of phase self-calibration and the resulting corrections applied to the source data. The polarisation leakage for each antenna was determined using 3C84 and the polarisation position angle correction was performed using 3C286. The AIPS task IMAGR was used to map the whole data set in Stokes I, Q, U and V in order to retrieve the polarisation information. The rms noise, after CLEANing, was typically 14 mJy/beam and the FWHM of the restoring beam is 174 137 mas at a position angle of .
The positions of the maser components were determined by fitting two-dimensional Gaussian components to the brightest peaks in each channel map. Components were considered as spectral features if they occurred in three or more consecutive channels. Using flux weighted means over those channels of each group, the positions and velocities of spectrum features were obtained. The uncertainties in relative positions are typically 10 mas.
2.2 Water masers
The H2O maser line at 22GHz was observed using 4C39.25 as bandpass and flux calibrator. The flux density of 4C39.25 at this frequency was taken to be 7.8 Jy (Terasranta priv. comm.). The phase calibrator was mapped with a total of two rounds of phase self-calibration and the resulting corrections applied to the IRAS data. The spectral bandwidth was 4 MHz corresponding to 54 km s-1 velocity range with channel separation of 0.25 km s-1. Maps of all the spectral channels were generated and de-convolved using the AIPS task IMAGR. The restoring data beam had a FWHM of 40 8 mas at a position angle of . The rms noise was typically 11 mJy/beam but up to 40 mJy/beam in the spectral channels with the brightest emission.
2.3 CH3OH masers
The 6.7-GHz methanol line was observed with just the two antennas in the MERLIN array equipped with the appropriate receivers at the time of the observations. The correlator was configured to give a velocity resolution of 0.21 km s-1 for a total of 2 MHz spectrum bandwidth corresponding to 90 km s-1 velocity range. 3C84 was used as the bandpass and amplitude calibrator. Its amplitude at the time of the observations was estimated to be 16.51.6 Jy (Richards, private communication). The phase calibrator source was mapped with one round of phase self-calibration followed by an amplitude and phase self calibration. Again IMAGR was used to make the images and CLEAN them. The resulting FWHM of the beam is 26 24 mas at a position angle of .
2.4 Positional Uncertainties
The accuracy of the absolute masers position measured in the paper is limited by four factors : (1) the position accuracy of the phase calibrator, (2) the accuracy of the telescope positions, (3) the relative position error depending on the beamsize and signal-to-noise ratio and (4) finally the atmospheric variability that plays an important role especially at 22 GHz depending on the angular separation between the calibrator (2005+403) and the target. The first two factors are frequency independent and were estimated to be 5 mas (given by the MERLIN calibrator catalogue) and 10 mas respectively (Diamond et al. 2003). The other two factors are frequency dependent. The relative position error, given approximately by the beamsize/signal-to-noise ratio, leads to uncertainties in the position of 17, 4 and 2.5 mas at OH, H2O and CH3OH maser lines respectively. Factor (4) is inferred from the quality of the phase of the calibrator. With a separation of between the phase calibrator and the target this factor adds an uncertainties in the absolute position of 5 to 20 mas at the 1665-MHz OH maser line for the typical and worst phase rate respectively. For the H2O and 6.7-GHz CH3OH maser lines, it adds errors of 10 and 2 mas respectively, taking into account the worst phase rate for each observation. All these uncertainties combine quadratically to give absolute position errors of 25, 15 and 12 mas in the 1665-MHz OH, 22-GHz H2O and 6.7-GHz CH3OH component positions respectively.
| Type of | (J2000) | (J2000) | Velocity |
| maser | (km s-1) | ||
| OH (RHC) | -12.1 | ||
| H2O | -7.1 | ||
| CH3OH | -6.1 |

3 Results
The 1665-MHz OH line, water and 6.7-GHz methanol masers were detected with MERLIN. Table 2 gives the absolute positions and velocities of the brightest maser spot for each maser type. Radial velocities, here and elsewhere, are given relative to the Local Standard of Rest (LSR). All three types of maser are located close to the central source. The details of the emission in each maser type are discussed below. The 1667-MHz OH maser line was not detected down to a noise level of 20 mJy/beam.
| No. | Vel. | Flux | RA | Error | DEC | Error | Notes |
|---|---|---|---|---|---|---|---|
| km s-1 | Jy/b | s | s | ′′ | ′′ | ||
| R comp. | |||||||
| 1 | 2.17 | 1.510.02 | 26.0401 | 0.0001 | 32.183 | 0.002 | Z |
| 2 | 2.19 | 0.170.02 | 26.0554 | 0.0015 | 32.363 | 0.032 | |
| 3 | -12.10 | 2.700.03 | 26.0614 | 0.0011 | 32.645 | 0.012 | |
| 4 | -12.16 | 0.340.03 | 26.0772 | 0.0005 | 32.819 | 0.006 | |
| 5 | -12.80 | 0.320.02 | 26.0572 | 0.0007 | 32.634 | 0.008 | |
| 6 | -13.54 | 0.430.02 | 26.0562 | 0.0002 | 32.646 | 0.003 | |
| 7 | -14.21 | 0.320.02 | 26.0566 | 0.0003 | 32.645 | 0.004 | |
| L comp. | |||||||
| 1 | -3.75 | 0.960.02 | 26.0399 | 0.0001 | 31.964 | 0.001 | |
| 2 | -4.16 | 0.620.02 | 26.0400 | 0.0006 | 32.182 | 0.010 | Z |
| No. | Vel. | I | Q | U | V | P | mL | mC | mT | |
|---|---|---|---|---|---|---|---|---|---|---|
| km s-1 | Jy/b | Jy/b | Jy/b | Jy/b | Jy/b | ∘ | % | % | % | |
| 1 | 2.17 | 0.95 | 0.00 | 0.00 | 0.75 | 0.00 | 0.00 | 0.0 | 78.8 | 78.8 |
| 2 | 2.19 | 0.11 | 0.00 | 0.00 | 0.06 | 0.00 | 0.00 | 0.0 | 55.8 | 55.8 |
| 3 | -3.75 | 0.56 | 0.20 | -0.03 | -0.38 | 0.20 | -5.07 | 36.4 | -68.1 | 77.2 |
| 4 | -4.16 | 0.36 | 0.00 | 0.00 | -0.24 | 0.00 | 0.00 | 0.0 | -65.8 | 65.8 |
| 5 | -12.10 | 1.89 | 0.07 | -0.03 | 1.34 | 0.08 | -11.11 | 4.1 | 70.8 | 70.9 |
| 6 | -12.16 | 0.21 | 0.02 | 0.00 | 0.17 | 0.02 | 0.00 | 11.5 | 78.4 | 79.3 |
| 7 | -12.80 | 0.14 | 0.02 | 0.00 | 0.16 | 0.00 | 0.00 | 0.0 | 100.0 | 100.0 |
| 8 | -13.54 | 0.24 | 0.02 | 0.00 | 0.21 | 0.00 | 0.00 | 0.0 | 86.6 | 86.6 |
| 9 | -14.21 | 0.16 | 0.00 | 0.00 | 0.14 | 0.00 | 0.00 | 0.0 | 85.7 | 85.7 |
3.1 Hydroxyl masers
A total of 9 (7 RHC and 2 LHC) 1665-MHz OH maser spots were detected towards IRAS . Table 3 presents the parameters of the OH maser components detected, namely the peak intensities, velocities and positions for each hand of circular polarisation. The label Z marks a left-hand and right-hand polarised pair of components which originate at the same location and are identified as a Zeeman pair with a splitting of 6.3 km s-1. Figure 1 shows the distribution of the OH maser spots. They are distributed in two clusters on opposite sides of the axis inferred for the radio continuum jet (C99, Hofner et al. 1999) and about south-east from the 3.6cm continuum centre. The OH maser spots are spread over a region of corresponding to 2000 AU (or 0.01 pc) at a distance 1.7 kpc. The distribution of OH masers is approximately symmetrical about a line of NE-SW direction at position angle 29∘. Figure 1 also shows the spatial distribution of the velocities of the maser components. For the OH masers the velocities are mainly negative to the north and positive to the south.
Table 4 present the Stokes parameters I, Q, U and V, the polarisation position angle () (angles are measured from N towards E), the linearly polarised flux P, the percentage of linear polarisation , the percentage of circular polarisation and the total percentage of polarisation of each feature. The OH masers have a total polarisation around 80% ranging from 55% to 100%. The Stokes intensities are shown as zero in this table if their flux is below the noise level. All 1665-MHz features are circularly polarised and three features (3, 5 and 6) are elliptically polarised. Feature 3 is the most elliptically polarised (36.4%) and feature 7 is 100 % circularly polarised. Polarisation position angles can only be measured for features 3 and 5.
3.2 Water masers

| NO. | VLSR | Flux | ||
|---|---|---|---|---|
| km s-1 | Jy/beam | sec | ′′ | |
| 1 | 3.51 | 7.790.01 | 26.0243 | 32.575 |
| 2 | 2.05 | 4.250.01 | 26.0241 | 32.576 |
| 3 | -2.27 | 8.400.01 | 26.0269 | 32.588 |
| 4 | -2.36 | 0.560.01 | 26.0221 | 32.607 |
| 5 | -5.22 | 4.930.01 | 26.0217 | 32.612 |
| 6 | -7.07 | 78.810.04 | 26.0219 | 32.602 |
| 7 | -9.14 | 8.530.01 | 26.0220 | 32.602 |
| 8 | -13.39 | 1.200.01 | 26.0243 | 32.667 |

The water masers towards IRAS were detected in a single cluster of (255 AU at 1.7 kpc) in size close to the central source and the OH (and methanol, § 3.3) masers. This cluster is close to the C2 group of spots identified by Tofani et al. (1995). However the positions and fluxes have varied strongly, the brightest emission being 20 times greater than seen by Tofani et al. Also, neither of the clusters C1 and C3 identified by Tofani et al. was detected with MERLIN, implying that they have decreased in brightness by factors of more than 10 and 100 respectively.
Figure 2 shows that the spectrum of the water masers detected with MERLIN is also considerably different from that observed by MCR. The strongest component detected by MCR centred at km s-1 is not detected with MERLIN nor are the highest velocity components centred between -30 km s-1 and 20 km s-1. On the other hand, MERLIN detected components between 0 km s-1 and +5 km s-1 which were previously not detected with the VLBA. At the same time, the component centred in the velocity range -5.0 km s-1 and 0 km s-1 has increased in strength and the component centred at km s-1 dominates both spectra, although as Figure 3 shows, the location of the emission at this velocity is significantly different between the two observations.
3.3 Methanol Masers
| NO. | VLSR | Flux | error | error | ||
|---|---|---|---|---|---|---|
| km s-1 | Jy/b | sec | sec | ′′ | ′′ | |
| 1 | -5.51 | 1.820.01 | 26.0563 | 0.0002 | 32.680 | 0.002 |
| 2 | -6.12 | 20.310.03 | 26.0516 | 0.0002 | 32.705 | 0.002 |
| 3 | -6.19 | 4.470.03 | 26.0505 | 0.0002 | 32.760 | 0.002 |
| 4 | -6.53 | 4.500.02 | 26.0517 | 0.0002 | 32.652 | 0.002 |
| 5 | -6.48 | 3.800.02 | 26.0564 | 0.0002 | 32.746 | 0.002 |
| 6 | -6.54 | 10.430.02 | 26.0570 | 0.0002 | 32.694 | 0.002 |
| 7 | -6.49 | 2.150.02 | 26.0579 | 0.0002 | 32.639 | 0.002 |
| 8 | -7.04 | 1.290.01 | 26.0666 | 0.0002 | 32.669 | 0.002 |
| 9 | -7.17 | 10.110.01 | 26.0721 | 0.0002 | 32.711 | 0.002 |
| 10 | -7.19 | 1.730.01 | 26.0706 | 0.0002 | 32.765 | 0.002 |
| 11 | -7.09 | 0.510.01 | 26.0748 | 0.0002 | 32.609 | 0.003 |
| 12 | -7.72 | 4.240.03 | 26.0677 | 0.0002 | 32.794 | 0.002 |
| 13 | -7.75 | 3.020.03 | 26.0635 | 0.0002 | 32.700 | 0.002 |
| 14 | -7.71 | 1.250.03 | 26.0586 | 0.0002 | 32.613 | 0.003 |
| 15 | -7.71 | 0.830.03 | 26.0534 | 0.0003 | 32.533 | 0.003 |
| 16 | -7.81 | 1.040.03 | 26.0696 | 0.0002 | 32.685 | 0.003 |
| 17 | -8.40 | 2.110.01 | 26.0760 | 0.0002 | 32.711 | 0.002 |

Ten methanol maser features were detected, all very close to the northern group of OH masers. Table 6 presents the parameters of the components and Figure 4 shows the methanol masers spectrum compared with that detected by Minier et al. (2001). The methanol spectra has changed significantly since the observations of Minier et al. (2001), as has also been shown recently by Galt (2004). Also the MERLIN observations show the maser emission originates much closer to the central source than the EVN map of Minier et al.(2001).
4 Discussion
The exact location of the central driving source in IRAS is uncertain. It is unclear whether the double radio continuum source detected by Hofner et al. (1999) represents the outflow on either side of the source, or whether the brighter, south eastern component is coincident with the driving source as suggested by a model for the H2O maser emission developed by MCR. The observations of the dust continuum emission do not provide any definitive support for either interpretation as the absolute positional uncertainty of the 1.3mm and 3mm observations, , is too large to distinguish between these two possibilities. However, it is clear from our MERLIN observations that all three types of maser originate in the inner circumstellar region, within (850 AU) of the central source.
4.1 The Disk
As discussed above, the OH masers are confined in two clumps, while the CH3OH masers are closely associated with the northern of these clumps. The axis of the elongated distribution of maser spots is perpendicular to the axis of the jet from the central source (C99). The same orientation has been inferred for a circumstellar disk around the central source from observations of CH3CN, H13CO+ (C97, C99) and NH3 (Zhang et al. 1998). These molecular line observations all identify a velocity gradient along the proposed disk, and the CH3OH and OH maser velocities appear generally consistent with these velocity gradients. The northern OH masers, all right-hand circularly polarised, and have velocities ranging from -14 km s-1 to -12 km s-1, while the southern right-hand polarised components have velocities of 2.1 km s-1. The remaining two maser spots, both associated with the southern clump, have velocities of km s-1, although it should be noted that one of these spots is clearly a component of a Zeeman pair with one of the right-hand spots.
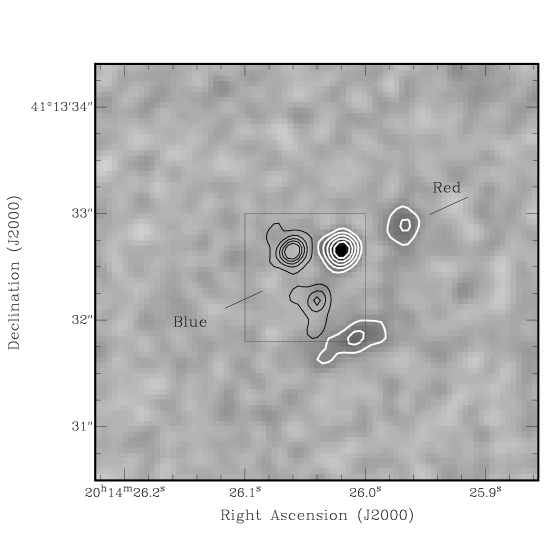
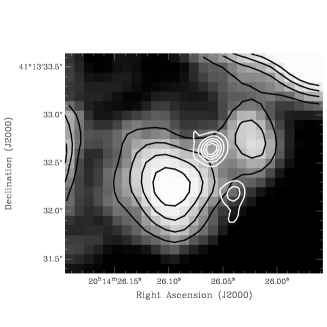
The suggestion that the OH masers arise from material in a circumstellar disk around the source is also supported by comparing the OH masers with a recent high resolution infrared image of this source. Figure 5 shows the integrated OH emission overlaid on a 2.2m K band image of the central region of the source (Sridharan et al 2004). The image shows a small bipolar K nebula with the emission lobes separated by a dark extinction lane. This structure is identical to the kinds of bipolar infrared nebulae seen around young low mass stars where the K emission is due to scattering off the walls of the cavity cleared by the outflow from the central star and the extinction is tracing the location of a circumstellar disk around the source. Clearly the OH masers are associated with the material responsible for the extinction, the material presumably in a circumstellar disk.
A position velocity diagram along the disk axis is shown in Figure 6. As indicated on the diagram, most of the OH and CH3OH maser velocities are all consistent with a Keplerian velocity gradient about a central source of mass 5 or 10 M⊙, but some of them suggest a mass of 20 M⊙. The first value is similar to the 7 M⊙derived by Cesaroni et al. (Cesaroni priv. comm.), while the last value is similar to the 24 M⊙ derived by Cesaroni et al. (1999) and the 20 M⊙ derived by Zhang et al. (1998). It therefore appears that the observations suggest that these masers are arising on or, in the surface of a circumstellar disk around this massive young star.

The presence of a OH Zeeman pair provides a measurement of the magnetic field in this disk. The 6.3km s-1 splitting of this pair implies a magnetic field strength of 10.7 mG (Elitzur 1996), pointing away from the observer. This is relatively high for typical magnetic field strengths towards OH masers in star forming regions (e.g. Garcia-Barreto et al. 1988; Hutawarakorn, & Cohen 2003 and references therein).
The spatial association of the OH and 6.7-GHz methanol masers confirms the close association of the OH and class II methanol masers proposed by Caswell (1996) and modelled by Cragg et al. (2002). The flux ratio of these masers, S(6668)/S(1665)= 20.3/2.7 = 7.5, places IRAS in OH-favoured sources. Note that although the OH and CH3OH masers are closely associated, there is a clear difference in position, amounting to 0.1 arcsec (170 AU), suggesting that the OH and CH3OH masers are not co-propagating.
Nevertheless the models of Cragg et al. (2002) can be used to place some constraints on the physical conditions in the regions where the masers are observed. The presence of 1665 MHz maser emission from OH, but the absence of 1667 MHz maser emission suggests that the material has a relatively high gas temperatures, K and relatively high H2 gas densities, cm-3, unless the dust temperature is K, which at the location of the OH masers is possible, but unlikely. This also agrees with the Gray et el (1991) model which predicted the absence of 1667 masers at high densities. To obtain maser emission in both OH and methanol, the Cragg et al. model requires a ratio of methanol to OH column densities in the range 0.1 to 1000, reducing to a range from 1 to 100 if the lines are both saturated, with a ratio of 10 being typical. Since maser emission from methanol requires methanol abundances of greater than , this suggests an OH abundance of . For a methanol favoured source such as , the models suggest the gas has a density in the range cm-3 to cm-3 and a gas temperature K with dust at a temperature between 130 K and 230 K, a range of parameters consistent with the absence of 1667 MHz OH masers. The gas temperature is also consistent with the 150-260 K inferred by C97 from observations of CH3CN.
The high abundance of methanol suggested by the presence of the methanol masers could result from the liberation of methanol from grains mantles as the dust is heated or shocked. This would also increase the OH abundance as a result of injection of H2O followed by protonation and dissociative recombination. The ‘hot core’ chemistry which results when grain mantles are evaporated has recently be modelled by Nomura, & Millar (2004). This model also shows that the gas phase abundance of CH3CN is also significantly enhanced when grain mantles are evaporated, a result also consistent with the observations IRAS 20126+4104 (C97; C99).
4.2 The Jet/outflow
The water masers arise from a region spatially distinct from the OH and CH3OH masers. As suggested by MCR, the location of the H2O emission appears to associate these masers with the outflow from the source. Figure 3 plots the location (and velocities) of our water maser observations compared with those detected by MCR. This figure shows that the spatial and velocity distribution of the maser spots has changed significantly between the two sets of observations. Indeed, it is difficult to identify any common maser spots.
MCR proposed a detailed model for the water masers distribution assuming that the masers lie on the surface of a conical bipolar jet, at the interaction zone between the ionised jet and the surrounding neutral medium, and moving with constant velocity away from the vertex of the cone (assumed to coincide with the embedded YSO). This model provides a prediction of the maser velocities at any given position, and so we can compare the measured velocities of the maser spots detected with MERLIN with the model predictions. Doing this, we find that the model predicts some velocities close to those observed by a value of 1.17 km s-1, but some predicted model velocities are higher or lower than observed ones by value of 7 to 10 km s-1. For example, for the maser spot at and , the model predicts a velocity of -4.13 km s-1 whereas the measured velocity is km s-1. Note that before making this comparison, the systematic velocity of km s-1 , used by MCR, was added to the velocity obtained from Eq.(1) of the MCR model.
If we assume that the H2O masers trace a moving shock front then they have travelled a distance of over the 1587 days between our MERLIN observations and the VLBA observations of MCR. This corresponds to a velocity of 190 km s-1. This velocity is consistent with the range of velocities inferred for the SiO by C99. It may also they are a new masers excited by the travelled shock. If we consider the uncertainty of the absolute position between for our spots, 10 mas, and MCR ones, 30 mas, some of the similar velocities spots of the two observations could be overlaped.
IRAS 20126+4104 has two different outflow directions: a NW-SE flow on an angular scale of 10′′, seen in HCO+ and H2 emission (C97) with an SiO jet (C99), and a large-scale CO outflow on a 2′ angular scale, that is almost N-S, at position angle 171 degrees (Shepherd et al. 2000). Shepherd et al. attribute the difference in position angles to precession of the jet. Our MERLIN measurements of the magnetic field direction show position angles of -5 and -11 that agree with the position angle of the large-scale CO outflow. (We assume that we are seeing -components.) The MERLIN measurements also agree in position angle with the magnetic field determination by Vallée, & Bastien (2000), who found a position angle of +4 based on 760-m continuum measurements at 14′′ resolution.
4.3 Comparison with Other Sources
The observations presented here show that IRAS 20126+4104 joins a small group of luminous (L⊙) young sources where the OH masers originate from within AU of the central star and often have a spatial (and in some cases kinematic) morphology consistent the masers being located in, or on the surface of, a circumstellar disk around the source. The other such objects are G35.2-0.74N (Hutawarakorn, & Cohen 1999), W75N (Hutawarakorn et al. 2002) and IRS1, 9 and 11 in NGC7538 (Hutawarakorn, & Cohen 2003). The OH masers towards W3(OH) have also recently been interpreted as originating from a circumstellar disk (Wright, Gray, & Diamond 2004). Although the OH masers towards are among the weaker in this group, the 11mG magnetic field strength measured is the highest among the sample, and is also higher than any of the 100 field values for OH masers studied by Fish et al. (2002).
Caswell (1996, 1998) has suggested that OH 1665 MHz maser flux compared to CH3OH flux may be an indicator of the evolutionary stage of a source, increasing as a source evolves. This would suggest that IRAS is amongst the younger of these sources, which could be consistent with the presence of 1667 MHz maser emission towards the sources with stronger 1665 MHz emission suggesting the OH emission arises from lower density material than towards IRAS (Cragg et al.2002).
5 Conclusions
We have used MERLIN to study the immediate vicinity of IRAS at high angular resolution and have shown that the 1665 MHz OH, H2O and CH3OH masers towards this source all originate within (850 AU) of the central source. The OH masers have an elongated distribution, tracing part of a disk of material around the source which is orthogonal to the axis of the jet from the soure. We could identify one Zeeman pair of OH masers which indicates a magnetic field of strength 11 mG in this disk. The velocity structure of the OH masers is consistent with Keplerian motion around a central source of 10 M⊙. The methanol masers are intermingled with the north-western part of the OH maser distribution and are at velocities intermediate between the north-western OH masers and those to the south-east. Our observations confirm the close association of OH and methanol masers. We suggest that the high methanol (and OH) column densities necessary for the maser emission may result from the release of mantles from the dust grains in the surface layers of the circumstellar disk as the disk material has been heated by the central young star or as the stellar wind has shocked the disk material.
The H2O masers have significantly varied since they were last observed at high angular resolution. We detect only one of the three clusters previously seen. Although the H2O masers detected are close to the location central source, as was seen in the previous observation, the maser spots have a considerably different spatial and kinematic structure to those previously measured. In particular the detailed model proposed by MCR for the H2O masers arising at the survey an outflow cavity fails to acount for the velocities and locations of the current spots.
These observations show that, at least for this source, the three common types of maser associated with young high mass stars probe different components of the circumstellar environment allowing a coherent view of the circumstellar regions to be constructed. The OH masers provide a measurement of the magnetic field in the circumstellar disk within AU of a young high mass star.
ACKNOWLEDGMENTS
We thank Peter Hofner for providing us with the 3.6cm map, and Riccardo Cesaroni, Malcolm Gray and Anita Richards for useful communication. MERLIN is a national facility operated by the University of Manchester at Jodrell Bank Observatory on behalf of PPARC.
References
- Baars et al. (1977) Baars, J. W. M., Genzel, R., Pauliny-Toth, I. I. K., Witzel, A. 1977, A&A, 61, 99B
- Beuther et al. (2002) Beuther, H., Walsh, A., Schilke, P., Sridharan, T. K., Menten, K. M., Wyrowski, F. 2002, A&A, 390, 289
- Caswell (1996) Caswell, J. L. 1996, MNRAS, 279, 79
- Caswell (1997) Caswell, J. L. 1997, MNRAS, 289, 203
- Caswell (1998) Caswell, J. L. 1998, MNRAS, 297, 215
- Cesaroni et al. (1997) Cesaroni, R., Felli, M., Testi, L., Walmsley, C. M., Olmi, L. 1997, A&A, 325, 725 (C97)
- Cesaroni et al. (1999) Cesaroni, R., Felli, M., Jenness, T., et al. 1999, A&A, 345, 949 (C99)
- Cohen et al. (1988) Cohen, R. J., Baart, E. E., Jonas, J. L. 1988, MNRAS, 231, 205
- Cragg et al. (2002) Cragg, D. M., Sobolev, A. M., Godfrey, P. D. 2002, MNRAS, 331, 521
- Diamond et al. (2003) Diamond, P. J., Garrington, S. T., Gunn, A. G., et al. 2003, MERLIN User Guide, ver. 3
- Elitzur (1996) Elitzur, M. 1996, ApJ, 457, 415
- Fish et al (2002) Fish, V.L., Reid, M.J., Argon, A.L., Menten, K.M. 2002, ApJ, 596, 328
- John Galt (2004) Galt, J 2004, AJ, 127, 3479
- Garcia-Barreto et al. (1988) Garcia-Barreto, J. A., Burke, B.F., Reid, M. J., et al. 1988, ApJ, 326, 954
- Gray et al (1991) Gray, M.D., Doel, R.C., Field, D. 1991, MNRAS, 252, 30
- Gray et al (2003) Gray, M. D., Hutawarakorn, B., Cohen, R. J. 2003, MNRAS, 343, 1067
- Hofner et al. (1999) Hofner, P., Cesaroni, R., Rodriguez, L. F., & Marti J. 1999, AA, 345, 43
- Hofner et al. (2004) Hofner, P., et al. 2004, in prep.
- Hutawarakorn, & Cohen (1999) Hutawarakorn, B., Cohen, R. J. 1999, MNRAS, 303, 845
- Hutawarakorn et al. (2002) Hutawarakorn, B., Cohen, R. J., Brebner, G. C. 2002, MNRAS, 330, 349
- Hutawarakorn et al. (2003) Hutawarakorn, B., Cohen, R. J. 2003, MNRAS, 345, 175
- Minier et al. (2001) Minier, V., Conway, J. E., Booth, R. S. 2001, A&A, 369, 278
- Moscadelli et al. (2000) Moscadelli, L., Cesaroni, R., Rioja, M. J. 2000, A&A, 360, 663(MCR)
- Nomura, & Millar (2004) Nomura, H., Millar, T.J. 2004, A&A, 414, 409
- Shepherd et al. (2000) Shepherd, D. S., Yu, K. C., Bally, J., Testi, L. 2000, ApJ, 535, 833
- Sridharan et al. (2004) Sridharan, T.K., Williams, S.J., Fuller, G.A. 2004, in prep.
- Szymczak, & Gerard (2004) Szymczak, M., & Gerard, E. 2004, A&A, 414, 235
- Tofani et al., (1995) Tofani, G., Felli, M., Taylor, G. B., Hunter, T. R. 1995, A&AS 112, 299
- Vallée, & Bastien (2000) Vallée J.P., & Bastien P. 2000, ApJ, 530, 806.
- Wilking et al. (1989) Wilking, B. A., Mundy, L. G., Blackwell, J. H., Howe, J. E. 1989, ApJ, 345, 257
- Wright, Gray, & Diamond (2004) Wright, M. M., Gray, M. D., & Diamond, P. J. 2004, MNRAS, 350, 1253
- Zhang et al. (1998) Zhang, Q., Hunter, T. R., Sridharan, T. K. 1998, ApJ, 505, L151