The deeply obscured AGN of NGC 4945††thanks: We dedicate this paper to the memory of our esteemed colleague and advisor, Alan Moorwood (1945-2011), who pioneered the infrared spectroscopic study of NGC 4945. This work is based on observations obtained with the Spitzer Space Telescope, which is operated by the Jet Propulsion Laboratory, California Institute of Technology, under NASA contract 1407.
Abstract
Context. The nearly edge-on galaxy NGC 4945 is one of the closest galaxies where an AGN and starburst coexist, and is one of the brightest sources at . Near and mid-infrared spectroscopy have shown very strong obscuration of its central region, rivaled only in strength by some of the most deeply obscured ULIRGs.
Aims. Determine the spatial distribution of ISM emission features in the central 426426 of NGC 4945.
Methods. We map the central region of NGC 4945 in three of the four Spitzer-IRS modules (SH, SL and LL). In particular, we produce maps of the flux distribution of the starburst tracers [Ne II], [Ne III], [S III] and [S IV] at 12.81, 15.56, 18.71 and 10.51 , respectively, and a map of the AGN narrow-line region tracer [Ne V] at 14.32 . In addition, we mapped the S(1), S(2) and S(3) pure rotational lines of H2, which trace the distribution of warm molecular hydrogen. Finally, we obtained an extinction map () based on the apparent strength of the 9.7 silicate absorption feature.
Results. At a spatial resolution of 5′′ our extinction map traces the contours of the starburst ring. The highest extinction is, however, found at the nucleus, where we measure 60. Within the uncertainty of the astrometry all emission lines are found to peak on the nucleus, except for the warm molecular hydrogen emission which shows a maximum 60-100 pc NW of the nucleus. We favour a scenario in which the lower H2 0-0 S(1) and S(2) rotational lines originate mainly from an unobscured extra-nuclear component associated with the super-wind cone observed in the HST NICMOS map of the H2 1-0 S(1) vibrational line. For the [Ne V] emission we infer an attenuation of a factor 12-160 (=55-112) based on a comparison of the ratio of our [Ne V] flux and the absorption-corrected 14–195 keV Swift-BAT flux to the average [Ne V]/BAT ratio for Seyfert 1 nuclei. The high attenuation indicates that [Ne V] and [O IV] cannot be used as extinction-free tracers of AGN power in galaxies with deeply buried nuclei.
Key Words.:
Galaxies: active – Galaxies: nuclei – Galaxies: individual: NGC 4945 – ISM: lines and bands1 Introduction
At a distance of 3.82 Mpc (18.5 pc/arcsec, Karachentsev et al. 2007) the active galaxy NGC 4945 is one of the closest galaxies that host both, an AGN and starburst. Earlier X-ray observations showed evidence for a hidden AGN (Iwasawa et al., 1993; Guainazzi et al., 2000). These observations revealed a Compton-thick spectrum with an absorbing column density of (Guainazzi et al., 2000). The nucleus of NGC 4945 is one of the brightest extragalactic sources at (Done et al., 1996), and the brightest Seyfert 2 AGN at (Itoh et al., 2008).
Rather than a point source marking the presence of the AGN in optical and near-infrared images, the nearly edge-on () line of sight to the central region reveals evidence for strong and patchy extinction, which is especially apparent in HST-NICMOS maps (Marconi et al., 2000). A dust lane aligned along the major axis of the galactic disk obscures parts of the central region just southeast of the -band peak. The -band peak itself lies west (but, within the uncertainty) of the position of the H2O mega maser (Greenhill et al., 1997), which we adopt as the location of the AGN. The mega maser emission allows to estimate the mass of the central black hole, , which together with its inferred 0.1–200 keV bolometric luminosity of (, Guainazzi et al. (2000)) indicates that the central engine radiates at 10% of its Edington luminosity (Greenhill et al., 1997; Madejski et al., 2000).
Estimates from IRAS observations indicate that about 75% of the total infrared luminosity of the galaxy (L) is generated within an elongated region of (about ) centered on the nucleus (Brock et al., 1988). The structure of this region, as shown in high resolution HST-NICMOS observations of the Pa line, is consistent with a nearly edge-on starburst disk with a () radius (Marconi et al., 2000), embedded in a (150 pc) inclined (62 degrees) molecular disk (Chou et al., 2007).
Although the star formation and supernova rates in the nuclear region were originally estimated to be moderate ( and , respectively; Moorwood & Oliva 1994), more recent estimates based on high resolution (angular scale of ) radio observations and estimates of supernova remnant source counts, sizes and expansion rates, lead to a type II supernova rate of , and star formation rate (SFR) limits of , where is the shell radial expansion velocity in (Lenc & Tingay, 2009). These supernova and star formation rates are, within a factor of two, similar to those estimated in NGC 253 and M82 (Pedlar et al., 2003; Lenc & Tingay, 2006), which are also nearly edge-on starburst galaxies, have similar distances close to and all show similar infrared luminosities (Rice et al., 1988). The impact of the central starburst on the circumnuclear region is large, as revealed by the presence of a conical cavity evacuated by a supernova driven wind (Moorwood et al., 1996b; Marconi et al., 2000). The HST-NICMOS images of the H2 1-0 S(1) line at show that the edges of the cavity extend out to (93) north from the NGC 4945 nucleus (Marconi et al., 2000).
Near and mid-infrared spectroscopy indicate that the ISM line of sight to the central region of NGC 4945 is very different than that of other nearby starburst galaxies, such as M 82 and NGC 253, which present similar inclination angles. The strong absorption features of both volatile (CO and CO2) and refractory (H2O) ices observed in the 2.4–5 ISO-PHT-S spectrum indicate the presence of shielded cold molecular clouds obscuring the NGC 4945 nucleus (Spoon et al., 2000, 2003). The detection of a strong absorption feature of XCN ice at 4.62 by Spoon et al. (2000, 2003) indicates that these molecular clouds have been processed in an energetic environment (Lacy et al., 1984), and processed ice is suggested to be a common characteristic of dense molecular material in star forming galactic nuclei (Spoon et al., 2003). A highly distorted PAH emission spectrum produced by a very deep 9.7 silicate absorption feature is more evidence for the unusually strongly obscured nuclear region (Spoon et al., 2000; Brandl et al., 2006). This makes NGC 4945 a unique nearby laboratory to study an environment that can be found only in distant ULIRGs.
Previous mid-infrared spectroscopic observations could not confirm the presence of an AGN in NGC 4945. Just an upper limit of the 14.32 [Ne V] emission, considered a tracer of AGN narrow-line regions (e.g., Moorwood et al., 1996a; Genzel et al., 1998), was obtained from ISO-SWS observations (Spoon et al., 2000). The VLT-ISAAC observation of the 3.93 [Si IX] line, commonly observed in the soft X-ray photoionized gas of many Seyfert galaxies (Oliva et al., 1994; Lutz et al., 2002), resulted in a non-detection (Spoon et al., 2003). Only recent observations with the more sensitive IRS-SH spectrograph on Spitzer allowed the detection (although at a very faint level) of the 14.32 [Ne V] line towards the NGC 4945 nucleus (Bernard-Salas et al., 2009). The [Ne V]14.3/[Ne II]12.8 flux ratio found in NGC 4945 is , which indicates an AGN contribution of less than a few percent using the diagram by Farrah et al. (2007) (their Fig. 16). This detection of [Ne V] relative to [Ne II] is about 10 times weaker than what was observed in other Seyfert galaxies like Mrk 266 and NGC 1365 (Bernard-Salas et al., 2009).
In this paper we study the mid-IR properties of the nuclear region of NGC 4945. Spitzer-IRS spectral mapping observations of a (about 426426) region are presented. The mapping capabilities of Spitzer-IRS allow the study of a number of properties of the nuclear region in NGC 4945. For instance, the extent of the AGN coronal line region as traced by the [Ne V] line, the extent of the crystalline silicate absorbing region (and a search for the sources responsible for the presence of crystalline silicates), disentangling PAH emission and silicate absorption along the line of sight, and the excitation and age of the circumnuclear-nuclear starburst based on line ratios of forbidden lines. Although we actually used the Spitzer-IRS modules SH, SL and LL, in this work we present the most interesting results from the SH and SL spectral maps only, since we focus on the analysis of the spatial distribution of ISM emission and absorption features. We present for the first time the maps of the starburst tracers [Ne II] 12.81 , [Ne III] 15.56 , [S III] 18.71 , and [S IV] 10.51 , and a map of the AGN narrow-line region tracer [Ne V] at 14.32 , and analyze the ratios between some of these tracers as different diagnostics. The organization of this article is as follows. In Sect. 2 we describe the observations and the data reduction. The maps obtained are presented in Sect. 3. The analysis of the data is presented in Sect. 4. The conclusions and final remarks are presented in Sect. 5.
2 Observations and data reduction
We mapped the central region of NGC 4945 with the InfraRed Spectrograph111The IRS was a collaborative venture between Cornell University and Ball Aerospace Corporation funded by NASA through the Jet Propulsion Laboratory and the Ames Research Center. (IRS - Houck et al. 2004) on board of the Spitzer Space Telescope (Werner et al., 2004) through the guaranteed time observation (GTO) program P40018 (PI: H.W.W. Spoon). The spectral maps were done in moderate resolution (R600) with the Short-High (SH; 9.9 – 19.6 ) IRS222http://ssc.spitzer.caltech.edu/irs/highleveloverview module, and at low resolution (R60–120) using the Short-Low (SL1; 7.4 – 14.5 , SL2; 5.2 – 7.7 ) and Long-Low (LL1; 19.5 – 38.0 , LL2; 14.0 – 21.3 ) IRS modules.
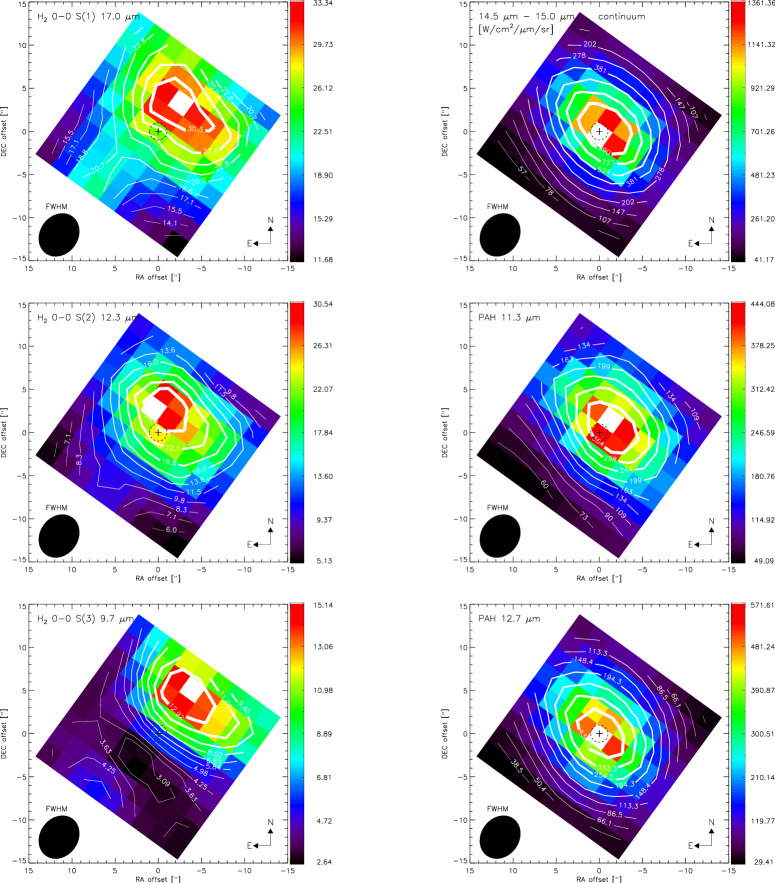
The SH module was used to measure mainly the fine-structure emission lines (starburst tracers) [S IV] at 10.51 , [Ne II] at 12.81 , [Ne III] at 15.56 , [S III] at 18.71 , the AGN narrow-line region tracer [Ne V] at 14.32 , and the molecular hydrogen (pure rotational) lines, H2 0-0 S(2) and H2 0-0 S(1) at 12.3 and 17.0 , respectively. With the SL module we obtained maps of the H2 S(3), and the silicate absorption feature at 9.7 .
2.1 SH map
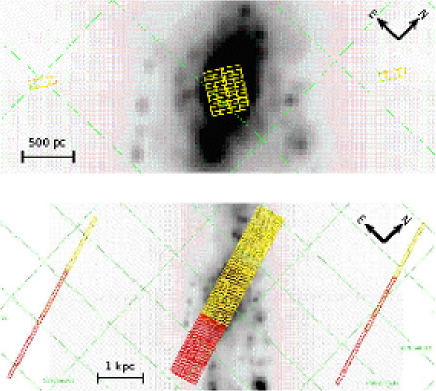
The IRS-SH map was obtained in July 2007 (at the beginning of the summer visibility window) when the SH slit was relatively aligned with the minor axis of NGC 4945. The area mapped was limited to a set of 3 parallel by 10 perpendicular pointings centered on the nucleus, and covering an area of . The top panel of Fig. 1 shows the orientation of the SH slit overlaid on the Spitzer-MIPS 24 map of the central region of NGC 4945 (by courtesy of Varoujian Gorjian, private communication).
The quality of the map was optimized by splitting up the mapping into 4 1-cycle maps of 120 sec, each of which was alternated with a staring mode off-source sky measurement to keep track of rogue pixels and to obtain an accurate measure of the sky background. The total time used for the SH map, including sky positions, was 6.5 hrs.
2.2 SL map
Due to a Spitzer anomaly333http://www.spitzer.caltech.edu/news/856-feature06-25-Engineers-Studying-Spitzer-Anomaly that began a few hours before the original schedule of the observations, the IRS-SL map of the nuclear region of NGC 4945 was delayed till August 2008, when the SL slit was no longer perfectly aligned with the galaxy major axis. The observations were done with 5 cycles of 14 sec ramps, which allowed to map a region of about in 2 parallel by 19 perpendicular pointings centered on the nucleus of NGC 4945.
In order to sample the background continuum and to identify rogue pixels, we also obtained off-source spectra with the same integration times and number of cycles at two positions sufficiently above and below the galaxy disk. The off-source spectra were taken before and after the SL mapping. The total time used for the SL map, including sky positions, amounts to 3.1 hrs. The orientation of the SL slit, overlaid on the Spitzer-MIPS 24 map of NGC 4945, is shown in the bottom panel of Fig. 1.
2.3 Data reduction
The Basic Calibrated Data (BCD) were pre-processed with the Spitzer pipeline versions S16.1 for SH, and S18.1 for SL. Rogue pixels were cleaned, and maps were built, using the IRS mapping reduction package CUBISM444http://ssc.spitzer.caltech.edu/dataanalysistools/tools/cubism/, designed by the SINGS555http://ssc.spitzer.caltech.edu/spitzermission/observingprograms/legacy/ legacy team (Smith et al., 2007). With this tool we performed the flux calibration, background subtraction, and estimated the statistical uncertainty at each spectral wavelength. We create the first spectral cubes from the slit observations combined with CUBISM. After creating the first cubes, we further cleaned the data using the back-tracking procedure described in Smith et al. (2007). All the pixels with flux uncertainty larger than 50% were flagged, so they were not used in subsequent reconstructions of the spectral cubes. We iterate on the cleaning procedure by performing visual inspections throughout the maps, of small sections of the spectra around the emission lines, PAH and silicate features of interest, and we reconstructed the cubes after cleaning new pixels.
The spectral cubes obtained with CUBISM are in units of surface brightness, , but we convert them to to work and present the spectra. We use the units of surface brightness to present the maps, and flux density for the integrated total fluxes. For this we use the conversion , knowing that the pixel size666See http://coolwiki.ipac.caltech.edu/index.php/Units for a description of Spitzer units and conversions of the IRS/SH map is 2.26, which leads to that we need to multiply by in order to get the maps in units of flux density. In the case of IRS/SL the pixel size is 1.85, so we have slightly smaller per pixel than in the SH map.
3 Analysis and results
During the data reduction and spectral analysis process we found that the SH spectral orders777http://ssc.spitzer.caltech.edu/irs/irsinstrumenthandbook/ are mismatched at levels that vary across the mapped region. This effect is smoothed (although not completely solved) by increasing the overlap between the orders (in the wavsamp calibration file) and by increasing the size of the aperture used to extract 1-D average spectra, as discussed below. We also observed module to module mismatches, which inhibit us from reliably combining the SH and SL modules to perform further analyses like, for instance, using the H2 S(3) line as an extinction indicator. These mismatches in the SH orders and between modules have not been addressed before888http://ssc.spitzer.caltech.edu/irs/features/, probably because they are apparent only in high S/N data as those presented in this work. The IRS-SH/SL orders/modules mismatch problem seen in high S/N data is a new issue that we are still studying together with members of the SINGS team. Fortunately, most of the emission and absorption features we are interested in are found within the spectral orders, and those features observed near the edge of the orders are treated with extreme care or not addressed at all.
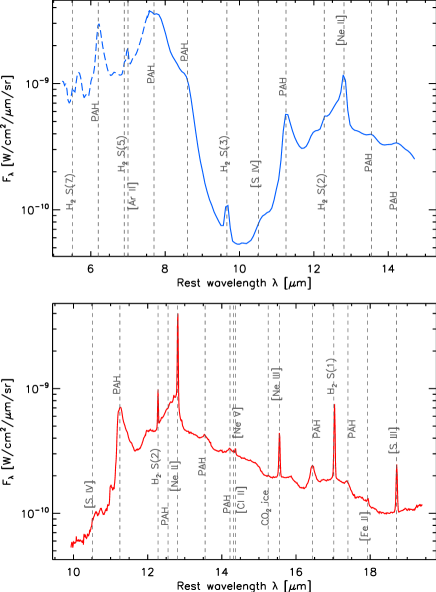
The average spectrum, considering the whole field of view (FOV) of the IRS/SH map, and the average spectrum of the IRS/SL map (extracted from a similar FOV as that of the SH map) are shown in the top and bottom panel of Fig. 2, respectively. The most important fine-structure emission lines and PAH features are indicated in both spectra.
We developed our own IDL procedures to work on the 1-D spectra that were used to build the final maps. These 1-D spectra were extracted from the clean SH cubes by averaging the spectra over a moving 22 pixel aperture. The whole field of view was covered with a step size of 1 pixel, so the reduced map contains only 1010 pixels of each (where corresponds to at the distance of ) but covering the same area as the original map. However, the last slit observation of the IRS/SH map covers just about one third of the spatial region associated with each pixel. Therefore, we conclude that the last column of the original 1111 grid map produced by CUBISM is not representative of the actual spatial region associated with that slit column, and we do not use it in our maps. So the final maps reduced with the 22 aperture results in 99 pixel maps, covering a slightly smaller region than the original maps. The coordinates assigned to each pixel of the resulting map are those of the center of the 22 aperture, and the pixel fluxes reported in Figures 5, 6, 10 and 11 are the average fluxes in the 22 apertures. Using the 22 pixel extraction box the S/N of the spectra is increased by a factor 2 (from the pixels), and reduces the effect of the mismatch between orders mentioned above. This corresponds to a standard procedure recommended to obtain IRS maps of extended sources.
The average Full Width Half maximum (FWHM) of the IRS/SH Point Spread Function (PSF) has been estimated to be and for the direction along the spectral dispersion axis and the spatial axis of the slit, respectively, while the corresponding average PSF FWHM values of the SL2 (mostly used in this work) are and , respectively (Pereira-Santaella et al., 2010, their appendix A). The - deviation around the average centroid position in SL modules was found to be times smaller than the SL pixel size (). While the maximum - deviation in the SH module was found to be , which is considered small compared to the SH pixel size ().
With the aim to determine whether our line emission maps are resolved, we retrieved a partial map of 33 SH slit pointings of the star P Cygni (AOR 13049088). The map consists of steps parallel to the slit and steps perpendicular to the slit, similar to the map spacing we have for NGC 4945. These pointings lead to a 103 pixel map. In order to test the continuum drop off along the (10 pixels) slit, 22 aperture spectra were extracted in the same way as we do for the SH maps of NGC 4945. Then the continuum flux at 15 was measured in each position, resulting in a mostly Gaussian variation of the flux along the slit. The FWHM ranges from 6 to 7 arcsec between 10 and 19 microns, far less than the ratio 19/10 expected over this range for the PSF of a diffraction limited telescope. The same procedure was applied to the 126 map of the star KsiDra used by Pereira-Santaella et al. (2010) (AORs 16294912 and 16340224). In this case, a FWHM in the range was found in both the parallel and the perpendicular (to the slit) directions.
From the SH 22 aperture average spectra we obtained maps of the starburst tracers [S IV] at 10.51 , [Ne II] at 12.81 , [Cl II] at 14.37 , [Ne III] at 15.56 , [S III] at 18.71 , as well as the AGN tracer [Ne V] at 14.32 , and the pure rotational molecular hydrogen lines, H2 S(2) and H2 S(1) at 12.3 and 17.0 , respectively. For each line we first estimate a continuum level by fitting a second-order polynomial to the base of the emission line, or a cubic spline with selected anchor points (pivots) when the emission line was on top of a complex PAH or silicate feature. We applied the same aperture reduction procedure for the SL map, from where we obtained a map of the silicate absorption feature at 9.7 and the corresponding silicate strength as described in Sec. 3.4. We also obtained a map of the the molecular hydrogen line H2 S(3) at 9.66 .
3.1 The spectral complex around [Ne V] 14.32
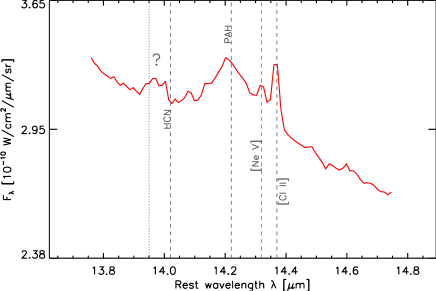
The complexity of the spectral range around the [Ne V] 14.32 is shown in Fig. 3. An unknown feature at 13.95 seems to be present just next to the first bending mode of HCN at . Depending on the temperature of the surrounding molecular gas, HCN can be vibrationally excited by absorbing the infrared photons at . This will produce a subsequent cascade process that can enhance HCN rotational lines in the (sub-)millimeter range. This corresponds to the IR-pumping scenario proposed to explain the bright HCN (and higher) transition observed in some ULIRGs and Galactic star-forming regions (e.g., Aalto et al., 1995; García-Burillo et al., 2006; Guélin et al., 2007; Aalto et al., 2007; Pérez-Beaupuits et al., 2010). Although, due to the order mismatch (mentioned in Sec. 3) observed between and , also seen by Pereira-Santaella et al. (2010), we are unable to conclude whether we detect or not the HCN feature, either in emission or in absorption.
A larger PAH feature is observed around 14.22 , and on its rightmost (and less steep) slope the fine-structure emission lines of [Ne V] 14.32 and [Cl II] 14.37 are found. Chlorine, which has an ionization potential of , is known to play an important role in characterizing the neutral gas components in the ISM. When H2 is abundant (optically thick in the FUV), it reacts (exothermically by ) with [Cl II] to form HCl+, which leads to the formation of [Cl I] and H I (Jura, 1974; Jura & York, 1978). This means, chlorine is predominantly ionized in H I regions while it is predominantly neutral when cold H2 components are present (Sonnentrucker et al., 2002, 2003). The [Cl II] 14.37 fine-structure emission line was clearly detected (3) in the whole region mapped with the IRS/SH module, and presents a similar (although more spreadout) distribution than that of the [Ne II] 12.81 line.
Because its ionization potential () is too large to allow production by main-sequence stars, the fine-structure line [Ne V] 14.32 is commonly used to probe the narrow line region of AGNs (e.g., Moorwood et al., 1996a; Genzel et al., 1998; Sturm et al., 2002; Armus et al., 2007; Alonso-Herrero et al., 2009; Baum et al., 2010; Willett et al., 2010, and references therein). It has recently been used as a diagnostic tool to unambiguously identify AGN in galaxies that have not been identified as such using optical spectroscopy (Goulding & Alexander, 2009).
3.2 Estimating the line emission flux
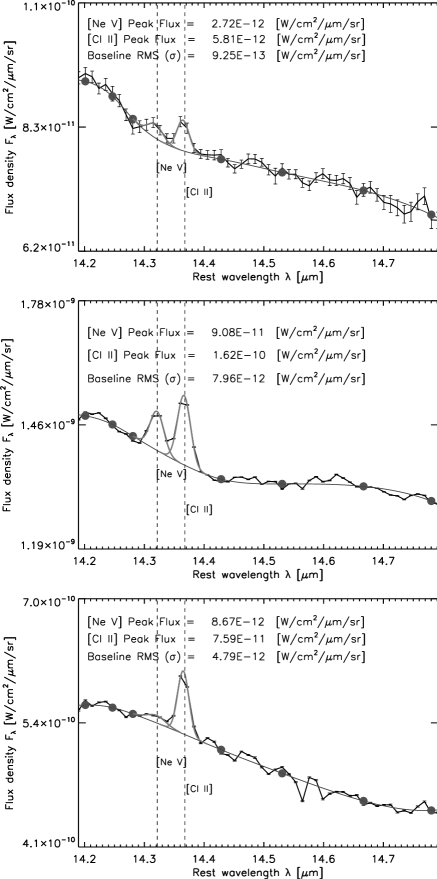
The emission fluxes were estimated by fitting a Gaussian profile to the fine-structure lines and integrating the flux above a local continuum, which was estimated from a cubic spline interpolation of selected anchor points (pivots). Since we we want to determine the actual spatial distribution of the emission lines in the nuclear region of NGC 4945, we set a strict 3 level detection for all the fine-structure emission lines, and at least two data points (or a full width of 560 at 14.32 ) in the profile to consider a feature as a real emission line in the spectrum. For a robust estimate of the local continuum we adopted an average flux of five points around each of the selected pivots used in the cubic spline interpolation. Figure 4 shows the Gaussian fit of the [Ne V] 14.32 and [Cl II] 14.37 fine-structure emission lines at three different positions of the IRS/SH map. The uncertainty of each spectral data point is indicated by the error bars. The pivots used for the cubic spline interpolation of the local continuum (baseline) are shown with filled circles. These pivots are at the wavelengths 14.201 , 14.247 , 14.281 , 14.428 , 14.531 , 14.667 , and 14.780 .
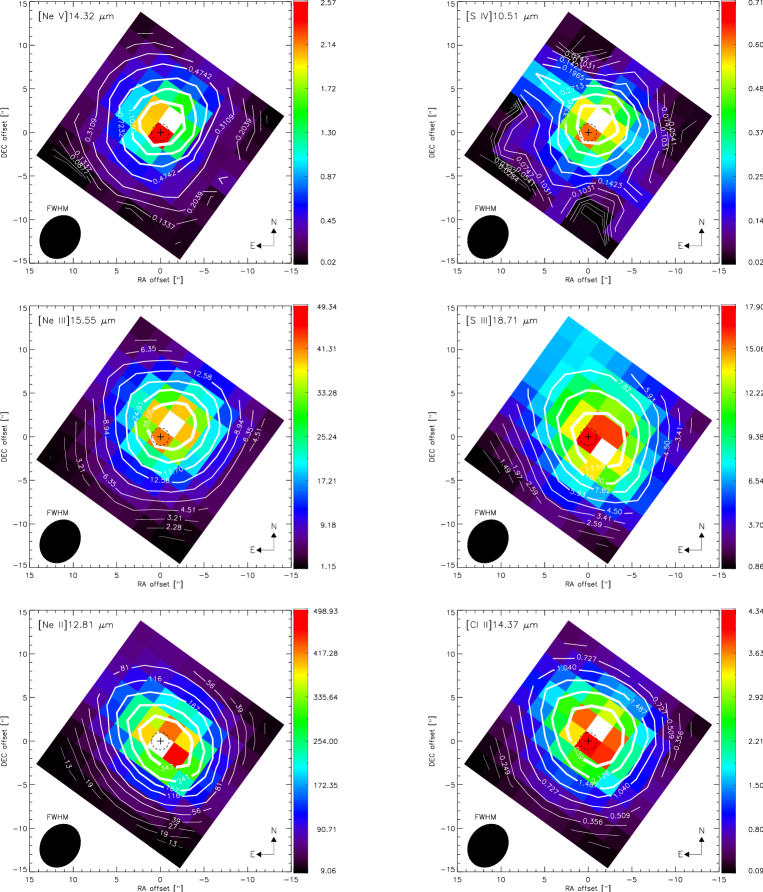
The top panel of Fig. 4 shows the spectrum in a region of the map with relatively high uncertainties (1.4% on average) in the spectral data and with high RMS (as computed from the baseline, and indicated in the legend of the plots) that leads to less than a 3 detection for [Ne V], but a clear detection (3) for the [Cl II] line. The spectrum of the middle panel was extracted from the central 22 pixel aperture of the map, which has a S/N ratio 9 in the line and 100 in the continuum, and is among the highest S/N in the whole IRS/SH map. This spectrum shows very low uncertainties (0.06% on average) in the data, and clear detections of both lines. Although with low uncertainties in the data (0.13%), the bottom panel of Fig. 4 shows less than a 3 detection for [Ne V] (with a S/N1.8), but a strong detection of [Cl II] 14.37 . With this Gaussian fit procedure, we produced 99 pixels maps (as described above) of several fine-structure lines, PAH features and the silicate absorption feature at (discussed in Sec. 3.4), covering a region of about (about 426426). The SH maps are shown in Figs. 5 and 6. In the case of the [Ne V] 14.32 the pixels with surface brightness lower than correspond to a detection level .
For the particular case of the [Ne V] line, a Gaussian fit of the uncorrected for extinction map indicates that this emission is only marginally resolved along the major axis, given its FWHM of . Along the minor axis the FWHM is . After extinction correction (discussed in Secs. 3.3 and 3.4), the [Ne V] emission appears unresolved. The other emission lines (uncorrected for extinction) are well resolved (FWHM).
3.3 Visual extinction
Lower limits on the reddening in the nuclear region of NGC 4945 were obtained from the HST-NICMOS color image (Marconi et al., 2000). An average color , yielding an , was observed in the region of the Pa ring. This is comparable with extinctions larger than , as estimated from the Br/Br and Pa/H ratios (Moorwood & Oliva, 1988; Marconi et al., 2000).
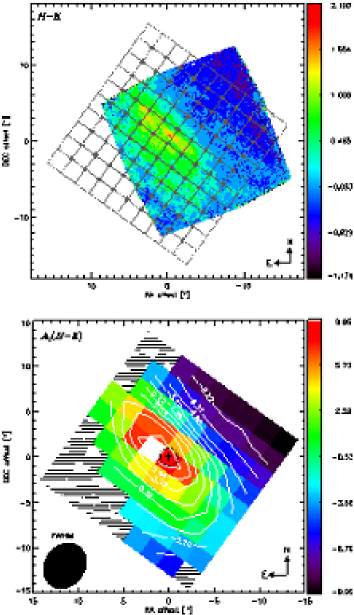
In order to compare with our data, we produced an image of at the same resolution of the IRS/SH maps, using the HST-NICMOS colour image. First, we use the same definition of foreground screen extinction given in Marconi et al. (2000)
| (1) |
where is the colour excess that can be obtained from the difference between the observed and intrinsic colours, . We use the average intrinsic colour of spiral and elliptical galaxies reported by Hunt et al. (1997). The and coefficients are derived from the extinction law, . But instead of using the law () assumed by Marconi et al. (2000), we used the extinction law for the local ISM reported by Chiar & Tielens (2006), which considers solid and porous spheres and a continuous distribution of ellipsoids in the extinction profiles used for the amorphous silicates in the absorption feature. We interpolated the coefficients at and of the HST-NICMOS and bands, respectively. In Chiar & Tielens (2006) the local ISM continuum extinction was found to be described by the expression
| (2) |
using to normalize the extinction to the band (Whittet, 2003). Beyond 8 the silicate profile of WR-98A is superimposed using (Roche & Aitken, 1984). So we used eq.(2) and to estimate the and coefficients for the stellar light-based extinction .
The top panel of Fig. 7 shows the HST-NICMOS image reported by Marconi et al. (2000) with the Spitzer-IRS SH grid overlaid. We took all the pixels of the image (which have higher resolution than our maps) that fall within a 22 pixel aperture of the SH grid map, and computed the average for that particular pixel. After doing this for every single pixel in the SH grid we obtain the foreground extinction (at the resolution of the SH map) shown in the bottom panel of Fig. 7. The SH pixels that cover less than 400 pixels in the image are shown in dashed lines. The peak of this stellar light-derived extinction lies about (one pixel) northeast of the H2O mega maser.
3.4 The deep silicate absorption around 9.7
From the IRS/SL cubes we can study the amorphous silicate grains, which present a broad and deep absorption feature around 9.7 . The presence of PAH emission along the same line of sight as the silicate absorption makes it hard to measure the apparent silicate depth. If one assumes the PAH emission to be foreground to the silicate absorption, then a different apparent silicate depth is found than when it is assumed that they are mixed. Silicate absorption can also be foreground to the PAH emission. Here we use the method proposed by Spoon et al. (2007, their Fig.2) for absorption-dominated spectra to infer the apparent strength of this silicate feature. First, we extracted 1-D spectra from the SL map rebinned to the 22 pixel aperture of the SH map described in Sec. 3. For each spectrum, we adopted a local mid-infrared continuum by interpolating the feature-free continuum pivots at 5.3 and 13.55 .
Because the S/N is not uniform for all the pixels of the SL map, and the features around 5.3 change depending on the proximity to the nucleus of NGC 4945, we used a similar procedure as the one used for [Ne V] 14.32 (Sec. 3.1). The flux assigned to the pivot at 5.3 was adopted as the minimum flux observed between 5.1 and 5.5 . In order to avoid contamination from the H2 S(3) 9.66 molecular line, the flux estimated for the deepest point adopted at 9.85 was the median flux between 9.7 and 10.0 . The flux estimated for the pivot at 13.55 was the median flux observed between 12.9 and 14.0 . Then we computed the ratio between the observed flux () and the estimated continuum flux () at 9.85 , and we obtained the silicate strength as
| (3) |
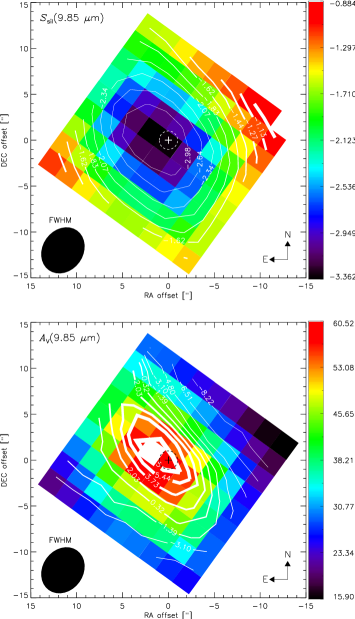
For sources with a silicate absorption feature, can be interpreted as the negative of the apparent silicate optical depth (). The top panel of Fig. 8 shows the IRS/SL map (rebinned to the 22 aperture of the IRS/SH map) of the apparent silicate strength at 9.85 . The silicate-based extinction , shown in the bottom panel of Fig. 8, was estimated from the average visual extinction to silicate optical depth ratio , which is appropriate for the local ISM (Roche & Aitken, 1984; Rieke & Lebofsky, 1985). The spatial distribution of the silicate-based extinction is similar to that of the stellar light-based extinction estimated in Sec.3.3. The peak extinction is found at the same relative position (, ), at about (one pixel) northeast of the H2O mega maser (Greenhill et al., 1997).
It is known that extinction estimated from optical or near-infrared observations generally underestimates the actual extinction if the environment probed is optically thick at the emission lines observed. If most of the emitting region is obscured, as in the case of the nucleus of NGC 4945, the visual extinction estimate is representative of the surface of the obscured region and not the region itself. This effect is reflected in the different extinctions derived from the optical image and the silicate-based estimate derived from our mid-IR observations, where the peak extinction is about 7 times stronger than that of the stellar light-based estimate. Our is also a factor 1.7 higher than the extinction () previously inferred from ISO observations of the [S III] 18.7/33.5 line ratio (Spoon et al., 2000). This difference can be explained by the peaked nature of the silicate-based extinction map and because of the larger apertures () of the ISO observations, which averages out the extinction to the lower value.
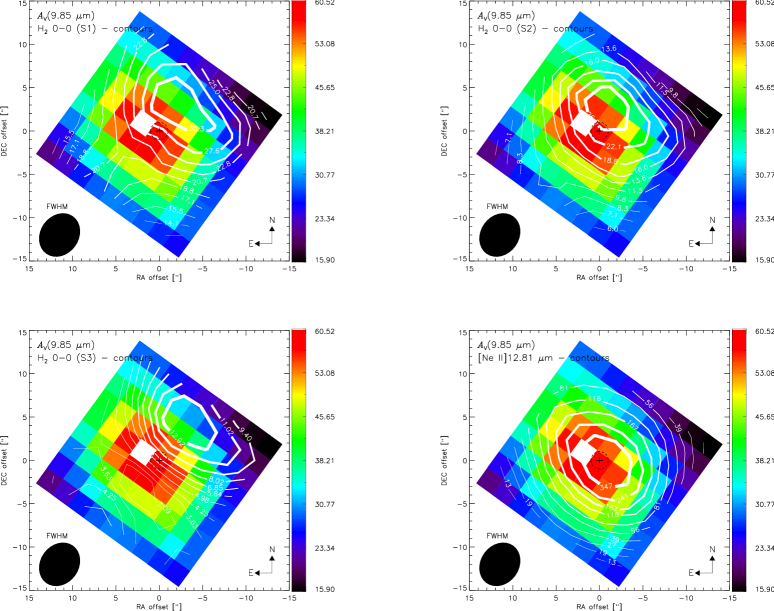
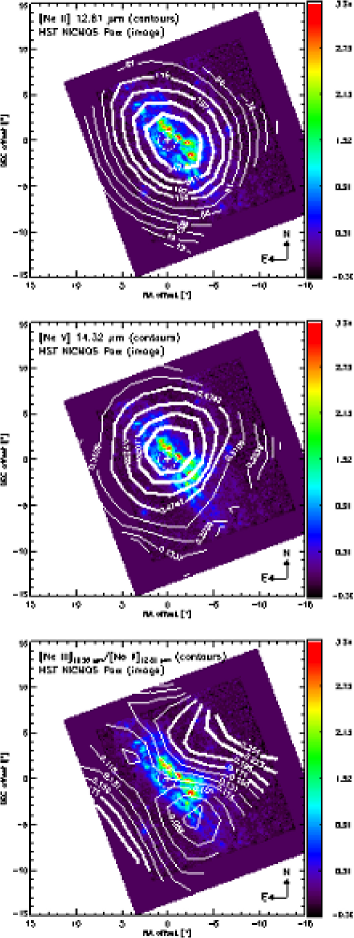
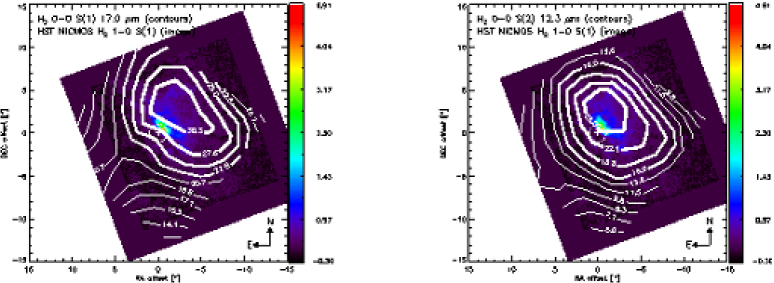
Figure 9 shows the contour lines of the IRS/SH surface brightness map of the molecular hydrogen line H2 S(1) 17.0 (top left), H2 S(2) 12.3 (top right), the IRS/SL map of the H2 S(3) 9.7 line (bottom left), and the [Ne II] 12.81 line (bottom right), overlaid on the silicate-based extinction map. The molecular hydrogen emission avoids the obscured nucleus and peaks between one and three pixels away from the highest obscuration. Although the H2 S(2) 12.3 (Fig. 6) has a similar distribution as the H2 S(1) line, its peak emission lies closer (, one pixel) to the peak obscuration and to the H2O mega maser than the other H2 lines.
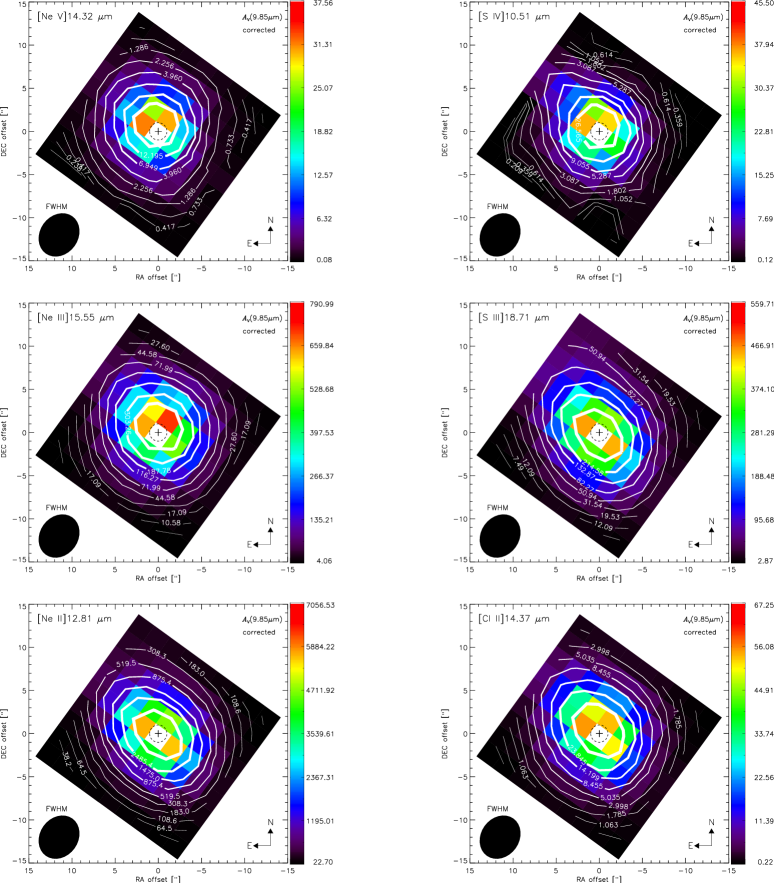
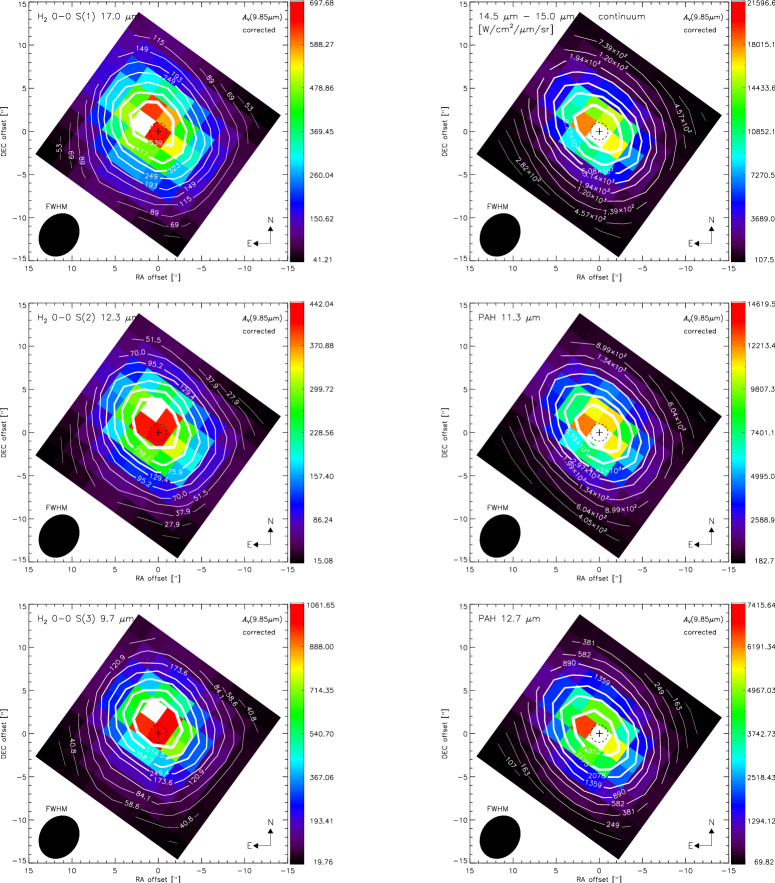
Since the distribution of the silicate-based extinction is similar to that of the stellar light-based extinction we think that the mid-IR derived extinction towards the starburst ring may be accurate to correct the fluxes of the starburst tracers. That is, the elongated shape of the silicate map indicates that the obscuration is mostly associated with the starburst ring rather than with the line of sight to the AGN. Hence, the map can be used to perform an extinction correction for species whose emission emerge from the disk. Species associated with the AGN (BLR and NLR gas) may be suffering more extinction than the disk does. Therefore, the corrected flux derived for the [Ne V] 14.32 corresponds only to the best lower limit we can derive from the current data. Figures 10 and 11 show the same set of maps as in Figs. 5 and 6, but corrected for extinction using the estimated map. Note that after correcting for extinction, all the fine-structure emission lines, the average 14.5–15.0 continuum, and the PAH features peak at about the same position, that of the H2O mega maser. The corrected for extinction H2 lines (Fig. 11) show an offset of (one pixel) with respect to the water maser. However, there is a difference of only between the centroids obtained from a two-dimensional Gaussian profile fit of all the lines.
| Line | Flux | Flux() | FWHM | ||
|---|---|---|---|---|---|
| [] | [] | [] | [] | ||
| [S IV] | 10.5105 | 1.61 | 22.03 | 382.68 | |
| 0.08 | 1.12 | 30.54 | |||
| H2 0-0 S(2) | 12.2786 | 154.07 | 889.94 | 525.66 | |
| 1.99 | 11.57 | 6.23 | |||
| [Ne II] | 12.8135 | 1201.08 | 6026.69 | 615.54 | |
| 118.85 | 563.35 | 32.37 | |||
| [Ne V] | 14.3217 | 5.34 | 27.93 | 584.70 | |
| 0.53 | 0.64 | 15.44 | |||
| [Cl II] | 14.3678 | 12.82 | 66.75 | 502.97 | |
| 0.10 | 0.53 | 4.04 | |||
| [Ne III] | 15.5551 | 127.01 | 741.49 | 640.81 | |
| 2.79 | 18.03 | 12.74 | |||
| H2 0-0 S(1) | 17.0348 | 252.60 | 1781.25 | 549.60 | |
| 7.64 | 63.90 | 18.12 | |||
| [S III] | 18.7129 | 74.87 | 618.00 | 562.71 | |
| 1.37 | 10.90 | 9.59 |
-
a
These are the fluxes obtained from the co-added spectra of the whole 1010 aperture of the SH map described in Sec. 3.
-
b
Rest wavelength of the lines.
-
c
The flux densities of each line are given in the first row. The row below shows the corresponding uncertainties.
- d
-
e
Line width in obtained from the Gaussian fit. The line profile is not corrected for the instrumental profile, which has a FWHM of 500 km/s.
The integrated flux densities of the co-added spectra from the whole 1010 aperture of the IRS/SH map (described in Sec. 3) are summarized in Table 1. In this work we include only the fluxes of the most prominent emission lines. These fluxes are larger than those reported by Bernard-Salas et al. (2009), because our 1010 aperture is larger than the SH staring aperture. In Table 1 we also include the fluxes corrected with the silicate-based extinction , and the line widths (FWHM) as estimated from the Gaussian fit.
3.5 Rotation in the nuclear region
Even though the spectral resolution (R600) of the IRS/SH module is relatively low in comparison to the resolution used in most kinematic studies, we used the SH spectra to determine shifts in the velocity of various lines. Pereira-Santaella et al. (2010) studied the validity of the SH velocity fields by using synthetic spectra. They found that the distortion of the wavelength scale introduced by the telescope pointing uncertainties limits the accuracy of the velocity estimates up to , regardless of the S/N of the spectra, for sources which are neither point sources nor uniformly extended sources (e.g., the nuclear region of NGC 4945). Considering as well the uncertainty in the absolute wavelength calibration (% of a pixel), which does depend on the S/N of individual spectra, Pereira-Santaella et al. estimated uncertainties of in the SH velocity fields, and concluded that variations of in the velocity maps are likely to be real.
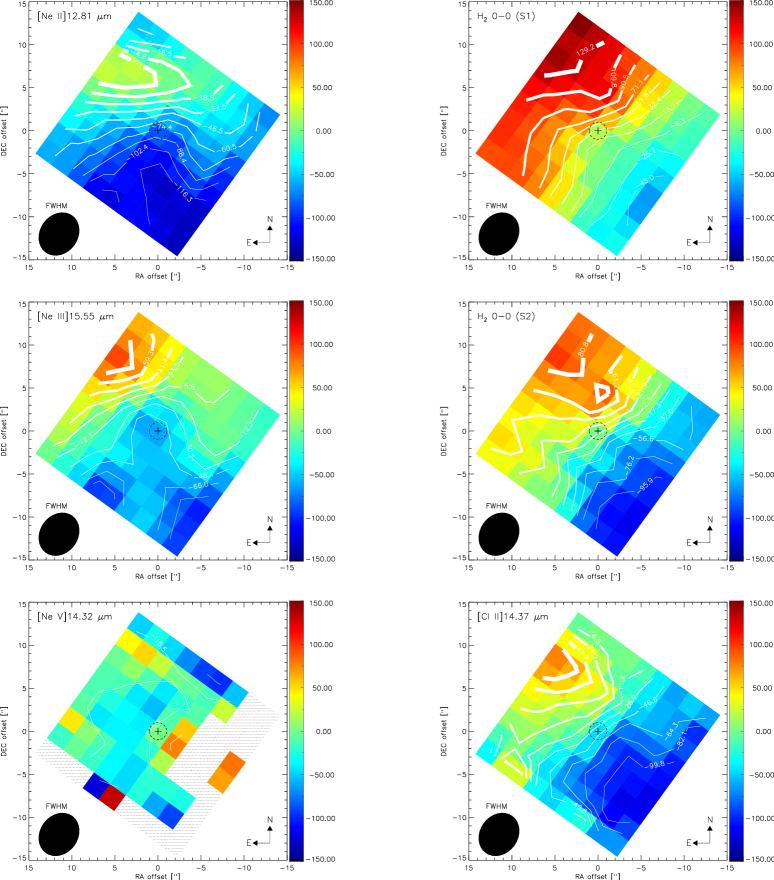
The derived velocity fields of the [Ne II] 12.81 , [Ne III] 15.56 , H2 0-0 S(1) 17.0 and S(2) 12.3 , and the [Cl II] 14.37 lines are shown in Fig. 12. These correspond to the lines with the highest S/N () in the SH spectra throughout the whole region mapped, and therefore the velocity fields derived from them are considered to be reliable. We also include the velocity field of the [Ne V] 14.32 line, although with a much lower S/N ranging from to throughout the map. The pixels with less than a detection level in the [Ne V] line (mostly found at the edges of the map, where the S/N is the lowest) are shown as hatched.
Given that the galaxy major axis runs at PA, and the fact that the inclination of the nuclear disk has been estimated to be smaller () than the inclination () of the large-scale galactic disk (Chou et al., 2007), we find that the range of velocities probed in a region of () with the [Ne II], [Ne III], and H2 S(2) lines agree with the range of velocities probed by the ISAAC long slit spectra of the H I Pf and H2 0-0 S(9) lines by Spoon et al. (2003, their Fig.7).
The velocity structure of [Ne II] (top left panel in Fig. 12) shows a gradient along the N-S direction rather than NE-SW, as in the case of H2 0-0 S(1) (top right panel in Fig. 12). A similar difference in velocity structure is observed in the [Ne III] and H2 0-0 S(2) velocity maps (middle left and middle right panels in Fig. 12, respectively). These different kinematic components may be caused by different origins related to the species emitting, or by different levels of extinction (extinction law at different wavelengths), which allow us to probe deeper regions at one wavelength than another. This is further discussed in Sect. 4.2.
On the other hand, the relatively uniform central region of the [Ne V] velocity field may be due to the lack of spectral resolution and the lower (factor 1 to 100) S/N level obtained in this line. This implies that we are unable to spectrally resolve, at a reliable level, the rather small () velocity shifts in the [Ne V] line. Nevertheless, with a higher spectral resolution we would expect a weaker rotation of [Ne V] in comparison to the rotation shown by the starburst tracers (from about to ). If the [Ne V] is exclusively related to the AGN NLR, this would mean that the NLR gas does not feel the gravitational pull of the large gas mass interior to the starburst ring. But it would feel the pull from the SMBH, showing not necessarily the same kinematics as the gas in the starburst ring. In fact, the group of three pixels next () to the adopted location of the AGN (the H2O mega maser), shows positive velocities (in the range with uncertainties of 1% in the line fit) which is opposite to the characteristics of the velocity fields of the starburst tracers. This might be a sign of the kinematically decoupled component discovered at the center of the disk with interferometric maps of the transitions of 12CO, 13CO, and C18O (Chou et al., 2007). However, higher spectral and spatial resolution observations of the [Ne V] line are required to reliably conclude on this.
4 Discussion
4.1 Tracing the circumnuclear starburst ring
The [Ne II] and [S III] fine-structure lines are our cleanest tracers of star formation (H II regions). If an AGN is present, however, the [Ne III] and [S IV] lines will have contributions from both the starburst and the AGN. In NGC 4945 the AGN contamination to [Ne III] is likely low, given the faintness of [Ne V]. In fact, at the peak flux of the [Ne V] and [Ne III] maps (Fig. 5) the former corresponds to only about 5% of the [Ne III] flux.
From Table 1 we derive the respective luminosities of and , using a luminosity distance =3.82 Mpc. However, from the relation between and by Gorjian et al. (2007) (which holds for a group of Seyfert 1 and 2, AGNs, ULIRGs and radio galaxies), the predicted [Ne III] luminosity should be , that is a factor 5.4 lower than observed. This means that NGC 4945 has a slightly lower AGN contribution to the [Ne III] line than the outlier NGC 3079 found in the sample by Gorjian et al. (2007), for which the [Ne III] luminosity is a factor 5 brighter than expected based on its [Ne V] luminosity.
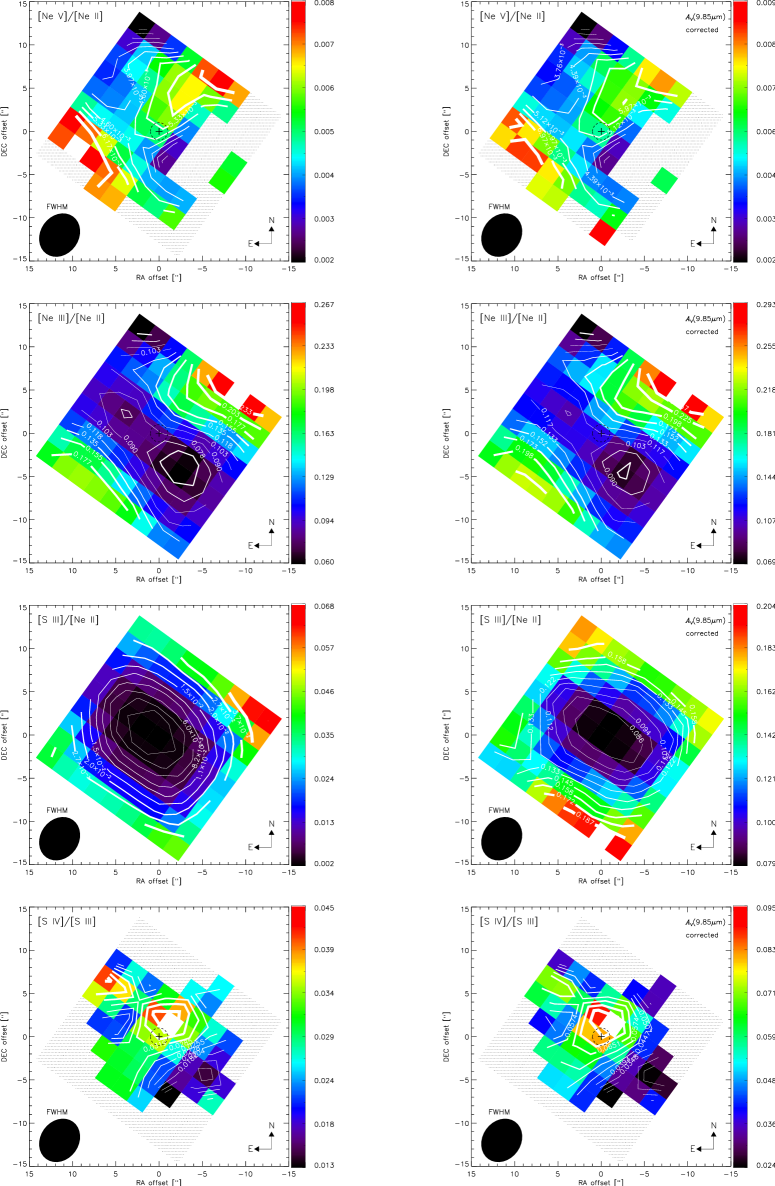
The [Ne III] 15.56/[Ne II] 12.81 line ratio (Fig. 13) ranges between 0.13 and 0.27 above and below the major axis of the region mapped. The difference with the lowest ratios (0.06–0.13), which are found along the northeast-southwest axis, is more pronounced than in the [Ne V] 14.32/[Ne II] 12.81 line ratios (top left panel in Fig. 13).
The lowest [Ne III] 15.55 /[Ne II] 12.81 line ratios coincide with the 100 pc-scale circumnuclear starburst ring of NGC 4945 (bottom panels in Fig. 14), detected in Pa emission with HST NICMOS (Marconi et al., 2000). The increasing gradient above the starburst ring seems to mimic the conical-shaped cavity traced by the H2 1-0 S(1) line (Marconi et al., 2000). However, the ratio also increases toward the south-east direction from the starburst ring, which rather implies that the ring has different properties than its surroundings.
In fact, a similar increase of [Ne III]/[Ne II] ratios away from the nucleus is observed in the nuclear maps by Pereira-Santaella et al. (2010, their Fig.5), with exception of NGC 7130, the only galaxy classified as LINER/Seyfert 2 in their sample. According to (Snijders et al., 2007) the higher the metallicity, the higher the age of the stellar population and the higher the gas density, the lower should be the [Ne III] 15.55 /[Ne II] 12.81 ratio.
The [S III] 18.71/[Ne II] 12.81 line ratio is considered a good tracer of densities in the range and because their similar excitation potentials (21.6 eV and 23.3 eV, for [Ne II] and [S III], respectively) and significantly different critical densities ( for [Ne II] and for [S III]) make this ratio less sensitive to the hardness of the radiation field than to the density of the ISM. According to the models by Snijders et al. (2007) a lower [S III]/[Ne II] ratio would indicate larger densities. In Fig. 13 the [S III] 18.71/[Ne II] 12.81 line ratios are also lower in the center than around it. This ratio ranges between 0.002 and 0.013 in the center, which indicate densities larger than in a 5 Myr old starburst system with solar metallicity and relatively high () ionization parameter (Snijders et al., 2007, their Fig.5). Based on our observed [Ne III]/[Ne II] ratios, the [S III]/[Ne II] ratios predicted with the model by Pereira-Santaella et al. (2010, their equation 2) are about ten times larger than the observed ratios. These can be a consequence of the about 10 times higher extinction found in NGC 4945 than in the sample of galaxies used by Pereira-Santaella et al. (2010).
The [Ne III]/[Ne II] line ratios obtained with the extinction correction (middle right panel in Fig. 13) are just 9% larger than without correction. This relatively small change after the extinction correction is because even in a high-extinction situation the differential extinction between [Ne III] and [Ne II] is small, given that both lines are closely spaced in wavelength and not in one of the silicate absorption features. On the other hand, because of their larger differential (wavelength) extinction, the [S III]/[Ne II] ratios corrected for extinction do change significantly from a factor 50 in the center (where the extinction is larger) to a factor 3 away from the center (where the extinction is lower).
Note that only the ratios from our co-added fluxes (Table 1) can be compared to other galactic nuclei, as the 1010 aperture is comparable to the size probed in any of the more distant galaxy nuclei. The [Ne III]/[Ne II] ratio at the position of the H2O mega maser is about 10% lower than the ratio obtained from the fluxes of the 1010 co-added spectrum (Table 1).
Since in starburst environments the [Ne II] and [Ne III] emission lines are expected to be driven mainly by photo-ionization (e.g., Ho & Keto, 2007), the lower ratios found along the northeast-southwest axis are likely due to a [Ne II] emission enhanced by the starburst ring. Although, these low ratios are also consistent with a ratio [Ne III]/[Ne II]0.1 found in shocks (Binette et al., 1985) where the low ionization line [Ne II] can also be enhanced (Voit, 1992).
On the other hand, the highest [Ne III]/[Ne II] ratios found above and below the starburst ring are larger than those typically found in shocks. These higher ratios could actually be tracing an additional contribution to the [NeIII] emission by a conically shaped narrow line region (NLR). Previously, no evidence was found for the existence of such a NLR, given the absence of 5007Å [O III] emission in the central 800pc800pc (Moorwood et al., 1996b). Instead the conical cavity traced by optical and near-infrared line and continuum tracers (Moorwood et al., 1996b; Marconi et al., 2000) was associated with a starburst super wind. However, given the high extinction implied by our observations, optical [O III] emission can be easily attenuated; mid-infrared [Ne III] emission less so. A hypothetical conical NLR would be difficult to identify from a [Ne III] map alone due to blending with the nuclear starburst component. But it may manifest itself more clearly in a [Ne III]/[Ne II] map, in which the contribution of the starburst component diminishes quickly beyond the nucleus proper.
The [Ne III]/[Ne II]0.06–0.13 ratios observed along the starburst ring are in close agreement with the ratios observed in some galaxies of the ISO starburst sample and are consistent with burst timescale models predicting a relatively short-lived starburst of (Thornley et al., 2000, their Fig.6). In the whole region mapped, we observe ratios [Ne III]/[Ne II]0.3, which are a factor 3 lower than the ratios observed in the sample of quasars reported by Veilleux et al. (2009). However, the ratio [Ne III]/[Ne II]0.07 observed at the nucleus of NGC 4945 is comparable to the ratios observed in the nucleus of 5 (out of 16) galaxies in the sample of LIRGs studied in Pereira-Santaella et al. (2010, their Fig.14).
On the other hand, the differential extinction between [S III] and [S IV] is larger than between [Ne II] and [Ne III]. Because [S IV] is sitting close to the deepest point of the silicate absorption feature at 9.7 (Fig.2), the [S IV] 10.51/[S III] 18.71 line ratios corrected for extinction (bottom right in Fig. 13) are a factor 2 larger than those obtained without correction (bottom left in Fig. 13). In both cases the highest ratio is found about (one pixel) northwest of the H2O mega maser. The uncorrected for extinction map-averaged ratios (from the fluxes in Table 1) of [Ne III]/[Ne II]0.11 and [S IV]/[S III]0.02 are similar (within 10%) to the ratios obtained from the SH staring observations by Bernard-Salas et al. (2009). They position NGC 4945 among the sources with the lowest hardness of the radiation field in their sample of starburst galaxies, which, according to Bernard-Salas et al., may be an indication of an old (or small) population of massive stars in NGC 4945. However, this can be concluded only for the outermost surface that we can probe with [S IV] and [S III] lines, and we cannot rely much on the extinction corrected data for this analysis, since the [S IV]/[S III] ratio depends more on the extinction law used than the [Ne III]/[Ne II] ratio.
4.2 Molecular hydrogen gas
As can be seen in Figures 5 & 6, the emission centroids of the H2 0-0 S(1), S(2) and S(3) lines are clearly offset from the centroids of the low ionization fine-structure lines, which all peak close to the H2O mega maser. Such an offset is hard to understand if the H2 0-0 S(1), S(2) and S(3) lines and the HII region gas would be exposed to similar amounts of extinction. The differential extinction between H2 S(2) and [Ne II], at 12.28 and 12.81 , for instance, is very small. The same is true for the wavelengths of H2 S(1) and [S III] at 17.0 and 18.71 , respectively. The lack of H2 0-0 S(1), S(2) and S(3) emission at the position of the mega maser can be explained if the molecular hydrogen emission in the nucleus would be more strongly attenuated than the HII region gas. That is, the inner H2 emission would suffer additional/differential extinction that is not accounted for by the silicate feature. On the other hand, analysis of the higher pure rotational lines observed in the SL module (Spoon et al. in preparation) and with VLT-ISAAC (Spoon et al., 2003, their Figure 7) indicates that the S(5), S(7) and S(9) lines originate progressively closer to the nucleus. This seems hard to reconcile with the above scenario, given that A()/AV in the S(5)-S(9) wavelength range is likely higher than in the S(1)-S(2) wavelength range.
We instead favour a scenario in which the lower pure rotational lines S(1) and S(2) mainly originate from an unobscured extra-nuclear component associated with the super-wind cone as seen in the HST NICMOS map of the vibrational H2 1-0 S(1) emission (Marconi et al., 2000). Figure 15 shows the IRS/SH maps of the pure rotational H2 S(1) and S(2) lines overlaid on the H2 1-0 S(1) map. Interestingly, the two pure rotational lines peak further from the apex of the cone than the 1-0 S(1) line does. The 0-0 S(1) line (upper level energy 1015 K) more so than the 0-0 S(2) line (=1682 K). In this scenario the higher pure rotational lines S(5), S(7) and S(9) would originate mainly from the starburst ring or within. There one likely finds the high critical densities () as well as high gas temperatures ( K) needed to thermalize these lines (as seen in active galaxies like NGC 1068, Mrk 231, and Arp 220; e.g. Pérez-Beaupuits et al., 2007, 2009; Aalto et al., 2007; van der Werf et al., 2010), but they will also be affected by strong extinction. The latter may cause the nuclear component of the 2.12 m H2 1-0 S(1) line (=6950 K) to suffer far more extinction than the longer wavelength H2 0-0 S(5)-S(9) lines and therefore to be associated solely with the conical cavity. In all of this the H2 0-0 S(3) line, originating at an upper level energy of 2500 K, may have both strong nuclear and cavity components. Due to the extreme extinction the nuclear component would be suppressed, leaving only the cavity component for us to see.
4.3 Excitation of H2
For LTE conditions, and an ortho-to-para ratio of 3 (Neufeld et al., 2006, their Fig.13), we can estimate the excitation temperature of the molecular hydrogen throughout the region mapped with the IRS/SH module, from the ratio between the flux of the H2 0-0 S(2) 12.3 and H2 0-0 S(1) 17.0 lines as
| (4) |
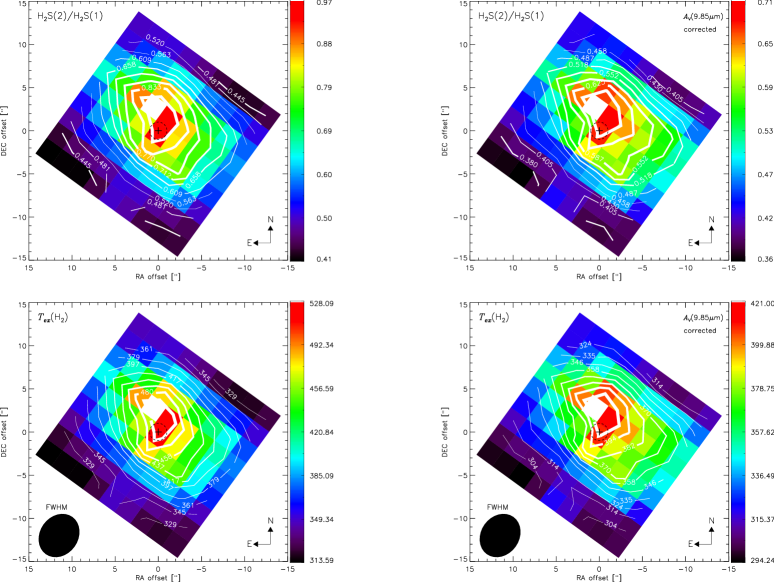
where and are the integrated flux densities of the H2 0-0 S(1) and S(2) lines, is the corresponding rest frequency ( for S(1) and for S(2)), and and are the respective Einstein -coefficients and statistical weights of each transition. The upper level energy of the transitions is in units of .
Figure 16 shows the IRS/SH maps (not corrected for extinction) of the H2 0-0 S(2) to S(1) total flux ratio (top left panel), and the corresponding map of the excitation temperature () (bottom left panel) of the molecular hydrogen, estimated from eq.(4). The peak excitation temperature of is reached 2.3′′ (one pixel) to the north of the H2O mega maser. The right panels of Fig. 16 show the H2 0-0 S(2)/S(1) ratio and the estimated excitation temperature from the respective H2 fluxes corrected for extinction with the silicate-based . The correction for extinction leads to a peak temperature of , which is about lower than the temperature derived from the non-corrected fluxes. However, the distribution of the temperature, and the position of its peak value, do not change.
Since galaxies are complex systems, the H2 gas is not expected to be at a single temperature. Besides, a long line of sight can probe different excitation environments (e.g., PDRs, XDRs, shocks) like in the sample of galaxies studied by Roussel et al. (2007). Previous estimates of the excitation temperature, based on SWS observations of the (0-0) S(0) and S(1) fluxes detected in the nucleus of NGC 4945, led to a cooler H2 component with (corresponding to about 9% of the total H2 mass), while a temperature (about 0.4% of H2 mass) was estimated from the S(1) and S(2) fluxes (Spoon et al., 2000, their Table 6), which is in close agreement with our result considering the size of the big SWS slit. This excitation temperature is similar to the temperature derived for the low-energy transitions in NGC 1377 (Roussel et al., 2006), but higher than the temperature of estimated from the S(0)-S(3) lines observed in NGC 6240 (Higdon et al., 2006).
Since we cannot use the map of the H2 S(3) 9.7 line due to the flux mismatch between the SH and SL modules mentioned in Sec. 3, we would only be able to base our estimate of the warm H2 mass on the S(1) and S(2) lines. In fact, even if we had been able to use the S(3) line, most of the mass is revealed by including the S(0) line. This line has however not been mapped, since the spatial resolution of the LH module is much lower than that of the SH and SL modules.
4.4 AGN dominated [Ne V] emission?
The detection of [Ne V] emission from the nucleus of NGC4945 is not surprising. The galaxy hosts a 1.4106 M⊙ super massive black hole, as revealed by H2O maser observations (Greenhill et al., 1997) with an intrinsic 0.1–200 keV luminosity of 1.81043 erg s-1 (Guainazzi et al., 2000).
More remarkable is the faintness of the [Ne V] emission. Only 10-6 of the infrared luminosity of the galaxy is detected in the [Ne V] line (Table 1). This is surprisingly little for an AGN which can easily account for the entire bolometric emission of the galaxy (Marconi et al., 2000). It is also 100 times less than L([Ne V])/LIR for galaxies whose IR luminosity is dominated by AGN activity (Goulding & Alexander, 2009).
Interesting is also the size of the [Ne V] emitting region, which can be reasonably well constrained given that at a distance of 3.82 Mpc one arcsecond corresponds to 18.5 pc. Since the spatial profile of the [Ne V] map (Figure 5) is only marginally wider than the PSF, the radius of the [Ne V] emitting region will be less than 55 pc (3′′). This upper limit is large in comparison to the size of coronal line regions (e.g. 19 pc for Circinus as probed by the 2.48 [Si IV] line; Prieto et al., 2004), but small compared to the kpc scale of narrow line regions as probed with [O III] (e.g. Circinus; Marconi et al., 1994).
Both the faintness and the observed extent of the [Ne V] emission are likely affected by strong extinction within the nucleus. However, if the narrow line region were to extend above the plane of the molecular disk in which the AGN and the circumnuclear starburst are embedded, the amount of extinction would be less than probed by the silicate absorption feature (=50-60). The amount will, however, certainly be less than the line of sight extinction to the AGN broad line region, NH=2.41024 cm-2, (Guainazzi et al., 2000), which is equivalent to =1300.
The extinction probed by the silicate absorption feature is consistent with the F([Ne V])/F(14-195 keV) ratio found for Sy1 galaxies (Weaver et al., 2010) when multiplied by the absorption corrected 14-195 keV flux for NGC 4945. The latter depends on the geometry of the absorber, and ranges between 5 and 10 times the Swift-BAT flux of NGC 4945 (F(14-195 keV)=330.8 10-18 W cm-2; Tueller et al. (2010)) for a spherical and edge-on disk geometry, respectively (K. Iwasawa, private communication). Taking further into account the factor 2.5 scatter in the F([Ne V])/F(14-195 keV) ratio for Sy1 galaxies, the attenuation on the [Ne V] flux ranges between 12 and 157, which corresponds to =55-112 mag for our adopted local ISM extinction law of Chiar & Tielens (2006). This result would indicate that the NLR is buried along with the other components of the nuclear molecular disk.
The strong obscuration to the NLR in NGC 4945 may serve as a warning that mid-infrared NLR tracers such as [Ne V] and [O IV] may not always be suitable as tracers of the AGN luminosity as suggested by Goulding & Alexander (2009). Galaxies in this risk group may be recognized by the presence of a deep silicate absorption feature in their mid-infrared spectra and a classification 3A, 3B or 3C in the mid-infrared galaxy classification scheme of Spoon et al. (2007). Besides NGC 4945 galaxies in this group include LIRGs such as NGC 4418 and ULIRGs like Arp220, IRAS 08572+3915 and IRAS F00183-7111.
The example of NGC 4945 may also serve as a warning that the non-detection of NLR tracers in AGN does not necessarily imply the absence of a NLR. Instead it may indicate that the NLR is so strongly attenuated that the line does not emerge above the continuum noise. In these cases, only deep mid-IR observations, like the ones presented here, would reveal these tracers.
In NGC4945 the [Ne V] line was detected at 5% of the continuum flux in a spectrum with continuum S/N of 140 in the 14-15 range. Other galaxies which may host an AGN, and which have been observed at similar S/N (among them ULIRGs like Arp220 and IRAS 08572+3915), do not show evidence for [Ne V] emission (Armus et al., 2007). The NLR in these galaxies may hence be even more strongly obscured than in NGC 4945, or the AGN may contribute a far smaller fraction of the bolometric power than in NGC 4945. The NLR may also simply not exist if the ionizing photons needed to form the NLR are 4 obscured close to their origin.
4.5 [Ne V] emission from supernovae? the template Cassiopeia A
Although the [NeV] emission is unresolved along the major axis and only marginally resolved along the minor axis (as discussed in Sec. 3), the fact that the [Ne V] line has also been observed in supernova remnants (SNRs) (e.g. Oliva et al., 1999; Smith et al., 2009) raises valid questions: could the [Ne V] emission observed in NGC 4945 be powered purely by SNRs?, and if so, how many SNRs would be needed to reproduce its [Ne V] flux? Below we explore the alternative of [Ne V] emission being powered by the SNRs in the nuclear region of NGC 4945. We note, though, that the number of supernovae needed depends not only on the total [Ne V] flux but also on the actual size of the SNR.
Our analysis is based on previous Spitzer/IRS SL module observations of Cassiopeia A (Cas A) from which the global distribution of fine-structure lines covering a 5.35.3 arcminute2 area was presented by Smith et al. (2009). The total [Ne V] flux of Cas A was not reported before due to the difficulties to extract the flux with enough reliability. Using fitting techniques tailored to the [Ne V] line, we now are able to state its total flux as . Considering an average extinction mag (Hurford & Fesen, 1996) the corrected flux, using the extinction law for the local ISM by Chiar & Tielens (2006), is .
On the other hand, the total [Ne V] flux in NGC 4945 is . In order to estimate the dereddened [Ne V] emission observed in NGC 4945, we computed an average extinction value mag from the map (Fig. 8). Note that due to the stronger extinction at the central pixels, this represents just a lower limit to the actual extinction on the [Ne V] line. Thus the lower limit for the extinction-corrected total [Ne V] flux is 27.9.
Considering a canonical distance of 3.4 kpc for Cas A (Smith et al., 2009, and references therein) and 3.82 Mpc for NGC 4945, we found that the ratio between the total [Ne V] flux of NGC 4945 and Cas A, corrected by the square of the ratio between the distances , is about 19. This represents a lower limit to the number of contemporaneous Cas A type supernovae needed to produce the extinction-corrected [Ne V] emission observed in NGC 4945. Another extreme lower limit can be obtained assuming no extinction in the NGC 4945 flux, from which the same exercise indicates that about 4 Cas A type SNRs would be needed.
According to Lenc & Tingay (2009), the upper limit to the supernova rate in NGC 4945 is 15.3 , which means the individual supernovae, for the not corrected and corrected for extinction lower limits estimated above, need to emit at Cas A levels for about 260 and 1240 years, respectively. These are reasonable numbers given that the age of Cas A is estimated to be about 330 yr (Fesen et al., 2006), while the kinematic age of another [Ne V] emitting SNR, E0102, has been estimated to be yr (Finkelstein et al., 2006). This implies that the number of SNRs estimated above can indeed persist long enough to power the [Ne V] emission observed in NGC 4945, at least from the point of view of the SNR properties used in our estimate. However, Lenc & Tingay (2009, their section 4.5) also determine a median SN age of 85 yr, which translates into a median supernova rate of 0.12 SNe/yr, or a much (15.3/0.12128 times) longer radiative phase (3–16 years) needed for the individual supernovae. Therefore, the [Ne V] flux observed in NGC 4945 is likely not powered by a population of supernova remnants.
5 Final remarks
We have mapped the central region of NGC 4945 with the SH and SL modules of the Spitzer InfraRed Spectrograph. From the SH spectral cubes we produced maps of fine-structure emission lines [S IV] at 10.51 , [Ne II] at 12.81 , [Cl II] at 14.37 , [Ne III] at 15.56 , [S III] at 18.71 , the AGN narrow-line region tracer [Ne V] at 14.32 , and the molecular hydrogen lines, H2 S(2) and H2 S(1) at 12.3 and 17.0 , respectively. From the SL spectral cubes we obtained maps of the H2 S(3), and the silicate absorption feature at 9.7 .
We present the first map of [Ne V] 14.32 towards the nucleus of NGC 4945 with flux detection levels down to per pixel. We produced and estimated an extinction map based on the apparent strength of the 9.7 silicate absorption feature, which traces the contours of the starburst ring at a 5′′ spatial resolution.
Most of the emission lines are found to peak on the nucleus, within the uncertainty of the astrometry. Only the warm molecular hydrogen emission shows a maximum about 60–100 pc NW of the nucleus. After correction for extinction the distribution of the H2 rotational emission is more concentrated in the nuclear region, but its peak emission is still slightly offset from the peak of the other emission lines, that of the H2O mega maser. Thus, we favour a scenario in which the lower pure rotational lines S(1) and S(2) mainly originate from an unobscured extra-nuclear component associated with the super-wind cone as seen in the HST NICMOS map of the vibrational H2 1-0 S(1) emission, with an intrinsic excitation trend toward the nucleus which is reflected in the higher level S(5)-S(9) lines.
We found that the map-integrated [Ne V]/[Ne II] ratio is consistent with ratios observed in starbursts rather than in AGNs. The [Ne III]/[Ne II]0.13 ratios observed along the starburst ring are likely due to an excess [Ne II] emission driven by the starburst ring, or to high density () ISM gas in the circumnuclear disk.
A range of extinction (which corresponds to an attenuation of a factor 12–160) estimated for [Ne V] from our observed [Ne V] flux and the absorption-corrected 14-195 keV Swift-BAT flux, indicate that mid-infrared NLR tracers such as [Ne V] and [O IV] may not be trusted as tracers of the AGN luminosity of galaxies with a deep silicate absorption feature.
A new estimate of the total [Ne V] flux in Cassiopeia A indicates that at least 4–19 Cas-A type supernova remnants, with ages between 260 (no extinction correction) and 1240 (on extinction correction) years, would be needed to power the [Ne V] emission observed in NGC 4945. However, given the actual median age of SNRs observed in NGC 4945, and the uncertainty in the true extinction of its [Ne V] emission, SNRs are not likely to fully reproduce the [Ne V] flux observed in the nucleus of this galaxy.
Acknowledgements.
We thank Varoujian Gorjian for the Spitzer-MIPS 24 map of the central region of NGC 4945. We also thank Alessandro Marconi for providing the HST NICMOS images, and Emil Lenc for the ATCA 2.3 GHz image. We thank Kazushi Iwasawa for the very useful comments and the correction factors provided for the SWIFT-BAT fluxes. We are grateful to Aleks Diamond-Stanic for constructive discussions. We also thank the referee for his/her pertinent and insightful comments. We are also grateful to the SPITZER/SINGS team for their support during and after the observations.References
- Aalto et al. (1995) Aalto, S., Booth, R. S., Black, J. H., & Johansson, L. E. B. 1995, A&A, 300, 369
- Aalto et al. (2007) Aalto, S., Spaans, M., Wiedner, M. C., & Hüttemeister, S. 2007, A&A, 464, 193
- Alonso-Herrero et al. (2009) Alonso-Herrero, A., Rieke, G. H., Colina, L., et al. 2009, ApJ, 697, 660
- Armus et al. (2007) Armus, L., Charmandaris, V., Bernard-Salas, J., et al. 2007, ApJ, 656, 148
- Baum et al. (2010) Baum, S. A., Gallimore, J. F., O’Dea, C. P., et al. 2010, ApJ, 710, 289
- Bernard-Salas et al. (2009) Bernard-Salas, J., Spoon, H. W. W., Charmandaris, V., et al. 2009, ApJS, 184, 230
- Binette et al. (1985) Binette, L., Dopita, M. A., & Tuohy, I. R. 1985, ApJ, 297, 476
- Brandl et al. (2006) Brandl, B. R., Bernard-Salas, J., Spoon, H. W. W., et al. 2006, ApJ, 653, 1129
- Brock et al. (1988) Brock, D., Joy, M., Lester, D. F., Harvey, P. M., & Ellis, Jr., H. B. 1988, ApJ, 329, 208
- Chiar & Tielens (2006) Chiar, J. E. & Tielens, A. G. G. M. 2006, ApJ, 637, 774
- Chou et al. (2007) Chou, R. C. Y., Peck, A. B., Lim, J., et al. 2007, ApJ, 670, 116
- Done et al. (1996) Done, C., Madejski, G. M., & Smith, D. A. 1996, ApJ, 463, L63+
- Farrah et al. (2007) Farrah, D., Bernard-Salas, J., Spoon, H. W. W., et al. 2007, ApJ, 667, 149
- Fesen et al. (2006) Fesen, R. A., Hammell, M. C., Morse, J., et al. 2006, ApJ, 645, 283
- Finkelstein et al. (2006) Finkelstein, S. L., Morse, J. A., Green, J. C., et al. 2006, ApJ, 641, 919
- García-Burillo et al. (2006) García-Burillo, S., Graciá-Carpio, J., Guélin, M., et al. 2006, ApJ, 645, L17
- Genzel et al. (1998) Genzel, R., Lutz, D., Sturm, E., et al. 1998, ApJ, 498, 579
- Gorjian et al. (2007) Gorjian, V., Cleary, K., Werner, M. W., & Lawrence, C. R. 2007, ApJ, 655, L73
- Goulding & Alexander (2009) Goulding, A. D. & Alexander, D. M. 2009, MNRAS, 398, 1165
- Greenhill et al. (1997) Greenhill, L. J., Moran, J. M., & Herrnstein, J. R. 1997, ApJ, 481, L23+
- Guainazzi et al. (2000) Guainazzi, M., Matt, G., Brandt, W. N., et al. 2000, A&A, 356, 463
- Guélin et al. (2007) Guélin, M., Salomé, P., Neri, R., et al. 2007, A&A, 462, L45
- Higdon et al. (2006) Higdon, S. J. U., Armus, L., Higdon, J. L., Soifer, B. T., & Spoon, H. W. W. 2006, ApJ, 648, 323
- Ho & Keto (2007) Ho, L. C. & Keto, E. 2007, ApJ, 658, 314
- Houck et al. (2004) Houck, J. R., Roellig, T. L., van Cleve, J., et al. 2004, ApJS, 154, 18
- Hurford & Fesen (1996) Hurford, A. P. & Fesen, R. A. 1996, ApJ, 469, 246
- Itoh et al. (2008) Itoh, T., Done, C., Makishima, K., et al. 2008, PASJ, 60, 251
- Iwasawa et al. (1993) Iwasawa, K., Koyama, K., Awaki, H., et al. 1993, ApJ, 409, 155
- Jura (1974) Jura, M. 1974, ApJ, 190, L33+
- Jura & York (1978) Jura, M. & York, D. G. 1978, ApJ, 219, 861
- Karachentsev et al. (2007) Karachentsev, I. D., Tully, R. B., Dolphin, A., et al. 2007, AJ, 133, 504
- Lacy et al. (1984) Lacy, J. H., Baas, F., Allamandola, L. J., et al. 1984, ApJ, 276, 533
- Lenc & Tingay (2006) Lenc, E. & Tingay, S. J. 2006, AJ, 132, 1333
- Lenc & Tingay (2009) Lenc, E. & Tingay, S. J. 2009, AJ, 137, 537
- Lutz et al. (2002) Lutz, D., Maiolino, R., Moorwood, A. F. M., et al. 2002, A&A, 396, 439
- Madejski et al. (2000) Madejski, G., Życki, P., Done, C., et al. 2000, ApJ, 535, L87
- Marconi et al. (1994) Marconi, A., Moorwood, A. F. M., Origlia, L., & Oliva, E. 1994, The Messenger, 78, 20
- Marconi et al. (2000) Marconi, A., Oliva, E., van der Werf, P. P., et al. 2000, A&A, 357, 24
- Moorwood et al. (1996a) Moorwood, A. F. M., Lutz, D., Oliva, E., et al. 1996a, A&A, 315, L109
- Moorwood & Oliva (1988) Moorwood, A. F. M. & Oliva, E. 1988, A&A, 203, 278
- Moorwood & Oliva (1994) Moorwood, A. F. M. & Oliva, E. 1994, ApJ, 429, 602
- Moorwood et al. (1996b) Moorwood, A. F. M., van der Werf, P. P., Kotilainen, J. K., Marconi, A., & Oliva, E. 1996b, A&A, 308, L1+
- Neufeld et al. (2006) Neufeld, D. A., Melnick, G. J., Sonnentrucker, P., et al. 2006, ApJ, 649, 816
- Oliva et al. (1999) Oliva, E., Moorwood, A. F. M., Drapatz, S., Lutz, D., & Sturm, E. 1999, A&A, 343, 943
- Oliva et al. (1994) Oliva, E., Salvati, M., Moorwood, A. F. M., & Marconi, A. 1994, A&A, 288, 457
- Pedlar et al. (2003) Pedlar, A., Muxlow, T., & Wills, K. A. 2003, in Revista Mexicana de Astronomia y Astrofisica, vol. 27, Vol. 15, Revista Mexicana de Astronomia y Astrofisica Conference Series, ed. J. Arthur & W. J. Henney, 303–307
- Pereira-Santaella et al. (2010) Pereira-Santaella, M., Alonso-Herrero, A., Rieke, G. H., et al. 2010, ApJS, 188, 447
- Pérez-Beaupuits et al. (2007) Pérez-Beaupuits, J. P., Aalto, S., & Gerebro, H. 2007, A&A, 476, 177
- Pérez-Beaupuits et al. (2010) Pérez-Beaupuits, J. P., Spaans, M., Hogerheijde, M. R., et al. 2010, A&A, 510, A87+
- Pérez-Beaupuits et al. (2009) Pérez-Beaupuits, J. P., Spaans, M., van der Tak, F. F. S., et al. 2009, A&A, 503, 459
- Prieto et al. (2004) Prieto, M. A., Meisenheimer, K., Marco, O., et al. 2004, ApJ, 614, 135
- Rice et al. (1988) Rice, W., Lonsdale, C. J., Soifer, B. T., et al. 1988, ApJS, 68, 91
- Rieke & Lebofsky (1985) Rieke, G. H. & Lebofsky, M. J. 1985, ApJ, 288, 618
- Roche & Aitken (1984) Roche, P. F. & Aitken, D. K. 1984, MNRAS, 208, 481
- Roussel et al. (2007) Roussel, H., Helou, G., Hollenbach, D. J., et al. 2007, ApJ, 669, 959
- Roussel et al. (2006) Roussel, H., Helou, G., Smith, J. D., et al. 2006, ApJ, 646, 841
- Smith et al. (2007) Smith, J. D. T., Armus, L., Dale, D. A., et al. 2007, PASP, 119, 1133
- Smith et al. (2009) Smith, J. D. T., Rudnick, L., Delaney, T., et al. 2009, ApJ, 693, 713
- Snijders et al. (2007) Snijders, L., Kewley, L. J., & van der Werf, P. P. 2007, ApJ, 669, 269
- Sonnentrucker et al. (2002) Sonnentrucker, P., Friedman, S. D., Welty, D. E., York, D. G., & Snow, T. P. 2002, ApJ, 576, 241
- Sonnentrucker et al. (2003) Sonnentrucker, P., Friedman, S. D., Welty, D. E., York, D. G., & Snow, T. P. 2003, ApJ, 596, 350
- Spoon et al. (2000) Spoon, H. W. W., Koornneef, J., Moorwood, A. F. M., Lutz, D., & Tielens, A. G. G. M. 2000, A&A, 357, 898
- Spoon et al. (2007) Spoon, H. W. W., Marshall, J. A., Houck, J. R., et al. 2007, ApJ, 654, L49
- Spoon et al. (2003) Spoon, H. W. W., Moorwood, A. F. M., Pontoppidan, K. M., et al. 2003, A&A, 402, 499
- Sturm et al. (2002) Sturm, E., Lutz, D., Verma, A., et al. 2002, A&A, 393, 821
- Thornley et al. (2000) Thornley, M. D., Schreiber, N. M. F., Lutz, D., et al. 2000, ApJ, 539, 641
- Tueller et al. (2010) Tueller, J., Baumgartner, W. H., Markwardt, C. B., et al. 2010, ApJS, 186, 378
- van der Werf et al. (2010) van der Werf, P. P., Isaak, K. G., Meijerink, R., et al. 2010, A&A, 518, L42+
- Veilleux et al. (2009) Veilleux, S., Rupke, D. S. N., Kim, D., et al. 2009, ApJS, 182, 628
- Voit (1992) Voit, G. M. 1992, ApJ, 399, 495
- Weaver et al. (2010) Weaver, K. A., Meléndez, M., Mushotzky, R. F., et al. 2010, ApJ, 716, 1151
- Werner et al. (2004) Werner, M. W., Roellig, T. L., Low, F. J., et al. 2004, ApJS, 154, 1
- Whittet (2003) Whittet, D. C. B., ed. 2003, Dust in the galactic environment
- Willett et al. (2010) Willett, K. W., Stocke, J. T., Darling, J., & Perlman, E. S. 2010, ApJ, 713, 1393