Unveiling the nature of IGR J171773656 with X-ray, NIR and Radio observations
Abstract
We report on the first broad-band (1–200 keV) simultaneous Chandra-INTEGRAL observations of the recently discovered hard X-ray transient IGR J171773656 that took place on 2011, March 22, about two weeks after the source discovery. The source had an average absorbed 1–200 keV flux of about 8. We extracted a precise X-ray position of IGR J171773656, =17h 17m 42s.62, = 36∘ 56′ 04.5′′ (90% uncertainty of 0.6′′). We also report Swift, near infrared and quasi simultaneous radio follow-up observations. With the multi-wavelength information at hand, we propose IGR J171773656 is a low-mass X-ray binary, seen at high inclination, probably hosting a black hole.
Subject headings:
accretion, accretion disks – X-rays: binaries – binaries: close – stars: individual: IGR J1717736561. Introduction
On 2011 March 15 (MJD 55635), INTEGRAL discovered the new hard X-ray transient IGR J171773656 (frankowski11). The IBIS/ISGRI spectrum (20–200 keV) could be well described by a power-law with photon index 1.80.3 and a flux of about 20 mCrab. The source was also marginally detected in JEM-X in the 10–20 keV band (about 8 mCrab) but was not detected in the 3–10 keV band with a 3 upper limit of 5 mCrab.
Following the INTEGRAL discovery, a Swift ToO was performed on
2011 March 16 (zhang11). A refined Swift position was reported (90% uncertainty of 2.1′′),
consistent with the INTEGRAL one.
A combined, though non simultaneous, Swift/XRT and INTEGRAL/IBIS/ISGRI spectral fit with an absorbed power-law
model yielded = and photon
index =1.50.2 indicating a hard state with additional absorbing column density intrinsic to the source (zhang11).
Based on the Swift position and uncertainty, a search through the VizieR database resulted only in one match:
2MASS J171742693656039 (K=12.9) located at about 1.3′′ from the Swift position of zhang11.
Our Chandra ToO was performed on 2011 March 22, and
thanks to the excellent Chandra location accuracy, an X-ray source position with a 0.6′′ (90%) uncertainty was reported (paizis11). The new Chandra-based position, not consistent with the Swift one
(4.8′′ away, but see Section 3.4), probably ruled out the 2MASS association (1.05′′ away) and allowed the scientific community as well as members of our team to search for NIR and radio counterparts (this paper; corbel11; torres11; rojas11).
The nature of IGR J171773656 is still to be unveiled and in this paper we describe our multi-wavelength campaign and
contribution to its investigation.
2. Multi-wavelength observations
We present a detailed broad-band analysis of the recently discovered IGR J171773656111See http://irfu.cea.fr/Sap/IGR-Sources/ for a regularly updated list of INTEGRAL sources using our Chandra ToO data and simultaneous higher energy INTEGRAL ones. To obtain an overall view of the behavior of IGR J171773656, we also have analyzed available Swift and INTEGRAL monitoring data relevant to our investigation. Given our Chandra position, we triggered Near Infrared (NIR) observations to look for possible counterparts to IGR J171773656. These data are included in this paper, as well as the quasi-simultaneous radio observation reported by corbel11.
2.1. Chandra data
We observed IGR J171773656 for 20 ks with Chandra on 2011 March 22, from 06:07:15 UT until 12:00:48 UT (MJD 55642, Observation ID 12452) with the High Energy Transmission Grating Spectrometer, HETGS (canizares00) collecting high resolution spectral information with the High Energy Grating, HEG 0.8–10 keV, and Medium Energy Grating, MEG 0.4–8.0 keV. The data were analyzed in a standard manner, using the CIAO version 4.3 software package and Chandra CALDB version 4.4.2. The spectra were analyzed with the ISIS analysis system, version 1.6.1 (houck02).
2.2. INTEGRAL data
Starting from its discovery, IGR J171773656 has been in the INTEGRAL/IBIS (ubertini03) field of view during the Galactic bulge monitoring222http://isdc.unige.ch/Science/BULGE/ (kuulkers07), as well as during the inner disk (l ¡ 0) observations. A complete study of these INTEGRAL data is out of the scope of this paper. We will focus on the simultaneous Chandra/HETGS-INTEGRAL/IBIS set, in the first simultaneous broad-band study of IGR J171773656. To properly understand the long-term hard X-ray behavior of the source (¿ 20 keV) however, we have analyzed the IBIS/ISGRI data (20–600 keV; lebrun03) starting from revolution 1028 (March 15, 2011, 09:23:08 UT, MJD 55635.39) to revolution 1032 (March 28, 2011, 22:16:46 UT, MJD 55648.93), spanning a period of about 14 days. A standard analysis using version 9.0 of the Off-line Scientific Analysis (OSA) software was performed.
2.3. Swift data
The 2011 outburst of IGR J171773656 was monitored with a total of eight daily pointed observations with the Swift X-Ray Reflecting Telescope (burrows05; gehrels04) between 2011 March 16 and 2011 March 23. Exposure times varied between 2 ks and 8 ks. The data were processed using the newest version of the Swift data analysis pipelines in HEASOFT 6.10. After re-processing the data with xrtpipeline, spectra for were extracted with xselect using XRT grades 0 through 12. We used the newest XRT response matrix available in CALDB. Ancillary response matrices were generated using xrtmkarf, taking vignetting effects into account.
In addition to these data, IGR J171773656 was in the field of view of a 560 s long XRT pointing taken on 2011 January 27, but it was not detected during that observation.
2.4. Radio data
We conducted continuum radio observations with the Australia Telescope Compact Array (ATCA) located in Narrabri, New South Wales, Australia. The ATCA synthesis telescope is an east-west array consisting of six 22 m antennas. The ATCA uses orthogonal polarized feeds and records full Stokes parameters. We carried out the observations with the upgraded Compact Array Broadband Backend (CABB), which provides a new broadband backend system for the ATCA and increases the maximum bandwidth from 128 MHz to 2 GHz.
The ATCA observations were conducted on the same day as the Chandra observations, 2011 March 22, at two frequency bands simultaneously, with central frequencies at 5.5 GHz and 9 GHz. The ATCA was in the intermediate 1.5A configuration. A total observation time of 0.66 hr on source was obtained for IGR J171773656. The amplitude and band-pass calibrator was PKS 1934638, and the antenna’s gain and phase calibration, as well as the polarization leakage, were derived from regular observations of the nearby (2.9∘ away) calibrator PMN 1714336. The editing, calibration, Fourier transformation, deconvolution, and image analysis were performed using the MIRIAD software package (sault95; sault10). The cleaning process was carried out using a combination of multi-frequency (sault94) and standard clean algorithms.
2.5. Near-infrared data
Near-infrared observations were performed at the Universitätssternwarte Bochum near Cerro Armazones in the Chilean Atacama desert. We used the 80 cm IRIS telescope equipped with a 1024 1024 pixels HAWAII-1 detector array (hodapp11). The observational sequence consisted of eight exposures between MJD 55647.38 and 55647.40 (2011 March 27, 09:10:50 ¡ UT ¡ 09:38:36) each comprising conventional dithering and chopping patterns to allow subtraction of the bright NIR sky. The total on-source integration time was 400 s. Data reduction involved standard IRAF procedures; astrometry and photometric calibration were achieved via 1958 sources from the 2MASS archive.
3. Results
An overview of all the data treated in this paper is shown in Fig. 1. The absorbed 2–8 keV flux evolution of IGR J171773656 as seen by Swift is shown together with our Chandra average data point333The absorbed flux is shown, which we believe to be a more solid indication of the source state given its heavy intrinsic and variable absorbing column density.. The INTEGRAL coverage of the source is marked as horizontal lines. Finally, the time of our NIR observation and of the radio observation included in this work are also shown.

3.1. Chandra position, variability and spectra
We extracted the X-ray position of IGR J171773656 from the -order image
obtaining =17h 17m 42s.62,
= 36∘ 56′ 04.5′′ (paizis11).
Given the brightness of the source, the statistical error is smaller than the
absolute position accuracy of Chandra, 0.6′′ at 90%
uncertainty444http://cxc.harvard.edu/cal/ASPECT/celmon/. Therefore we attribute to the position
found a 90% uncertainty of 0.6′′.
In paizis11 we performed a simple phenomenological fit to the MEG and HEG first order grating spectra. The Chandra total (about 20 ks) spectrum was consistent with an absorbed power-law with a column density
of approximately =(5.9 1.5 (90% confidence) and
photon index =1.20.4 (90% confidence) with the source at about a 3 mCrab flux level in the 2–10 keV range. The Chandra spectrum alone is very hard but this is likely due to the narrow energy range in which the
fit is performed, which is strongly absorbed at lower energies by the heavy intrinsic absorbing column density present in the source.
A detailed analysis of the source light-curve, with 200 s time bins, showed variability, hence we
cut the data in three, non-contiguous, intervals: a 2–8 keV rate ¡ 40 counts/bin
(Chandra-Low, 4.6 ks), between 40–60 counts/bin (Chandra-Mid, 4.5 ks), and ¿ 60 counts/bin (Chandra-High, 10.4 ks).
| Instrument | 2–8 keV FluxaaAbsorbed flux, relative to the Chandra response. | 20–200 keV FluxbbRelative to the IBIS/ISGRI response, and includes the cross normalization constant. | DoF | ||||
|---|---|---|---|---|---|---|---|
| () | () | () | |||||
| Chandra– Low | 1 | 130.9/111 | |||||
| Chandra– Mid | 1 | ||||||
| Chandra– High | 1 | ||||||
| Note. — Errors are 90% confidence level for one parameter. is the neutral column density local to the system. The ISM interstellar column density has been fixed to . is a dimensionless constant to allow for partial covering (covering fraction ). is the powerlaw photon index, which was constrained to be the same for all datasets. For the IBIS/ISGRI data, all model parameters have been tied to those of the Chandra High dataset. We have further allowed for a cross-normalization constant, , for the IBIS/ISGRI detector. (This cross-normalization also subsumes the intrinsic flux variation of the Chandra spectra.) For each of the three intervals, we extracted again the first order dispersed spectra ( for HEG and MEG) and to increase the signal-to-noise ratio, we merged the two HEG () and MEG () spectra into one combined spectrum, for a total of three spectra (one per rate level)555The Chandra -order, that qualitatively verifies the source flux variability, was not used in the spectral analysis as it suffers from pile-up.. Final binning, starting at 0.8 keV, was chosen to have a signal to noise ratio higher than 5 and a minimum of 16 MEG channels per bin. The fitting results of these three spectra are given in Section 3.3 together with the simultaneous INTEGRAL/IBIS one. | |||||||
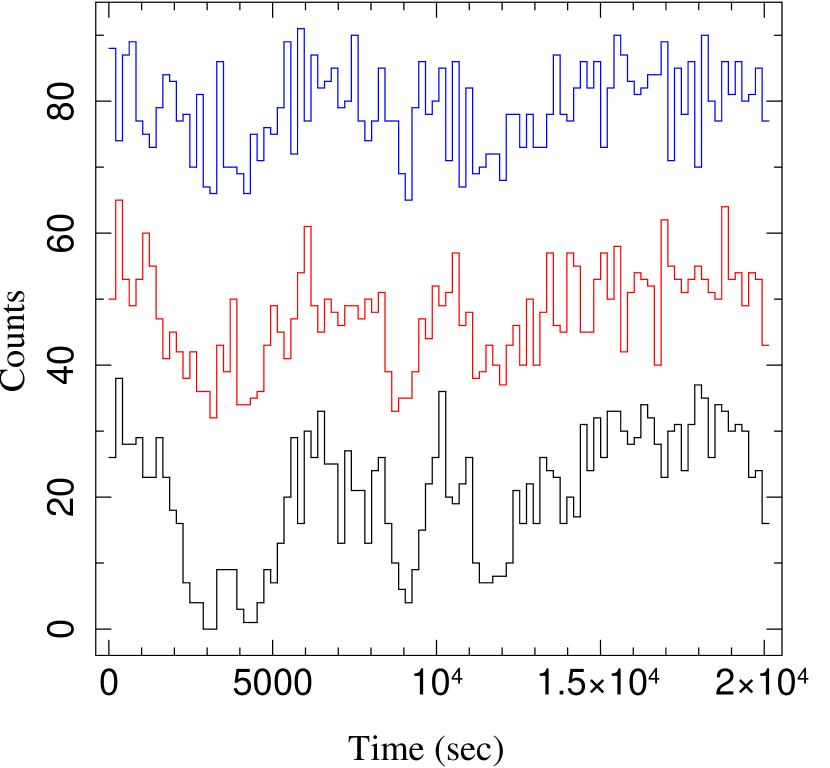
Figure 2 shows the 200 s light-curve in three energy bands 2–3.7 keV (black), 3.7–4.7 keV (red) and
4.7–8 keV (blue). The bands were chosen to have roughly equal
integrated counts and for visualization purposes
the light-curves are respectively offset by 30 and 60 counts for the middle (red)
and high (blue) band, with respect to the low (black) band. As can be seen, the variability is more evident in the
softer band, see, e.g., the large dip-like structure right before 5000 s
where the flux becomes undetectable in one 200 s bin. Generally the lower the total counts, the harder the source (due to, for example, increasing absorbing column density and/or spectral slope change).
3.2. INTEGRAL non-variability and spectrumFor all the INTEGRAL coverage shown in Fig. 1, we extracted images in the 17–50 keV energy band (one image per pointing) to search for possible source flares. Among the 121 pointings analyzed, only in three was the source detected at a single pointing level (detection significance ¿ 5). This result shows that in a single pointing IGR J171773656 is (at best) at the detection limit in IBIS/ISGRI, corresponding to about 25 mCrab in a 1 ks pointing666The higher detection significance quoted in the discovery ATel (frankowski11) is obtained by mosaicking different pointings.. Hence for the spectral analysis we decided to extract the source spectrum from the mosaics (where the detection significance is higher, using the mosaic_spec tool available in the OSA package), rather than on a single pointing basis. A second run was thus made to extract images in the 20.18–30.23, 30.23–49.6, 49.6–100.12, 100.12–200.17 keV bands (the energy boundaries are given by the response matrix itself). This spectral extraction was made only for the data that were simultaneous to the Chandra 2011 March 22 ToO (20 ks). Given the three luminosity levels detected in Chandra data (Sect. 2.1), we extracted three spectra also for IBIS/ISGRI, matching as closely as possible the non consecutive Chandra-Low, -Mid, -High times. This resulted in about 4.3 ks for INTEGRAL-Low (as opposed to 4.6 ks for Chandra-Low), about 4.3 ks for INTEGRAL-Mid (4.5 ks for Chandra-Mid) and about 9.6 ks for INTEGRAL-High (10.4 ks for Chandra-High). The small differences in final integration times are due to the fact that whereas Chandra has a continuous observation, INTEGRAL is dithering hence the slew times between re-pointing are lost. |
|||||||
The three spectra do not show any variability, IBIS/ISGRI is not capable of disentangling the three states due to the short integration time and low statistics. Alternatively, we are seeing the extension of the trend of Fig. 2, i.e., as we move to harder X-rays, the source is less variable.
Indeed the three IBIS/ISGRI spectra have comparable normalization and slope
(Low= ,
Mid= ,
High= ). Furthermore, we note that the IBIS/ISGRI spectrum reported in the discovery ATel of IGR J171773656 by frankowski11 (2011 March 15) could also be well described by a power-law with photon index 1.80.3, hence the hard X-rays did not experience a significant evolution from March 15 to March 22.
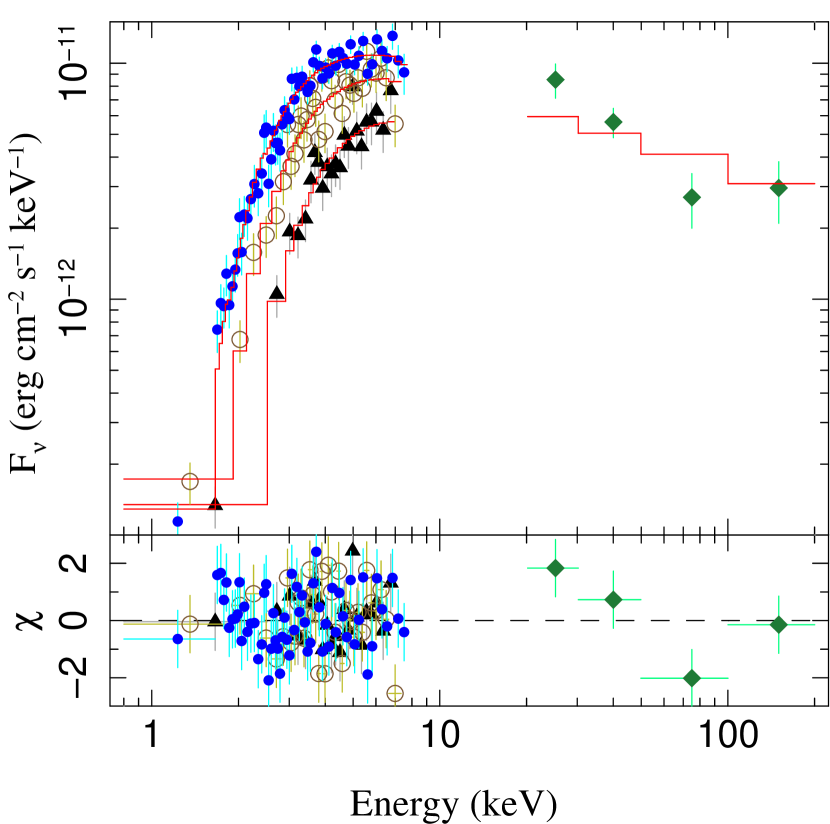
3.3. Chandra-INTEGRAL simultaneous spectraSince IGR J171773656 does not show any appreciable variability in the IBIS/ISGRI range (¿ 20 keV), to increase statistics we extract the IBIS/ISGRI average spectrum that is shown in Fig. 3, together with the three Chandra spectra (Low, Mid, High). The spectral model used to fit the combined spectrum is shown in Table 3.1. A cross-normalization constant () was allowed between Chandra-grating and INTEGRAL/IBIS and was set to 1 for Chandra and free for INTEGRAL. Beside the interstellar medium (ISM) absorbing column density fixed to , a clearly varying local column density is needed, from in Chandra-High to in Chandra-Low (higher absorption, lower Chandra rate). |
|||||||
| In the fit we have used an improved model for the absorption of X-rays in the ISM by wilms00 (so-called tbabs). Such a model results in higher column densities with respect to, e.g., the wabs model by morrison83. Indeed in the earlier ISM absorption models, the abundances assumed for the ISM were the solar ones, while more abundance measurements outside the solar system showed that the total gas plus dust ISM abundances are actually lower than the solar abundances. Hence with this correction, a higher column density is needed for a given spectrum (wilms00, and references therein). For this reason, the absorbing column density of paizis11, which was determined from solar abundances, differs from the one given here. | |||||||
During the fitting process it became clear that variability of
alone would not be enough to explain the Chandra variability.
Specifically, we noted that the spectral models that let free the neutral column density alone left
positive residuals in the 0.8–3 keV band, especially during the most absorbed phase.
Though this soft excess could
be modeled in a number of ways, utilizing a partial covering fraction seems
a natural hypothesis. These factors, although small
(Chandra-Low =0.015 and Chandra-Mid =0.013)
improved the by 12.
was not applied to IBIS/ISGRI (¿ 20 keV).
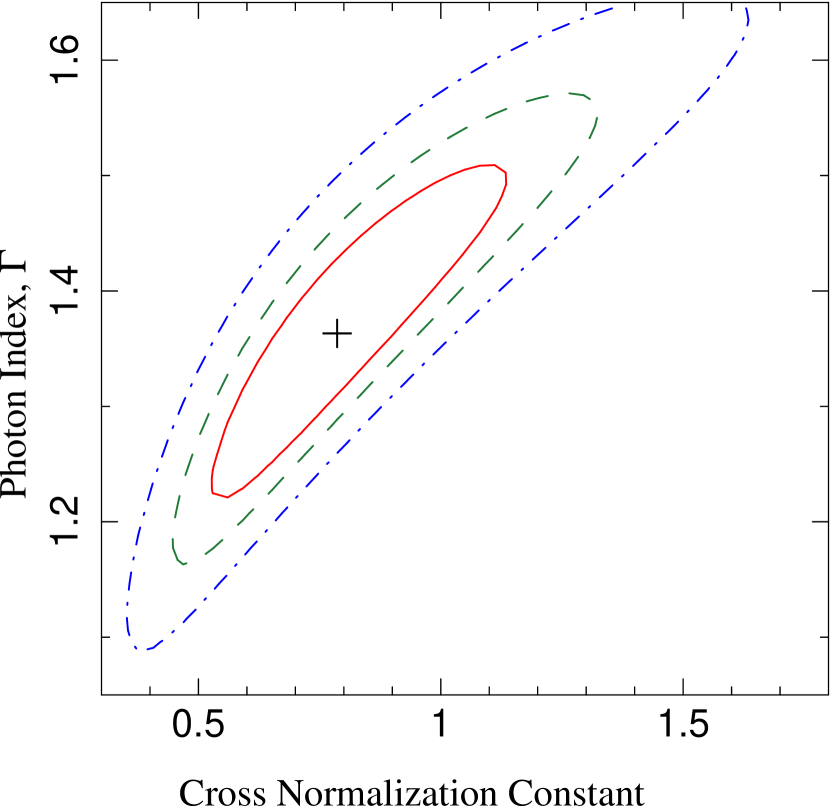
Given that the spectral slope does not show dramatic changes neither in the
already discussed INTEGRAL/IBIS spectra, nor in the Swift ones (see next
Section), in our fit the power-law photon index was constrained to be the same for all data-sets, letting the soft X-ray flux variability be explained by intrinsic and (slight) covering. Fig. 4 shows that care has to be taken for the final value of the spectral slope since it clearly depends on the Chandra-INTEGRAL cross-normalization. We note that trying to describe the broad-band data with a variable slope and fixed column density led to a very hard spectral index, down to 0.7, and cross-normalization =0.5, i.e. the slope appeared to be too hard for IBIS/ISGRI, and its amplitude had to be halved to make the fit.
Although we cannot rule out a contribution of the spectral slope to the overall variability, we assume the simplest model (fixed , variable local ). Finally we note that a cut-off power-law is not strongly preferred (DoF=126.8/109), leading to an unconstrained cut-off energy of
Ec ¿ 34 keV.
3.4. Swift position and average spectrumThe position of IGR J171773656 determined from the summed image of the whole Swift campaign is =17h 17m 42s.4, =36∘ 56′ 03.6′′ with a formal uncertainty estimated to . We note that in the first Swift observation the image of IGR J171773656 was distorted by a chip gap, causing an offset in the first Swift position reported by Zhang et al. (2011) and the position reported here. Our inferred Chandra and Swift positions are consistent (2.8′′ away). |
|||||||
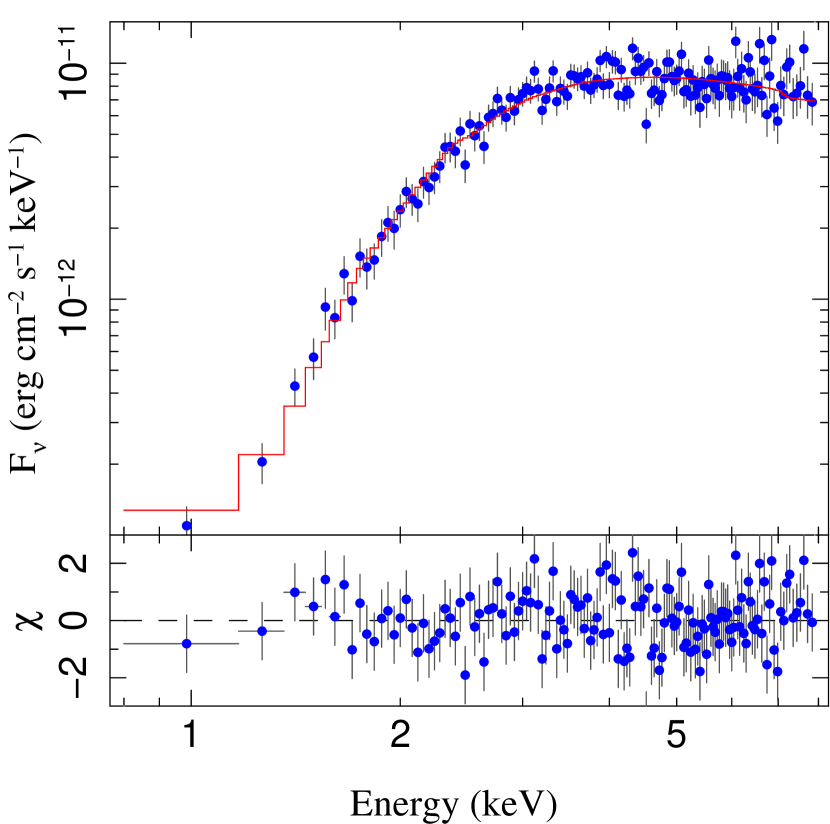
| A spectral analysis of the observations shown in Fig 1 has been performed. As for the INTEGRAL long-term data, a detailed analysis and discussion of the Swift results is out of the scope of the paper. The spectra of the Swift/XRT data alone can be well described with an absorbed power-law throughout all the monitoring shown in Fig 1. The flux variability is less than a factor of two, the spectral slope is constant within 90% error bars, while there seems to be an increase in the absorbing column density in the last Swift point of Fig 1, just after our Chandra observation (i.e., the last point is not within 90% error bars, but still within 99%). To have a global spectral view of the Swift results, since IGR J171773656 does not show any significant variability in the Swift data, we co-added the single available spectra and fit the overall Swift spectrum (total exposure of about 16 ks) using the same model structure of Section 3.3. We obtain a local absorbing column density =, =, covering factor = and absorbed 2–8 keV flux F=(4.40.1) (141.4/141 DoF). The average spectrum and fit is shown in Fig 5. | |||||||
|
|||||||
We emphasize that an accurate comparison cannot be done without a further investigation in the Swift, Chandra and INTEGRAL cross-normalization constants. Even within the Swift data alone, in order to establish a solid variability in the absorbing column density, a deeper study is required, e.g. selecting different count-rate states from finer binning light-curves, extracting average spectra and comparing them, as done for Chandra in this work.
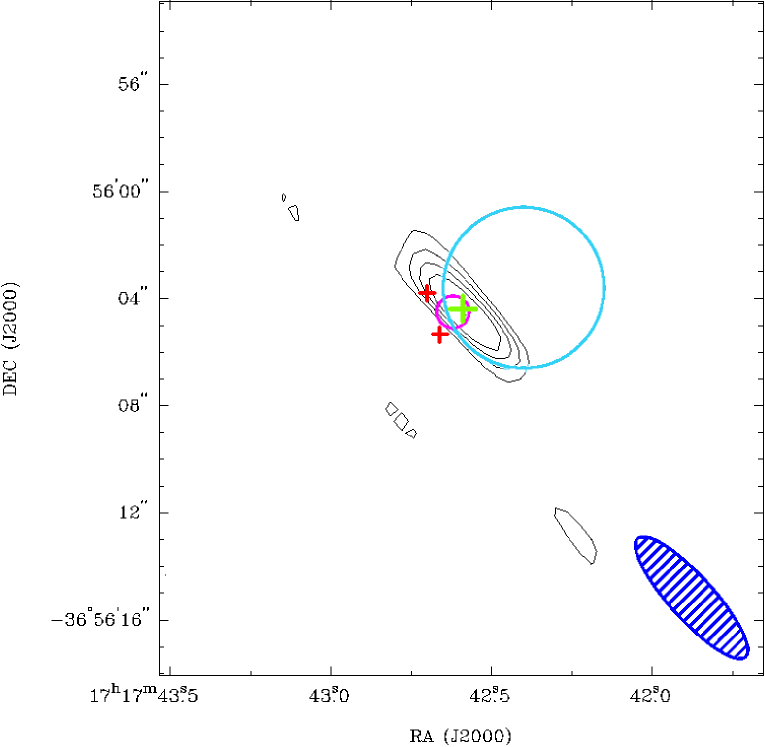
3.5. RadioFig. 6 shows the obtained radio map using the combined ATCA observations of IGR J171773656 at 5.5 and 9 GHz. Contours are at 3, 3, 4, 5, and 6 times the r.m.s. noise level of 48 Jy/beam. The synthesized beam (in the lower right corner) is 6.0′′ x 1.6′′, with the major axis at a position angle of 42.3∘. The ATCA data indicate the presence of a single radio source within the Chandra X-ray error circle with measured flux densities of 0.240.06 mJy at 5.5 GHz and 0.200.06 mJy at 9 GHz. The, poorly constrained, spectral index obtained is =0.79. |
|||||||
The most accurate localization of the radio counterpart is obtained by combining the two frequency data-sets, giving a location of the radio source of =17h 17m 42s.59, =
36∘ 56′ 04.4′′ (0.5′′, 1 positional uncertainty). Given its location
coincident with the Chandra one (0.37′′ away, Fig. 6), it likely corresponds to the radio counterpart of IGR J171773656, though variability at radio frequencies would be needed to clearly establish this association.
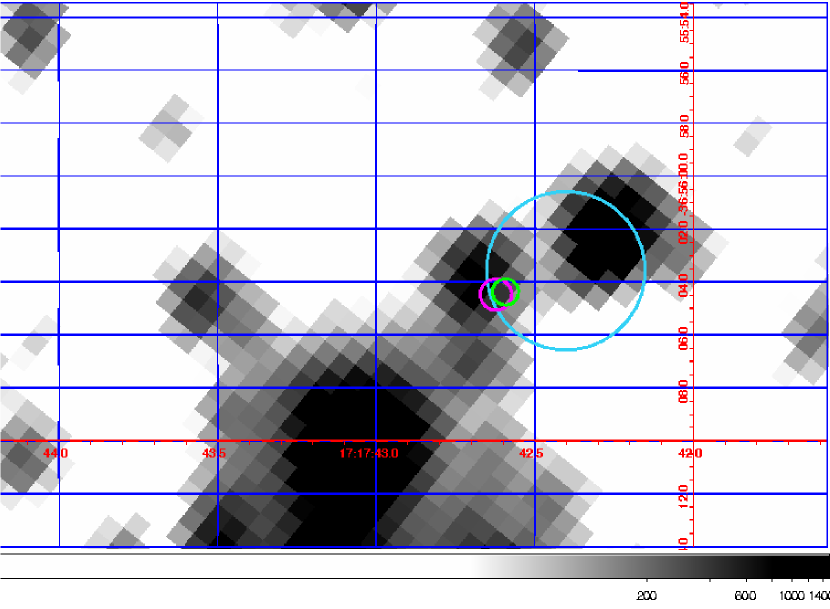
3.6. Near InfraredThe final averaged image of the field of view around IGR J171773656 is shown in Fig. 7 and displays sources down to mag. The closest visible star to our obtained Chandra position, visible in the figure, is the already mentioned 2MASS J171742693656039 that seems to be blended with a weaker source. This blended doublet is present both in recent (2011 March 27, this paper and 2001 March 20, Torres et al., 2011) and archival NIR maps (April and October 2010, Rojas et al., 2011). As already stated, the overall 90% uncertainty circle of Chandra X-ray absolute position has a radius of 0.6′′, while the 99% limit on positional accuracy is 0.8′′ with the worst case offset being 1.1. 2MASS J171742693656039 is 1.05′′ away from our position while the weaker source is 0.9′′. These separations are very small and they may not rule out categorically the association to either source. However, assuming that the single radio source mentioned in Section 3.5, compatible with Chandra position (0.37′′ away), corresponds to the right counterpart, then the radio position would also tend to rule out 2MASS J171742693656039 and the faint infrared star. Furthermore, as already pointed out by torres11 even taking the Swift absorption that is lower than Chandra-INTEGRAL one, would lead to ()6 that is higher than what is obtained for the blended sources (torres11; rojas11). It is reasonable to conclude that no IR source is visible either in the 0.6′′ Chandra position error indicated by the green circle, or in the 0.5′′ ATCA circle (in red). 4. DiscussionIn order to investigate the nature of IGR J171773656, we note that IGR J171773656 is located in the Galactic plane at (l,b)=(350∘.1, 0∘.51). Its X-ray emission together with its quasi-simultaneous radio emission, suggest that we are dealing with an X-ray binary, rather than with an AGN seen through the Galactic plane. From our least absorbed spectrum in Table 1, we obtain for the un-absorbed fluxes, relative to Chandra normalization, F=7.5 and F=1. Using the relation found by merloni03 that defines a ”fundamental plane” in the three-dimensional (L, LR, M) space, and our quasi-simultaneous X-ray (un-absorbed 3–9 keV) and radio emission, we see that we would need to place the source at about 100 Mpc to obtain a 3–9 keV luminosity of , obtaining an estimated mass of about 4.4 which is too low for an AGN. Placed at 1 Gpc, the source would have a luminosity as high as LX, still not reaching (4.7 ), which is extremely unlikely for an AGN scenario. |
|||||||
| On the other hand, considering a binary at a distance of 8 kpc would result in an un-absorbed luminosity L=5 and L=7 which is compatible with an X-ray binary luminosity. | |||||||
| Although the Chandra observation occurred already in the declining phase of the outburst, its flux is comparable to the peak seen by Swift (see Fig.1), hence IGR J171773656 likely belongs to the so-called class of Very Faint X-ray Transients (VFXT), i.e., transients showing outbursts with low peak luminosity 1034–1036 erg s-1 in 2–10 keV (wijnands06).777Indeed even considering the Swift peak flux according to zhang11 (occurring on MJD 55636.8), we obtain a non absorbed F=8.2, leading to L=6 at 8 kpc. | |||||||
VFXT are believed to be the faintest known accretors, and are very likely a non-homogeneous class of
sources. It is likely that most of them are
neutron stars and black holes accreting matter from a low mass
companion (wijnands06) and it has been found that a significant fraction of them
(1/3) have exhibited type-I X-ray bursts (delsanto2010, and references therein).
This is currently not the case for IGR J171773656, and the black hole possibility, though more difficult to infer, is still open (see Section 4.2).
4.1. LMXB or HMXB?In order to speculate over the nature of the companion (hence high-mass X-ray binary, HMXB, versus Low-mass X-ray binary, LMXB), we have to consider the limits obtained in quiescence, so that we are not contaminated by the disc X-ray to NIR re-processing, as it would be the case for an LMXB. The archival NIR maps studied by rojas11 show that no source was detected within either the Chandra or the ATCA radio error circles in April-October 2010 maps, down to a limit of Ks18.0. Using the relation of prehdel95, a visual extinction of AV=39.1 magnitudes is derived from =7 (Table 3.1). Assuming a spectral type supergiant Ib (B0.5) with MV = 6.8 and -- (ducati01) (i.e., an HMXB), a distance of 8 kpc, and using the extinction law by cardelli89, AK/AV=0.114, we obtain an estimated observed K=12.92 that would have been detected in the maps by rojas11 (the NIR emission from an HMXB does not vary dramatically due to its bright stellar emission). Hence in the case of an HMXB hosting a supergiant, to reach the K18.0 limit we would need to place the source at about 83 kpc or more. Given our un-absorbed X-ray flux (F=1), this would result in an X-ray luminosity of about L81038 erg s-1 from an HMXB placed outside the Galaxy. This scenario, though not impossible, is highly unlikely since such luminosities are too high for HMXBs with the compact object accreting stellar wind. |
|||||||
| On the other hand, Be stars (representing the majority of companions in HMXB systems) are main sequence stars of spectral type between 09 and B2, with a spread in absolute magnitude of nearly 1 mag (see, e.g., allen84). Be X-ray binaries, although dimmer than supergiants, are usually bright NIR sources. The Be phenomenon itself, with the presence of a decretion disk due to fast stellar rotation close to disruption, increases the luminosity of the source, at a level of about K=0.25 mag (dougherty94). To give an example, a normal B0V star (absolute magnitude MV=4.1) with apparent K18 mag and AV = 39.1 mag would be at nearly 25 kpc, and the disc emission would have the effect of increasing its distance of nearly 3 kpc, placing this star at nearly 28 kpc. This is a substantial distance for instance in comparison with the faintest (=15.75) and furthest (¿ 8.5 kpc) known candidate BeXRB in the Galaxy, described in zurita08. In general however, distances of HMXBs, both hosting Be and supergiant stars, are usually of the order of a few kpc, due to their lower intrinsic X-ray luminosities than LMXBs, and they are distributed mainly towards tangential directions of the Galactic arms (grimm02). | |||||||
| Furthermore, direct accretion through stellar wind — common in HMXBs — should prevent the formation of strong and coherent jets, while the detection of radio emission from IGR J171773656 suggests the presence of ejection phenomena, and therefore an LMXB nature filling its Roche Lobe and forming an accretion disk.888One could suppose the case of Cyg X1, which exhibits both an accretion disk and stellar wind, but this source is the only example known in our Galaxy of BH with Roche-lobe overflow in a supergiant X-ray binary. In general, HMXBs strictly filling their Roche-Lobe are likely not observable, since the mass transfer is highly unstable and the accretion should only last for a few thousand years. Instead, there are HMXBs exhibiting Beginning Atmospheric Roche Lobe Overflow, where the massive star does not fill its Roche Lobe, but the stellar wind follows the Lagrange equipotentials, and accumulates, forming an accretion disk (bhattacharya1991). This situation is more stable, but still rare due to the required configuration of stellar radius, orbital distance and mass ratio, since we know only 3 such systems in total, hosting neutron stars: LMC X4, Cen X3 and SMC X1. | |||||||
All these arguments suggest that the HMXB nature can be reasonably ruled out, pointing towards an LMXB
nature for IGR J171773656. Indeed, assuming a spectral type main sequence K5 star with MV=7.3 and -=2.66 mag (ducati01) (i.e., an LMXB) and a distance of 8 kpc, we would obtain K23 mag, compatible with the non-detection in rojas11, and an X-ray luminosity of about L=71036 erg s-1 that, though dim, is not exceptional for the LMXB outburst luminosities.
4.2. A low-mass X-ray binary: geometry and compact object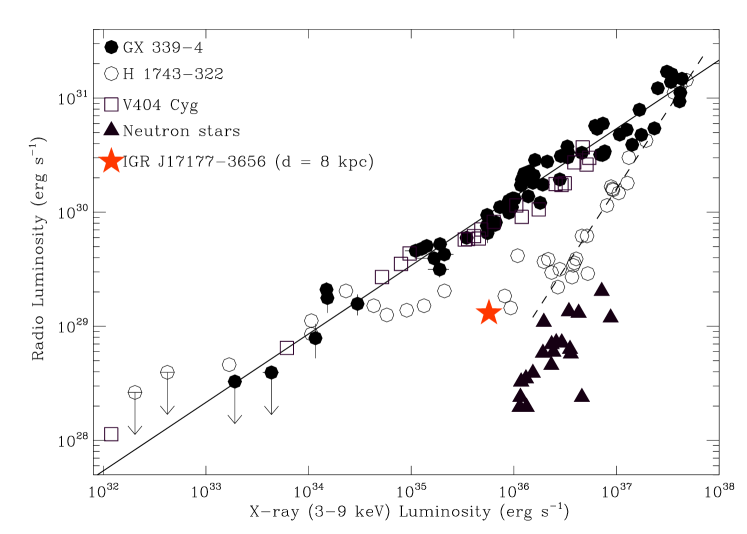
Adding the local and Galactic (ISM) absorbing column densities of Table 1, we observe that we obtain a column density up to about ten times more than the Galactic average value expected in the source direction, 1.3 cm-2 (kalberla05). An LMXB does not have an important wind from the companion, that is generally an old K-M type star, but if it is seen at a high inclination (¿ 60∘) it will appear as heavily absorbed due to the material that gets into the line of sight (disc, blob of impact of the accreting matter onto the disc, the companion itself, etc). This is the case for the dipping, eclipsing or so-called ”coronal” sources, i.e., sources that exhibit dips, total or partial eclipses in the soft X-ray spectra (e.g. X1822371, EXO 0748676, 4U 1624490; parmar86; white82; xiang2009; diaz06). |
|||||||
| In our case, it is difficult to state if we are in the ”pure-dipper” scenario (inclination between 60 and 75 degrees) or at higher inclinations (eclipsing or coronal source). We do not see any total eclipse in our data (zero flux) but our soft X-ray observations are either continuous 20 ks (5.5 hrs, Chandra) or quick snapshots that add up to about 15 ks (Swift) which is a small part of a typical LMXB orbital period (typically below 15–20 hrs). For such a dim source, we would need to integrate many orbital periods to observe a modulation (dip, eclipse etc), but what is clear is that the environment we are observing is not ”clean” (high ) and it is irregular and patchy (the three rate levels in Chandra are not contiguous in time). | |||||||
| We note that the non-variability in the IBIS/ISGRI spectrum together with the absence of total eclipses (albeit the short coverage) could suggest that the Comptonizing region (responsible for the photons above 20 keV) would be extended and wider than the blocking material. Such ”coronal” sources are usually known as Accretion Disc Corona sources (ADC), high inclination systems where the accretion disc completely blocks the line of sight to the central source at all orbital phases, but that can still be observed because the corona allows X-rays to be scattered into the line of sight. If this is the case for IGR J171773656, then the ”true” X-ray flux could be higher. This is very similar to what obtained by xiang2009 on the high inclination LMXB, so-called ”Big Dipper”, 4U 1624490, based on a Chandra grating observation over the 76 ks binary orbit of the source. The continuum spectrum could be modeled using a single 2 power-law partially covered by a local absorber of column density 8 besides the Galactic one, similarly to IGR J171773656. Unlike xiang2009, our data do not allow us to constrain discrete lines in the spectrum (due to the short exposure and dim source), but we can speculate that the scenario for IGR J171773656 could be similar to the Big Dipper case for which xiang2009 have shown that X-ray variations are predominantly driven by changes in obscuration, rather than intrinsic variation of the components. | |||||||
| LMXBs are known to produce radio emission, be they hosting a black hole or a neutron star. Though black hole binaries are known to be more radio-loud, there are clearly some broad similarities in their X-radio coupling, such as the association between X-ray spectral states and the presence of radio emission (fender06; corbel03; coriat11; migliari06; paizis06). Radio emission can result either from a powerful compact jet in the hard state, or from relativistic discrete ejections at spectral state transitions (from hard intermediate to soft-intermedite state, e.g., fender06). While discrete radio ejections show a radio spectrum with spectral index , compact jets have a flat or slightly inverted spectrum (i.e. ). In our case, the poorly constrained =0.79 does not allow us to firmly establish the nature of the radio emission, however since IGR J171773656 has not shown any important spectral transition but stayed in the hard state, it is likely that the radio emission is associated with compact jets. | |||||||
| The quasi-simultaneous observation and detection of IGR J171773656 with Chandra and ATCA is very important because besides leading to a constrained source position, it basically rules out the AGN and HMXB nature of the source. Indeed IGR J171773656 fits
well in the LMXB scenario also from the radio emission point of view (regardless of the inclination).
Figure 8, adapted from coriat11, shows the radio luminosity against the 3–9 keV un-absorbed luminosity for a sample of black hole candidate LMXBs in the hard state (H 1743322, GX 3394 and V404 Cyg) and atoll neutron star LMXBs in the island
state (Aql X1 and 4U 172834). The line is the fit to GX 3394 from Corbel et al. (in preparation).
IGR J171773656 is also shown in the plot. The assumed distance is 8 kpc with an un-absorbed X-ray flux of
F=7.5 (obtained from the least absorbed case) and a radio flux of F(radio)=0.2 mJy. IGR J171773656 seems to follow the behavior of the black hole candidate LMXB H 1743322 at low fluxes,
when it starts to join the standard correlation of GX 3394 (corbel11; coriat11). This could possibly suggest
that IGR J171773656, that appears also to be too radio-bright to be a neutron star LMXB, is a black hole candidate in the hard
state. We note however that we cannot firmly exclude the neutron star nature of the compact object based on
the location of IGR J171773656 in Fig. 8 alone, since in the aforementioned ADC scenario the observed
flux (hence luminosity) could be underestimated. A higher ”true” X-ray flux would indeed move the source
towards the neutron star populated area.
We thank the Chandra team for their rapid response in
scheduling and delivering the observation,
as well as the INTEGRAL Science Data Center for their quick and efficient
sharing of INTEGRAL results.
|
|||||||
| Partly based on observations with INTEGRAL, an ESA project with instruments and science data center funded by ESA member states, Czech Republic and Poland, and with the participation of Russia and the USA. This publication makes use of data products from the Two Micron All Sky Survey, which is a joint project of the University of Massachusetts and the Infrared Processing and Analysis Center/California Institute of Technology, funded by the National Aeronautics and Space Administration and the National Science Foundation. IRAF is distributed by the National Optical Astronomy Observatory, which is operated by the Association of Universities for Research in Astronomy (AURA) under cooperative agreement with the National Science Foundation. The Australia Telescope is funded by the Commonwealth of Australia for operation as a national Facility managed by CSIRO. | |||||||
| AP, MDS and PU acknowledge financial contribution from the agreement ASI-INAF I/009/10/0. MDS acknowledges the grant from PRIN-INAF 2009 (PI: L. Sidoli). This work was supported by NASA Grant GO1-12054X and partly supported by the Centre National d’Etudes Spatiales (CNES), based on observations obtained with MINE: the Multi-wavelength INTEGRAL NEtwork. JW and SC acknowledge support from European Community’s Seventh Framework Programme (FP7/2007-2013) under grant agreement number ITN 215212 ”Black Hole Universe”. JW acknowledges support also from the Bundesministerium für Wirtschaft und Technologie through Deutsches Zentrum für Luft- und Raumfahrt Grant 50 OR 0801. | |||||||