Chandra High Energy Grating Observations of the Fe K Line Core in Type 2 Seyfert Galaxies: A Comparison with Type 1 Nuclei
Abstract
We present a study of the core of the Fe K emission line at keV in a sample of type II Seyfert galaxies observed by the Chandra High Energy Grating (HEG). The sample consists of 29 observations of 10 unique sources. We present measurements of the Fe K line parameters with the highest spectral resolution currently available. In particular, we derive the most robust intrinsic line widths for some of the sources in the sample to date. We obtained a weighted mean FWHM of for 8 out of 10 sources (the remaining sources had insufficient signal-to-noise). From a comparison with the optical emission-line widths obtained from spectropolarimetric observations, we found that the location of Fe K line-emitting material is a factor of times the size of the optical BLR. Furthermore, compared to 13 type I AGNs for which the best Fe K line FWHM constraints were obtained, we found no difference in the FWHM distribution or the mean FWHM, and this conclusion is independent of the central black hole mass. This result suggests that the bulk of the Fe K line emission may originate from a universal region at the same radius with respect to the gravitational radius, on average. By examining the correlation between the Fe K luminosity and the [O IV] line luminosity, we found a marginal difference in the Fe K line flux between type I and type II AGNs, but the spread in the ratio of to is about two orders of magnitude. Our results confirm the theoretical expectation that the Fe K emission-line luminosity cannot trivially be used as a proxy of the intrinsic AGN luminosity, unless a detailed comparison of the data with proper models is applied.
Subject headings:
galaxies: active – line: profile – X-rays: galaxies1. INTRODUCTION
Both type I and type II active galactic nuclei (AGN) are known to exhibit a narrow (FWHM ) Fe K fluorescent emission line at keV in their X-ray spectrum (e.g. Sulentic et al. 1998; Lubiński & Zdziarski 2001; Weaver, Gelbord, & Yaqoob 2001; Perola et al. 2002; Yaqoob & Padmanabhan 2004 (hereafter YP04); Levenson et al. 2002, 2006; Jiang et al. 2006; Winter et al. 2009; Shu, Yaqoob & Wang 2010, hereafter paper I). The line profile of the Fe K core is important for probing its origin and it can provide unique information on the dynamics and physical state of the line-emitting region (Yaqoob et al. 2001, 2003, 2007). While it is widely accepted that the narrow Fe K line cores are produced in cold, neutral matter far from the nucleus, the exact location and distribution of the line-emitting gas still remain uncertain (see Paper I, and references therein). Nandra (2006) first examined the relation between the Fe K and optical H line widths, which can potentially give a direct indication of the location of the Fe K line-emitting region relative to the optical broad-line region (BLR). However, the results were ambiguous, and the data allow for an origin of the Fe K line anywhere from the outer regions of an accretion disk, the BLR, and a parsec-scale torus. Meanwhile, Bianchi et al. (2008) reported a meaningful comparison between the Fe K and H line widths in NGC 7213, and found the FWHM of both lines are consistent with each other (2500 km s-1), implying a BLR origin of the Fe K emission line. Using the high-energy grating (HEG) on the Chandra HETGS (High Energy Transmission Grating Spectrometer, see Markert et al. 1995), which affords the best spectral resolution currently available in the Fe K band (at 6.4 keV is 39 eV, or 1860 km s-1 FWHM), in Paper I we presented a more thorough and comprehensive study of the Fe K line core emission in a large sample of type I Seyfert galaxies (see also YP04). We measured the intrinsic width of the narrow Fe K line core and obtained a weighted mean of FWHM = 2060 230 km s-1. A comparison with the optical emission-line widths suggested that there may not be a universal location of the Fe K line-emitting region relative to the BLR, consistent with the results of Nandra (2006). Our results in fact showed that the location of the Fe K line emitter relative the BLR appears to be different from source to source.
However, one must be cautious in explaining the origin of the narrow Fe K core, especially for measurements made with instruments that have lower spectral resolution than the Chandra HETGS (e.g., see Liu et al. 2010 for NGC 5548). The uncertainty in the intrinsic line width measurements is usually large, and part of the narrow component may have a contribution from an underlying broad line in some (if not all) unobscured AGNs (e.g., Lee et al. 2002; YP04; Nandra 2006). However, in cases when the narrow Fe K core is unresolved even with the Chandra HEG, such contamination is not an issue, and from the upper limits on the line widths we can place strong constrains on the origin of the intrinsically narrow Fe K line core (see Paper I). In the paradigm of the unification model (Antonucci 1993), the narrow Fe K line emission in type II AGNs is expected to be produced in the same material as in type I nuclei. Therefore, one of the things that we would like to know is whether there is any systematic difference in the origin of the Fe K line in type I and type II AGNs. In addition, for a given geometry and model, one would expect a particular relation between the equivalent width (EW) of the Fe K line, , and the orientation of line-emitting structure (e.g., Murphy & Yaqoob 2009; Ikeda, Teramshima, & Awaki 2009; Yaqoob et al. 2010; Brightman & Nandra 2011). Thus a comparison of Fe K emission-line luminosities and EWs in type I AGNs versus type II AGNs can potentially offer basic tests of some of the predictions of AGN unification scenarios.
In this paper, we present a study of the narrow Fe K emission line in a sample of type II AGNs observed with the Chandra HETGS. The observations and spectral fitting are described in Section 2. In Section 3, we present the results for the properties of the core of the narrow Fe K emission line and their implications. In Section 4, we summarize our results and findings. Throughout this paper, we adopt a cosmology of , and H km s-1 Mpc-1.
2. OBSERVATIONS AND SPECTRAL FITTING
Our study is based on Chandra HETGS observations of AGNs, which were in the Chandra public archive as of 2010 Aug 1. In Paper I, we presented a study of the properties of the Fe K line emission in a sample of predominantly type I AGNs. In this paper, we expand the sample of AGN in Paper I to include type II sources by simple modifications of the selection criteria. One is to lift any constraints on the column density (i.e., there now no selection on column density), and the other is to lower the acceptance threshold for the total number of counts in the HEG spectra. The sample in Paper I was composed of the least complex spectra due to a maximum column density criterion, and a threshold of a total number of HEG counts of 1,500. The reader is referred to Paper I for the details of the remaining selection criteria, which were not changed. Lowering the signal-to-noise threshold was necessary because the larger equivalent widths of the Fe K line for heavily absorbed sources result in useful constraints for sources that are weaker than those with smaller equivalent widths. With the two modified selection criteria, we end up with a sample that now includes both type I and type II AGN, as well as intermediate types. The present paper reports on the results of an analysis of 29 observations of the 10 sources in the new, larger sample that were not included in Paper I. Not surprisingly, the sources in the present paper are all classified as type II in NED (including NGC 1275, also known as 3C 84 and Perseus A, which lies at the center of a rich cluster of galaxies, and has a peculiar optical emission-line spectrum with two distinct narrow emission-line systems, e.g., Conselice et al. 2001).
We note that the relationship between the optical classification of an AGN as type I to type II and the X-ray absorption properties is not always clear cut, so the sample in Paper I included some AGN that were not type I. In particular, Paper I included NGC 5506, MCG 5-23-16, and NGC 2110, which are type 1.9 AGN. When comparing the results for the type II AGN in the present paper, we simply refer to the intermediate Seyfert types in Paper I as type I for convenience (this is more of a reflection of the relative simplicity of the X-ray spectrum). We note that since the publication of Paper I, 15 new observations of two of the AGN in Paper I (NGC 4051 and Akn 564) have been made public. The new observations have been analyzed and this information has been incoorporated into the comparisons between the results in Paper I and the present paper.
The Chandra HETGS consists of two grating assemblies, a High-Energy Grating (HEG) and a Medium-Energy Grating (MEG), and it is the HEG that achieves the highest spectral resolution. The MEG has only half of the spectral resolution of the HEG and less effective area in the Fe K band, so our study will focus on the HEG data. Out of the 10 unique sources, 8 were observed more than once: namely NGC 4945, the Circinus galaxy, NGC 6240, NGC 1068, Centaurus A, NGC 4388, NGC 4258 and NGC 1275. The remaining two sources that were observed only once are NGC 4057 and Mrk 3. In order to obtain the highest precision measurements of the Fe K emission-line parameters, in particular for the width of the line, we concentrate on the analysis of the co-added spectra for the sources with multiple observations. We checked that for sources observed more than once, the count rates variations are very small (less than 10%). Therefore, in this study we report only the results of time-averaged spectroscopy. The mean HEG counts rates ranged from ct/s for the weakest source (NGC 4945) to ct/s for the brightest source (Centaurus A). The exposure time ranged from ks to ks per observation, and the largest net exposure time from summed data from observations of the same source was ks (NGC 1068). Details of the 29 observations used in this paper are given in Table 1.
The Chandra data for the sample were reduced and HEG spectra were made as described in Yaqoob et al. (2003) and YP04. We used only the first orders of the grating data (combining the positive and negative arms). Further details of all of the observations can be found in the Chandra data archive at http://cda.harvard.edu/chaser/. Higher-level products, including lightcurves and spectra for each observation can be found in the databases HotGAS (http://hotgas.pha.jhu.edu), and TGCat (http://tgcat.mit.edu/). Background was not subtracted since it is negligible over the energy range of interest (e.g. see Yaqoob et al. 2003). Note that the systematic uncertainty in the HEG wavelength scale is ( eV) at 6.4 keV 111http://space.mit.edu/CXC/calib/hetgcal.html.
The spectra were analyzed using the spectral-fitting package XSPEC (Arnaud 1996). Since we are interested in utilizing the highest possible spectral resolution available, we used spectra binned at , and this amply oversamples the HEG resolution ( FWHM). The -statistic was used for minimization. All model parameters will be referred to the source frame. Our method is simply to fit a simple absorbed continuum plus Gaussian emission-line model over the 3–10 keV band for each spectrum, to avoid the influence of the complex absorption and many soft X-ray emission lines below 3 keV (e.g., Levenson et al. 2006), while providing enough high-energy coverage to fit the continuum. Galactic absorption was not included for any of the sources because such small column densities have little effect above 3 keV. For NGC 4258 and NGC 1275, the Fe K line was only weakly detected: decreased by 3.4 and 2.0, respectively, when a narrow, unresolved emission line at 6.4 keV was added to the continuum. These figures correspond to detections at less than 95% confidence, and less than 90% confidence for NGC 4258 and NGC 1275 respectively (for the addition of one free parameter). For these two sources we were therefore only able to obtain constraints on the line flux (and not on the line centroid energy and line width), so the Gaussian model had one free parameter. Note that a significant Fe K emission line has been detected in NGC 4258 by and XMM-Newton (Yamada et al. 2009; Reynolds et al. 2009), with EW= eV and EW= eV, respectively, which is consistent with the upper limit of 32 eV (at 90% confidence) obtained by the Chandra HEG.
Thus, except for the two cases mentioned above, for the remaining spectra the Gaussian model component had three free parameters and there were a total of six free parameters in the model, namely the power-law continuum slope (), the overall normalization of the power-law continuum, the column density, , the centroid energy of the Gaussian emission-line component, , its flux, , and its width, . The approach of using an oversimplified continuum model is necessitated by the limited bandpass of the HEG data ( keV) but since we are interested in the narrow core of the Fe K emission line, at the spectral resolution of the HEG, this is not restrictive. As we will show in Section 3.1, in cases when the Fe K line was significantly detected, its centroid energy as well as its intrinsic width can be well-measured by the Chandra HEG. We note that even for cases where we can obtain a reliable measure of the Fe K line FWHM, the true line width may be less than the FWHM deduced from our simplistic model-fitting because there may be blending from an unresolved Compton-shoulder component (e.g., Matt 2002; Yaqoob & Murphy 2011). However, this artificial broadening is not an issue for the line parameters of the high signal-to-nosie ratio HEG observations reported here. For example, although Circinus has one of the most robust detections of a Compton-shoulder component (e.g., Bianchi et al. 2002), it has the smallest FWHM measure among the HEG sample. Obviously, use of such an empirical model means that we should not assign a physical meaning to and . We emphasize that our approach in the present paper is to perform a very simple empirical analysis in order to obtain robust measurements of the basic narrow Fe K line core parameters that are not dependent on details of how the continuum is modeled. A realistic physical model of the continuum and the analysis of the soft X-ray spectral components is beyond the scope of this work and will be presented elsewhere.
3. RESULTS AND DISCUSSIONS
3.1. Spectroscopy in the Fe K Band
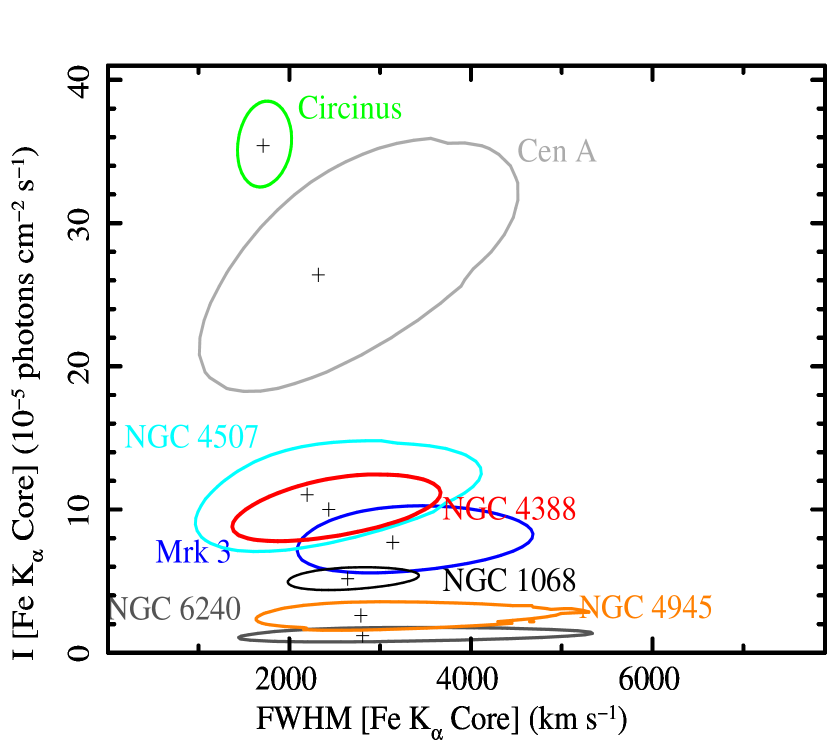
Figure 1 shows the HEG spectrum for each source in the Fe K region, corrected for instrumental efficiency and cosmological redshift. The spectra are binned at 0.01 Å, similar to the HEG FWHM spectral resolution of 0.012 Å. The statistical uncertainties correspond to 68% confidence Poisson errors, which we calculated using equations (7) and (14) in Geherls (1986) that approximate the upper and lower errors respectively. For sources which were observed more than once, the time-averaged spectra are shown. It can be seen that in some spectra, emission lines from different ionized species of Fe are evident, in addition to the narrow Fe K line at 6.4 keV, but the latter is always the strongest line. Although in the present paper we are concerned only with the Fe K line core centered at 6.4 keV, overlaid on the spectra in Fig. 1 are vertical dashed lines marking the expected positions of the Fe xxv He-like triplet lines (the two intercombination lines are shown separately), Fe xxvi Ly, Fe I K, and the neutral Fe K-shell threshold absorption-edge energy. The values adopted for these energies were from NIST2 (He-like triplet); Pike et al. 1996 (Fe xxvi Ly); Palmeri et al. 2003 (Fe I K ), and Verner et al. 1996 (Fe K edge). We emphasize that the emission from higher ionization states of Fe has little effect on the measurements of the intrinsic width of the Fe K line. For example, for NGC 1068 the spectral plot in the Fe K band shows a broad emission feature on the blue side of the Fe K line peak, which is probably due to multiple species of ionic Fe. The occurrence of highly ionized Fe emission lines in AGN X-ray spectra has been noted since the observations, and they are extensively studied recently with XMM-Newton and (e.g., Bianchi et al. 2005; Fukazawa et al. 2011). However, we can confirm from the 99% confidence contour of Fe K line intensity versus FWHM (Figure 2), that the Fe K line width is still well-constrained (less than 3500 km s-1). This conclusion is also consistent with the physical width of the narrow core of the Fe K line in the spectral plot that is apparent simply from visual inspection.
The best-fitting Fe K emission-line parameters for each spectrum are shown in Table 2. We do not give the best-fitting values of or in Table 2 because the values derived using the simplistic continuum model are not physically meaningful but are simply parameterizations. We obtained a weighted mean line-center energy of 6.3970.001 keV for the 24 observations of 8 sources. At 99% confidence (for three free parameters), none of the AGNs has a line centroid energy greater than 6.41 keV, indicating that the line-emitting matter is cold and essentially neutral, consistent with results presented in Paper I for a sample of type I AGNs. Here, and hereafter, for the calculation of the weighted mean of any quantity with asymmetric errors, we simply assumed symmetric errors, using the largest 68% confidence error from spectral fitting.
3.2. The Intrinsic Width of the Fe K Line Emission
From our spectral fits (Table 2) and the joint confidence contours of Fe K line intensity versus FWHM (Figure 2 and 3), we found that at 99% confidence, the Chandra HEG resolves the narrow component of the Fe K emission in 8 out of 10 sources. The weighted mean FWHM of the Fe K line cores is . The fact that this mean is approximately equal to the HEG FWHM spectral resolution is not indicative of a calibration bias. This is supported by the fact that the FWHM of the Fe K line in Circinus is less than the HEG FWHM at a confidence level of greater than 99%. In addition, the spectral resolution for gratings does not degrade with time because it is determined principally by spatial dispersion, and the resolution is well-established from bright Galactic sources with narrow lines (http://space.mit.edu/CXC/calib/hetgcal.html). Note that the weighted mean value is consistent with the straight mean of the FWHM, of . The measurements of the intrinsic width of the line can potentially be used to constrain the location of the medium responsible for the core of the Fe K emission line (e.g., Yaqoob et al. 2001). Comparing the Fe K line FWHM with that of the optical broad emission lines (e.g., H and/or lines) can give a direct indication of the location of the Fe K line-emitting region relative to the optical broad-line region (Nandra 2006, Bianchi et al. 2008, Paper I). To place limits on the location of the Fe K emitter relative to the BLR, we compiled from the literature the width of optical broad emission line from spectro-polarimetric observations for five sources in our sample, and the values of the H or FWHM are listed in Table 2. The near-infrared broad lines have not been taken into account in the present paper, as they are possibly produced in a region that differs from the BLR in density, and/or in the amount of extinction (e.g., Ramos Almeida et al. 2008; Landt et al. 2008). However, in cases where there is no spectropolarimetric data at all, the FWHM of near-infrared lines might still yield some useful information222 We searched in the literature and found that only one source, NGC 6240, has NIR broad-line Br measurement reported, with FWHM=1800200 km/s (Cai et al. 2010). This value is consistent with the width of the Fe K line at 99% confidence..
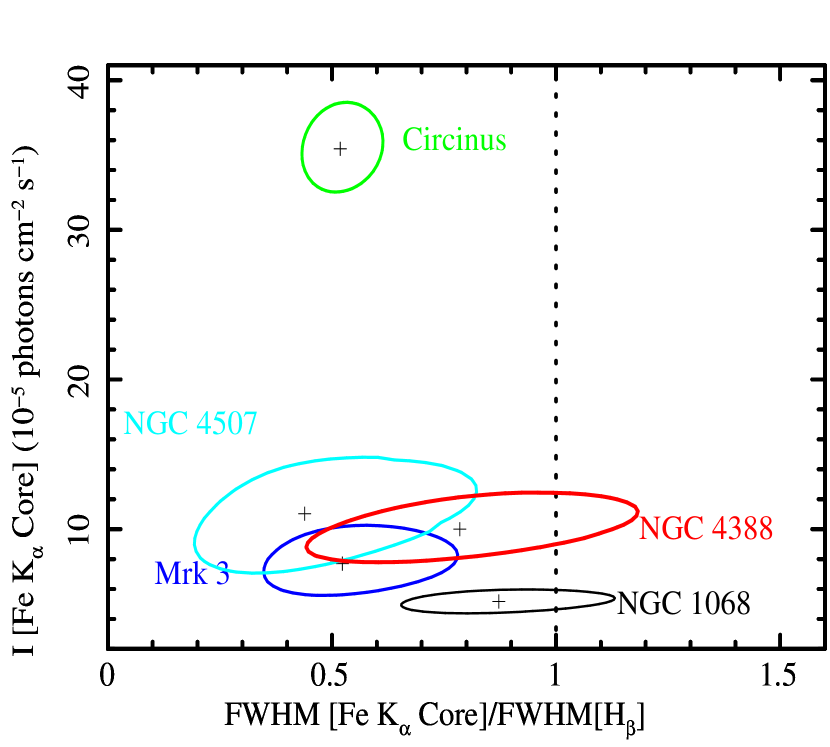
Figure 3 shows the 99% confidence contours of the Fe K line intensity versus the ratio of the Fe K FWHM to optical line FWHM. We found that at the two-parameter 99% confidence level, the FWHM ratio lies in the range of . At 99% confidence, the Fe K line widths in 3 out of 5 sources are less than that of optical lines, suggesting that the observed Fe K emission is not likely produced in a BLR where the optical lines are produced. The remaining two sources ( NGC 4388 and NGC 1068) could have consistent width for both lines. This would be expected in at least one source, NGC 4388, which is known to have significant column density variations (Elvis et al. 2004), if its BLR acts as absorber and emitter seen in the X-ray band. In fact, there is now significant evidence that the BLR may act as an X-ray absorber, like in the cases of NGC 1365 and NGC 7582 (e.g., Risaliti et al. 2005; Bianchi et al. 2009). However, if the BLR is obscured by a fully covering column density greater than ( as in the cases of NGC 4507, Mrk 3 and the Circinus ) any Fe K line component from the BLR will be greatly diminished, or undetectable. If the BLR is obscured by such a large column density, the only way it would be possible to observe an Fe K line component from the BLR is if the BLR is not fully covered. The fact that the Fe K line width of Compton-thick source NGC 1068 is consistent with that of the polarized line (within 99% errors) could be simply attributed to the large error in the Fe K line width. Alternatively, this could indicate that the heavy obscuration which blocks the BLR has comparable size with that of the BLR.
Since Keplerian velocities are inversely proportional to the square root of the orbit size, the observed distribution of the ratio of the Fe K to optical line FWHM implies that the Fe K line-emitting region size could be a factor times larger than the optical line-emitting region. We obtained a weighted mean of 0.570.05 for the ratios of the Fe K line FWHM to the optical line FWHM, corresponding to the Fe K line-emitting region being, on average, 3 times the size of BLR. However, for AGNs in general, there may be no universal location of the Fe K line-emitting region within a factor of 1–10 times size of BLR. However, as we will show later, the Fe K line emitter may be associated with a universal location in terms of gravitational radius (, where ). If the Fe K line emission has a significant contribution from the putative obscuring torus that is required by AGN unification models, our results show that the size-scale of the torus may be smaller than traditionally thought. Note that Gaskell, Goosmann, & Klimek (2008) argue that there is considerable observational evidence that the BLR itself has a toroidal structure, and that there may be no distinct boundary between the BLR and the classical parsec-scale torus.
One of the interesting things that we can investigate is whether the material responsible for producing the narrow Fe K line in type II AGNs systematically differs from that in type I objects. Of the AGNs in the sample reported in Paper I, we identified thirteen type I AGNs (including 3 moderately obscured sources with weak broad Balmer lines, formally classified as intermediate type AGNs) that provided the very best statistical constraints on the Fe K line FWHM (as indicated by the two-parameter confidence contours of line flux versus FWHM; see Figure 6 in Paper I). The weighted mean FWHM of the Fe K core is 2170220 km -1, in good agreement with the measurement for type II AGNs in the present sample. However, we found a slightly larger FWHM of the Fe K line (3620220 km -1) for type I AGNs if the straight mean is used, but as we will show below, it may be due to a bias towards the measurements with lower quality data. We show in Figure 4 the distribution of Fe K line FWHM for the current sample (solid line), compared with the thirteen type I AGNs in Paper I (dashed line). It can be seen that both histograms are not Gaussian and are not strongly peaked. In addition, we found that the measurement of the FWHM in one AGN (namely MCG -6-30-15) deviated significantly from the distribution of the rest of the sources. From our empirical analysis, we obtained FWHM=11880 km s-1 (see Paper I) for this object, and the corresponding 90% confidence lower limit (for three free parameters) is 6000 km s-1. Note that MCG -6-30-15 has the strongest and broadest Fe K line yet observed in an AGN. The larger FWHM obtained from our empirical analysis could be attributed to the Fe K core from underlying disk-line component, and/or a complex continuum (e.g., Miller et al. 2008). Note that Young et al. (2005) analyzed the Chandra HEG spectrum by using more complex models including both disk-line and narrow Fe K core emission, and obtained an FWHM 4700 km s-1 for the narrow component, which is consistent with those from the other sources in our sample. However, as the narrow Fe K line EW is relatively low (60 eV, see Paper I), we cannot tell whether the line profile is affected by the complex continuum, or whether it is intrinsically broader than the other AGNs . Future X-ray missions, such as Astro–H, which has much higher spectral resolution, will help to measure the true profile of the narrow Fe K emission line in this object. Even considering the one AGN mentioned above, there is not a significant difference in the distribution of FWHM for the two subsamples. A Kolmogorov-Smirnov (K-S) test shows that the probability that the type I ( including MCG -6-30-15) and type II AGNs are drawn from the same parent population is 0.83. Therefore, it appears that there is no difference in the origin of the Fe K line in type I and type II AGNs, which is consistent with the predictions of the unification model.
Figure 5 shows the relationship between the Fe K line FWHM and the black hole mass (see Table 2 caption for references). Open and solid circles denote type I and type II AGNs, respectively. We see that all FWHM values, within the statistical errors, are consistent with a constant, independent of the mass of black hole. Assuming that the line originates in material that is in a virialized orbit around the black hole, we can estimate the distance, , of the line-emitting material to the black hole using the relation . Assuming that the velocity dispersion is related to FWHM velocity as = (Netzer et al. 1990), we can obtain , where . Using the weighted mean of FWHM 2000 km s-1, we find that the , larger than the typical size of the BLR (e.g., Peterson et al. 2004). Therefore, our results seem to support the bulk of the Fe K line production arising from a region that is appears to be located at a universal distance with respect to the gravitational radius, which is controlled by central black hole mass. Note that Nandra (2006) also examined the relation between the FWHM of Fe K line and the black hole mass, but their results were ambiguous. The reason why they did not find the result that we found is possibly due to the fact that some of the sources in their sample had only poor quality and/or problematic Fe K line-width measurements. Including such sources could have obscured the underlying result that may be the key factor that determines the location of the line-emitting region. However, it is important to note that even with superb Chandra HEG spectral resolution, there may be blending from a Compton-shoulder component and/or multiple low ionization states of Fe (e.g., Yaqoob & Murphy 2011), so that the true line width may be less than the FWHM deduced from our simplistic model-fitting.
3.3. What can we learn from the Fe K Line Emission?
From a theoretical point of view, the flux or luminosity of the Fe K line () is nontrivial to calculate, as it depends on a number of factors, including geometry, orientation, covering factor, element abundance, and column density of the line-emitting material. Using Monte Carlo simulations of a toroidal X-ray reprocessor model, Murphy & Yaqoob (2009, see also Yaqoob et al. 2010) showed that geometrical and inclination-angle effects become important for cm-2 for the observed EW and line flux. For a given covering factor and set of element abundances, a toroidal structure with a column density of greater than cm-2, observed at an edge-on inclination could produce an Fe K emission line flux that is an order of magnitude or more weaker than a face-on orientation (Yaqoob et al. 2010). In particular, the Fe K line luminosity is not simply a linear function of , and it has a maximum value for a column density in the range cm-2, depending on the inclination angle. Therefore, the Fe K line luminosity cannot be trivially used to measure the intrinsic AGN luminosity (). The relation between and is more complicated than we would expect from optically-thin matter, and it is strongly model dependent, and in particular it depends on covering factor, inclination angle and column density. We emphasize that the column density for producing the Fe K line does not refer to the line-of-sight value, but rather to a value that corresponds to the angle-averaged flux over all incident X-ray continuum radiation (see Murphy & Yaqoob 2009).
Recently, Liu & Wang (2010) confirmed that and are not simply related. They compared the narrow Fe K line emission between type I and type II AGNs, using data obtained with XMM-Newton, and found that statistically, the Fe K line luminosities in Compton-thin and Compton thick type II AGNs are about 2.7 and 5.6 times lower than that in type I sources, respectively. They therefore proposed that different correction factors should be applied if one uses the Fe K line emission to estimate the AGN’s intrinsic luminosity. To examine the relation between and for our Chandra grating sample, we plot in Figure 6 (upper panel) the Fe K line luminosity (), versus the [O IV] 25.89 m line luminosity (, which is claimed to be an intrinsic AGN luminosity indicator, see Meléndez et al. 2008a). The type II AGNs are shown with solid circles, while open circles represent 24 type I AGNs for which the [O IV] line luminosity is available from literature. Solid stars denote tentative Compton-thick sources, based on previously reported measurements of NH (e.g., Treister, Urry & Virani 2009, and references therein). The right-hand panel shows the distribution of for both type I (dotted line) and type II (solid line) AGNs. It can be seen that the distribution of the Fe K line luminosity in type II AGNs is not significantly different from that in type I AGNs. A K-S test shows the probability that both samples were drawn from the same parent population is 0.21. However, when normalizing the Fe K line luminosity by the [O IV] line luminosity (/, the lower panel of Figure 6), we find a marginal difference in the distributions of the / ratio for type I and type II AGNs, but the significance level is not high (at 93% confidence), possibly due to the small size of the current Chandra grating sample. The dotted and dashed horizontal lines show the means of / for Liu & Wang’s type I and type II subsamples, respectively. It seems that the distribution of the / ratio for our Chandra grating sample shows a similar pattern as Liu & Wang’s sample. However, we note that there is significant overlap between the type I and type II AGNs with intermediate values of the / ratio (see also Liu & Wang 2010, Figure 6), suggesting the complex dependencies of the Fe K line emission on the geometry and physical properties of the line-emitting material. In the context of a toroidal geometry (e.g., Murphy & Yaqoob 2009), the sources in the overlap region of the / plot may however indicate that they constitute a selected distribution of NH and inclination angle (e.g., Circinus galaxy, Yang et al. 2009), but a larger sample is required to make a detailed comparison.
Although in our study we cannot determine some of the critical parameters of the Fe K line emitter, such as global covering factor, , and the inclination angle of the X-ray reprocessor, we can still make interesting statements from the plot of vs. /. It is apparent that the ratio of / appears to have a dispersion of 2 to 3 orders of magnitude or so. Regardless of AGN type, the sources located at the top end of the / ratio distribution are expected to be those objects that are observed at a face-on, or near face-on, inclination angle, with moderate ( cm-2). The sources located in the region of the lowest values of / should correspond to cases with higher and higher inclination angles. We note that the source with the lowest ratio of / is the prototypical Seyfert 2 galaxy NGC 1068, for which an edge-on orientation of the torus and a high, Compton-thick column density has already been suggested in literature (e.g., Pounds et al. 2006, and references therein).
4. SUMMARY
We have presented an empirical analysis of 29 observations of the narrow core of the Fe K emission line in 10 type II AGNs using Chandra HEG data. The Fe K line was significantly detected, and its parameters (line centroid energy, intrinsic width and line flux) were well-measured, in 8 out of 10 sources. The centroid energy of Fe K line is found to be strongly peaked around keV, indicating an origin in cool, neutral matter, consistent with the results of Paper I for a sample of type I AGNs.
We obtained a weighted mean value of FWHM for the intrinsic Fe K line width. For five sources with spectro-polarimetric observations, we constructed 99% confidence, two-parameter contours of line flux versus the ratio of the width of the Fe K line to the width of the H line. We found that the 99% confidence bounds on the ratio of the X-ray line width to the optical line width lies in the range 0.3 – 1.2, suggesting that contributions to the flux of the core of the Fe K line are allowed from a region that is within a factor times the radius of the optical BLR. Compared to 13 type I AGNs with sufficiently high quality Fe K line-width measurements (reported in paper I), we found no difference in the distribution between the Fe K FWHM in type I and type II AGNs, and this conclusion is independent of the central black mass. This result suggests there may be a universal location for the bulk of the Fe K line emission with respect to the gravitational radius (). However, these conclusions are subject to the caveat that derivation of the true velocity width of the Fe K line core requires a realistic physical model, and this will be the subject of future work.
Having isolated the narrow core of the Fe K line with the best available spectral resolution, we also presented measurements of the line luminosity of the Fe K core, and examined its relation to the intrinsic AGN luminosity (i.e., by means of the indicator). We found a marginal difference in the distribution of the Fe K emission-line luminosity between type I and type II AGNs, but the significance level is not high, and the spread in the / is about 2 orders of magnitude. Although the complex dependencies of the Fe K emission-line parameters upon the covering factor, inclination angle and column density, prevent trivial use of the Fe K luminosity as a proxy of the intrinsic AGN’s luminosity, the Chandra results presented here will provide an important and new supplement to additional X-ray spectroscopy with a broader bandpass. A detailed comparison of the data for the Fe K line and the continuum with appropriate models will then yield more robust constraints on the intrinsic AGN luminosity and the physical parameters of the X-ray processor.
We thank E. Moran for helpful discussions on the spectropolarimetric observations of NGC 4507. X.W.S. thanks the support from China postdoctoral foundation. We acknowledge support from Chinese National Science Foundation (Grant No. 10825312), and the Fundamental Research Funds for the Central Universities (Grant No. WK2030220004, WK2030220005). This research made use of the HEASARC online data archive services, supported by NASA/GSFC. This research has made use of the NASA/IPAC Extragalactic Database (NED) which is operated by the Jet Propulsion Laboratory, California Institute of Technology, under contract with NASA. The authors are grateful to the Chandra instrument and operations teams for making these observations possible.
References
- (1) Antonucci, R. 1993, ARA&A, 31, 473
- (2) Arnaud, K. A., 1996, Astronomical Data Analysis Software and Systems V, eds. Jacoby, G., & Barnes, J., p. 17, ASP Conference Series, Vol. 101
- (3) Bian W., & Gu Q. 2007, ApJ, 657, 159
- (4) Bianchi S., Matt, G., & Fiore, F. et al. 2002, A&A, 396, 793
- (5) Bianchi S., La Franca F., Matt G., Guainazzi M., Jiménez-Bailón E., Longinotti A. L., Nicastro F., Pentericci L., 2008, MNRAS, 389, 52
- (6) Bianchi, S., Piconcelli, E., Chiaberge, M. et al. 2009, ApJ, 695, 781
- (7) Brightman M., & Nandra K., 2011, MNRAS, in press (arXiv:1012.3345)
- (8) Cai, H. B., Shu, X. W., Wang, J. X., & Zheng, Z. Y. 2010, RAA, 10, 427
- (9) Conselice, C. J., Gallagher, J. S., Wyse, R. F. G. 2001, AJ, 122, 2281
- (10) Elvis, M., Risaliti, G., Nicastro, F. et al. 2004, ApJ, 615, 25
- (11) Fukazawa, Y. Hiragi, K., Mizuno, M. et al. 2011, ApJ, 727, 19
- (12) Gaskell C. M., Goosmann R. W., Klimek E. S., 2008, MmSAI, 79, 1090
- (13) Gehrels, N. 1986, ApJ, 303, 33
- (14) Greenhill L. J., Moran J. M., Herrnstein J. R. et al. 1997, ApJ, 481, L23
- (15) Ikeda S., Awaki, H., & Terashima Y. 2009, ApJ, 692, 608
- (16) Jiang, P., Wang, J. X., & Wang, T. G. 2006, ApJ, 644, 725
- (17) Landt, H., Bentz, M. C., Ward, M. J. et al. 2008, ApJS. 174, 282
- (18) Lee J. C., Iwasawa K., Houck J. C. et al. 2002, ApJ, 570, L47
- (19) Levenson N. A., Krolik J. H., Zycki, P. Y. et al. 2002, ApJ, L81
- (20) Levenson N. A., Heckman T. M., Krolik J. H., Weaver K. A., Życki P. T., 2006, ApJ, 648, 111
- (21) Liu Y., Elvis, M., McHardy, I. M. et al. 2010, ApJ, 710, 1228
- (22) Liu T., & Wang, J. X. 2010, ApJ, 725, 238
- (23) Lubiński P., Zdziarski A. A., 2001, MNRAS, 323, L37
- (24) Marconi, A., Capetti, A., Axon, D. J. et al. 2001, ApJ, 549, 915
- Markert et al. (1995) Markert T. H., Canizares C. R., Dewey D., McGuirk M., Pak C., Shattenburg M. L., 1995, Proc. SPIE, 2280, 168
- (26) Matt, G. 2002, MNRAS, 337, 147
- (27) Meléndez, M., et al. 2008a, ApJ, 682, 94
- (28) Meléndez, M., et al. 2008b, ApJ, 689, 95
- (29) Miller L., Turner T. J. & Reeves J. N. 2008, A&A, 483, 437
- (30) Moran E. C., Barth A. J., Kay L. E., & Filippenko A. V. 2000, ApJ, 540, L73
- (31) Murphy K., Yaqoob T., 2009, MNRAS, 397, 1549
- (32) Nandra K., 2006, MNRAS, 368, L62
- (33) Netzer, H., et al. 1990, ApJ, 353, 108
- (34) Nishiura S., & Taniguchi Y. 1998, ApJ, 499, 134
- (35) Oliva E., Marconi A., Cimatti A., Alighieri S. D. 1998, A&A. 329, 21
- (36) Palmeri P., Mendoza C., Kallman T. R., Bautista M. A., Melendez M., 2003, A&A, 410, 359
- (37) Perola G. C., Matt G., Cappi M., Fiore F., Guainazzi M., Maraschi L., Petrucci P. O., Piro, L., 2002, A&A, 389, 802
- (38) Peterson B. M., Ferrarese L., Gilbert K. M. et al. 2004, ApJ, 613, 682
- (39) Pike C. D., Phillips K. J. H., Lang J. et al. 1996, ApJ, 464, 487
- (40) Pounds K., & Vaughan S. 2006, MNRAS, 368, 707
- (41) Ramos Ameida, C. et al. 2008, ApJ, 680, L17
- (42) Reynolds C. S., Nowak M. A., & Markoff S. et al. 2009, ApJ, 691, 1159
- (43) Risaliti, G., Elvis, M., Fabbiano, G., Baldi, A.,& Zezas, A. 2005, ApJ, 623, L93
- (44) Shu X. W., Yaqoob T. & Wang J. X. 2010, ApJS, 187, 581 (Paper I)
- (45) Sulentic J. W., Marziani P., Zwitter T., Calvani M., Dultzin-Hacyan, D., 1998, ApJ, 501, 54
- (46) Tecza M., Genzel R., Tacconi L. J. et al. 2000, ApJ, 537, 178
- (47) Treister E., Urry C. M., & Virani S. 2009, ApJ, 696, 110
- (48) Tremaine S., Gebhardt K., Bender R. et al. 2002, ApJ, 574, 740
- (49) Verner D. A., Ferland G. J., Korista K. T., Yakovlev D. G., 1996, ApJ, 465, 487
- (50) Weaver K. A., Gelbord J., Yaqoob T., 2001, ApJ, 550, 261
- (51) Winter L. M., Mushotzky R. F., Reynolds C. S., Tueller J., 2009, ApJ, 690, 1322
- (52) Woo J. H., & Urry C. M. 2002, ApJ, 579, 530
- (53) Yamada S., Itoh T., Makishima K., & Nakazawa, K. 2009, PASJ, 61, 309
- (54) Yang Y., Wilson A. S., Matt G., Terashima Y., Greenhill L. J. 2009, ApJ, 691, 131
- (55) Yaqoob T., George I. M., Nandra K., Turner T. J., Serlemitsos P. J., Mushotzky R. F., 2001, ApJ, 546, 759
- (56) Yaqoob T., George I. M., Kallman T. R., Padmanabhan U., Weaver. K. A., Turner T. J., 2003, ApJ, 596, 85
- (57) Yaqoob T., Padmanabhan U., 2004, ApJ, 604, 63 (YP04)
- (58) Yaqoob T., Murphy K. D., Griffiths R. E. et al. 2007, PASJ, 59, 283
- (59) Yaqoob T., & Murphy, K. D. 2011, MNRAS, 412, 277
- (60) Yaqoob T., & Murphy, K. D., Miller, L. & Turner, T. J. 2010, MNRAS, 401, 411
- (61) Young S. et al. 1996, MNRAS, 281, 1206
- (62) Young A. J., Lee J. C., Fabian A. C., Reynolds C. S., Gibson R. R., Canizares C. R., 2005, ApJ, 631, 733
Figure Caption
Figure 1
Chandra HEG spectra in the Fe K band
for sources in our sample.
For eight AGN which were observed more than once, the time-averaged
spectra are shown.
The data are binned at , comparable to
the HEG spectral resolution, which is
FWHM. The data are combined from the and orders
of the grating. The spectra have been corrected for instrumental effective area
and cosmological redshift.
Note that these are not unfolded spectra and are
therefore independent of any model that is fitted.
The statistical errors shown correspond
to the
(asymmetric) Poisson errors, which we calculated using
equations (7) and (14) in Geherls (1986) that approximate the upper and
lower errors respectively.
The solid line corresponds to a continuum model fitted over the
3–10 keV range,
as described in the text (Section 2).
The vertical dotted lines represent (from left to right), the rest energies
of the following: Fe i , Fe xxv forbidden,
two intercombination lines of Fe xxv, Fe xxv resonance, Fe xxvi Ly,
Fe i , and the Fe K edge.


| Source | SeqNum | ObsID | Exposure (ks) | ObsDate | |
|---|---|---|---|---|---|
| NGC 4945 | 0.001878 | 700981 | 4899 | 78.6 | 2004-05-28 |
| 700981 | 4900 | 95.8 | 2004-05-29 | ||
| Circinus | 0.001448 | 700046 | 374 | 7.3 | 2000-06-15 |
| 700268 | 62877 | 61.4 | 2004-06-02 | ||
| 700853 | 4770 | 56.1 | 2004-06-02 | ||
| 700854 | 4771 | 60.2 | 2004-11-28 | ||
| NGC 6240 | 0.024480 | 701324 | 6908 | 159.0 | 2006-05-16 |
| 701324 | 6909 | 143.0 | 2006-05-11 | ||
| NGC 1068 | 0.003793 | 700004 | 332 | 46.3 | 2000-12-04 |
| 701591 | 9148 | 80.9 | 2008-12-05 | ||
| 701591 | 9149 | 91.2 | 2008-11-19 | ||
| 701591 | 10815 | 19.4 | 2008-11-20 | ||
| 701591 | 10816 | 16.4 | 2008-11-18 | ||
| 701591 | 10817 | 33.2 | 2008-11-22 | ||
| 701591 | 10829 | 39.1 | 2008-11-30 | ||
| 701591 | 10830 | 43.6 | 2008-12-03 | ||
| 701592 | 9150 | 41.8 | 2008-11-27 | ||
| 701592 | 10823 | 35.1 | 2008-11-25 | ||
| Mrk 3 | 0.013509 | 700178 | 873 | 101.9 | 2000-03-18 |
| NGC 4507 | 0.011801 | 700340 | 2150 | 139.8 | 2001-03-15 |
| Centaurus A | 0.001825 | 700216 | 1600 | 47.5 | 2001-05-09 |
| 700217 | 1601 | 52.2 | 2001-05-21 | ||
| NGC 4388 | 0.008419 | 701717 | 9276 | 172.8 | 2008-04-16 |
| 701717 | 9277 | 99.6 | 2008-04-24 | ||
| NGC 4258 | 0.001494 | 701543 | 7879 | 152.9 | 2007-10-08 |
| 701543 | 7880 | 60.0 | 2007-10-12 | ||
| 701543 | 9750 | 107.1 | 2007-10-14 | ||
| NGC 1275 | 0.017559 | 700005 | 333 | 27.4 | 1999-10-10 |
| 700201 | 428 | 25.0 | 2000-08-25 |
| Source | FWHM(Fe K ) | I(Fe K ) | L(Fe K ) | FWHM (H) | |||||
|---|---|---|---|---|---|---|---|---|---|
| (keV) | (eV) | (km s-1) | (km s-1) | ||||||
| (1) | (2) | (3) | (4) | (5) | (6) | (7) | (8) | (9) | (10) |
| NGC 4945(2)⋆ | 2.6 | 2780 | 2.6 | 39.31 | 6.2 | 39.37 | |||
| Circinus(4)⋆ | 16.0 | 1710 | 35.4 | 40.22 | 3300† | 6.1 | 40.50 | ||
| NGC 6240(2)⋆ | 2.9 | 2810 | 1.2 | 41.20 | 9.0 | 41.82 | |||
| NGC 1068(10)⋆ | 5.6 | 2660 | 5.2 | 40.23 | 3030 | 7.2 | 41.78 | ||
| Mrk 3⋆ | 6.3 | 612 | 3140 | 7.7 | 41.50 | 6000 | 8.6 | 41.97 | |
| NGC 4507 | 27.9 | 114 | 2200 | 11.0 | 41.53 | 5000† | 7.6 | 41.01 | |
| Centarus A(2) | 310.8 | 45 | 2320 | 26.4 | 40.30 | 8.3 | 39.86 | ||
| NGC 4388(2) | 23.1 | 169 | 2430 | 10.0 | 41.16 | 3100 | 7.2 | 41.61 | |
| NGC 4258(3) | 9.0 | 6.4 (fixed) | 14 | 100 (fixed) | 0.2 | 37.96 | 7.6 | 38.57 | |
| NGC 1275(2) | 30.2 | 6.4 (fixed) | 19 | 100 (fixed) | 0.6 | 40.63 | 8.5 | 40.74 |
Note. — Results from Chandra HEG data, fitted with a absorbed power law plus Gaussian emission-line model in the 3–10 keV band. All parameters are quoted in the source rest frame. Statistical errors are for the 68% confidence level for three free parameters in the Gaussian component of the model (corresponding to C=3.506). For NGC 4258 and NGC 1275, the 1 statistical errors are for one free parameter, corresponding to C=0.989. Col.(1): Source Name, whilst parentheses show the number of the observations used to produce the time-averaged spectrum. All HEG observations were in the Chandra public archives as of 2010 Aug 1 (see Section 2). ⋆Compton-thick AGN; Col.(2): The observed 2–10 keV flux in units of 10-12 ergs cm-2 s-1; Col.(3): Gaussian line centroid energy; Col.(4): Emission line equivalent width; Col.(5): Full width half maximum of the Fe K , rounded to . Col.(6): Emission-line intensity in units of 10-5 photons cm-2 s-1. Col.(7): The logarithm of Fe K line luminosity in units of ; Col.(8): Full width half maximum of the broad polarized H line, refers to Oliva et al. 1998; Nishiura & Taniguchi 1998; Moran et al. 2000; Young et al. 1996. † Broad polarized H line. Col.(9): Black hole mass, refers to: Greenhill, Moran, & Herrnstein (1997); Bian & Gu (2007); Tecza et al. (2000); Tremaine et al. (2002); Marconi et al. (2001); Woo & Urry (2002). Col.(10): Logarithm of the [O IV] emission line luminosity, refers to: Liu & Wang (2010); Meléndez et al. (2008b).