Reduction of charge fluctuation energies in ultrathin NiO films on Ag(001)
Abstract
We investigate the on-site Coulomb interaction energy (Ni ) between two holes in an ultrathin NiO film on Ag(001) using both x-ray photoelectron spectroscopy and Auger electron spectroscopy. As the film becomes thinner, (Ni ) decreases monotonically, and the difference between the values of (Ni ) for a 1-monolayer (ML) film and a bulk-like thick film, (Ni ), reaches eV. The observed value of (Ni ) for a 1 ML film is well reproduced by the differences between both the image potentials and polarization energies of the 1 ML film and the bulk-like thick film. Hence, the present results provide evidence in favor of the reduction of charge fluctuation energies in ultrathin films on highly polarizable substrates, as originally predicted by Duffy et al. [J. Phys. C: Solid State Phys., 16, 4087 (1983)] and Altieri et al.[Phys. Rev. B 59, R2517 (1999)].
I Introduction
The electronic properties of ultrathin films are significantly different from those of their bulk states due to their reduced dimensionality and the influence of substrates. In the case of oxides on metallic substrates, it has been predicted that characteristic features such as the on-site Coulomb interaction energy and the charge transfer energy from a ligand to a neighboring cation would be substantially altered for atomically thin films.Duffy ; Altieri Altieri et al.Altieri observed that for an ultrathin MgO film on Ag(001), both and decreased monotonically as the film became thinner. They attributed the decrements from the bulk values of and in the film, and , to the extra-atomic relaxation energies that developed in response to the altered charge states of the ions. As the major sources of , they considered both the image charge potential energy between an extra charge and its image induced in the metal substrate and the polarization energy of the oxide caused by the extra charge also known as the Madelung potential energy. The magnitude of the image potential energy should be larger for thinner films due to the smaller mean distance between an extra charge in the film and its image in the substrate. The polarization energy of the film should be different from that of the bulk oxide because the volume of the oxide in the film is reduced, whereas the polarizability is enhanced at the surface of the oxide. The resulting variation between in the film and in the bulk state, , even quantitatively reproduced the experimental for a 1-monolayer (ML) MgO film on Ag(001).Altieri
Nevertheless, the suspicion was raised that the successful reproduction of the experimental by could have been fortuitous, as there were many other effects (such as dipole-dipole interactions) that were not taken into account as well as unjustified assumptions (such as dependence of the image potential on the atomic distance). Moreover, Chambers and DroubayChambers reported that both Fe2O3 and Cr2O3 films on Pt(111) exhibited negligible and . This contrasting observation was attributed to effective intrinsic screening of charge transfer, which reduced the extra-atomic relaxation to an undetectable level. Thus, no comprehensive elucidation of the electronic properties of ultrathin oxide films on highly polarizable substrates seems to exist, and the number of experimental studies are very limited to properly assess the existing hypotheses.
The objective of the present work is to assess the existing hypotheses by comparing their predictions with experimental results for a different system: ultrathin NiO films on Ag(001). Bulk NiO is prototypical as a charge-transfer insulator, Zaanen and its charge fluctuation energies have already been studied.Guenseop ; Taguchi Furthermore, the lattice mismatch between NiO(001) and Ag(001) is only 2 , and the pseudomorphic growth of an NiO film is well established.Neddermeyer ; Wollschlager ; Caffio In other words, NiO films grown on Ag(001) are well suited for studying the thickness dependency of charge fluctuation energies such as and .
However, it is difficult to obtain the Coulomb interaction energy (Ni ) between Ni electrons via the method of Altieri et al.,Altieri because the Ni spectrum is difficult to isolate due to its overlap with the Ag band of the substrate. Instead, we study the interaction energy between Ni holes (Ni ). As the film becomes atomically thin, (Ni ) exhibits a substantial reduction from its bulk value. Moreover, the extra-atomic relaxation energies represented by both and well reproduce the change in (Ni ) from bulk to thin film, (Ni , for a 1 ML NiO film on Ag(001). Using the observed values of and , we estimate the Néel temperature in the mean field approximation that is found to be compatible with the experimental value of for a 3-ML NiO film.Tjeng These results reinforce the idea that the extra-atomic relaxation represented mainly by and determines and for ultrathin oxide films of NiO, as well as MgO, on highly polarizable substrates.
II Experiment
We performed in situ scanning tunneling microscopy (STM), photoelectron spectroscopy (PES), and Auger electron spectroscopy (AES) on ultrathin NiO films grown on Ag(001). The STM work was carried out with a variable-temperature STM (Omicron). The NiO films were grown in an attached preparation chamber, where the preliminary characterization of both Ag substrate and NiO film was accomplished by x-ray photoelectron spectroscopy (XPS) and low-energy electron diffraction (LEED).
The PES and AES work were carried out with a soft x-ray beamline (7B1) at Pohang Light Source in Korea. The end station of the beamline is composed of both an analysis chamber and a preparation chamber. The analysis chamber is equipped with a hemispherical electron energy analyzer with a multichannel detector. For the PES, the photoelectrons are collected at a take-off angle of 45∘ with respect to the surface normal of the sample. The PES resolving power is 4000.HN The zero point of the binding energy is determined in reference to the binding energy of the Ag (368.3 eV) of the clean Ag substrate. All spectra presented in this work were recorded with the sample maintained at room temperature. For both STM and PES, no charging effects were observed.
The NiO films were grown in preparation chambers for both STM and PES. The base pressures were Torr for both chambers. Wedge-shaped NiO films were grown by e-beam evaporation of high purity (5N) Ni rod onto clean Ag(001) at room temperature at an ambient O2 pressure () of Torr. The films were then thermally annealed at K at Torr. In the present work, we are especially interested in films within the monolayer limit, as this enables a definite comparison of experimental with theoretical values obtained by considering extra-atomic relaxation energies. However, for films less than 2 ML, the growth mode is somewhat complicated due to the () reconstruction and the bilayer growth of the NiO film.Neddermeyer ; Wollschlager ; Caffio Under the aforementioned growth conditions, we were able to grow 1 ML () nickel oxide films, as assessed by a combination of techniques, including STM, LEED, and XPS. (Further details are given in the following section.) According to our previous extensive PES of NiO films, such growth conditions also minimize the chemical defects.chemical
The thickness of each film was mainly determined by the ratio of the peak intensity of the Ag in the NiO-covered region to that of the clean Ag substrate, assuming layer-by-layer (LBL) growth of the film. Because the growth of a NiO film does not follow LBL in an ideal fashion, the thicknesses described in the present work are nominal. For coverage 0.5 ML, the film is mainly composed of monolayer-high islands and can be taken as a model for a 1 ML film (Fig. 1(a)). (Further discussion is presented below.) Moreover, up to 0.5 ML, the coverage recorded by a quartz microbalance is in reasonable agreement with the nominal coverage estimated by the reduction of Ag intensity, assuming layer-by-layer growth of the NiO film. Based on these estimated film thicknesses, the growth rate is adjusted to 0.25 ML/min throughout the experiments.
III Result
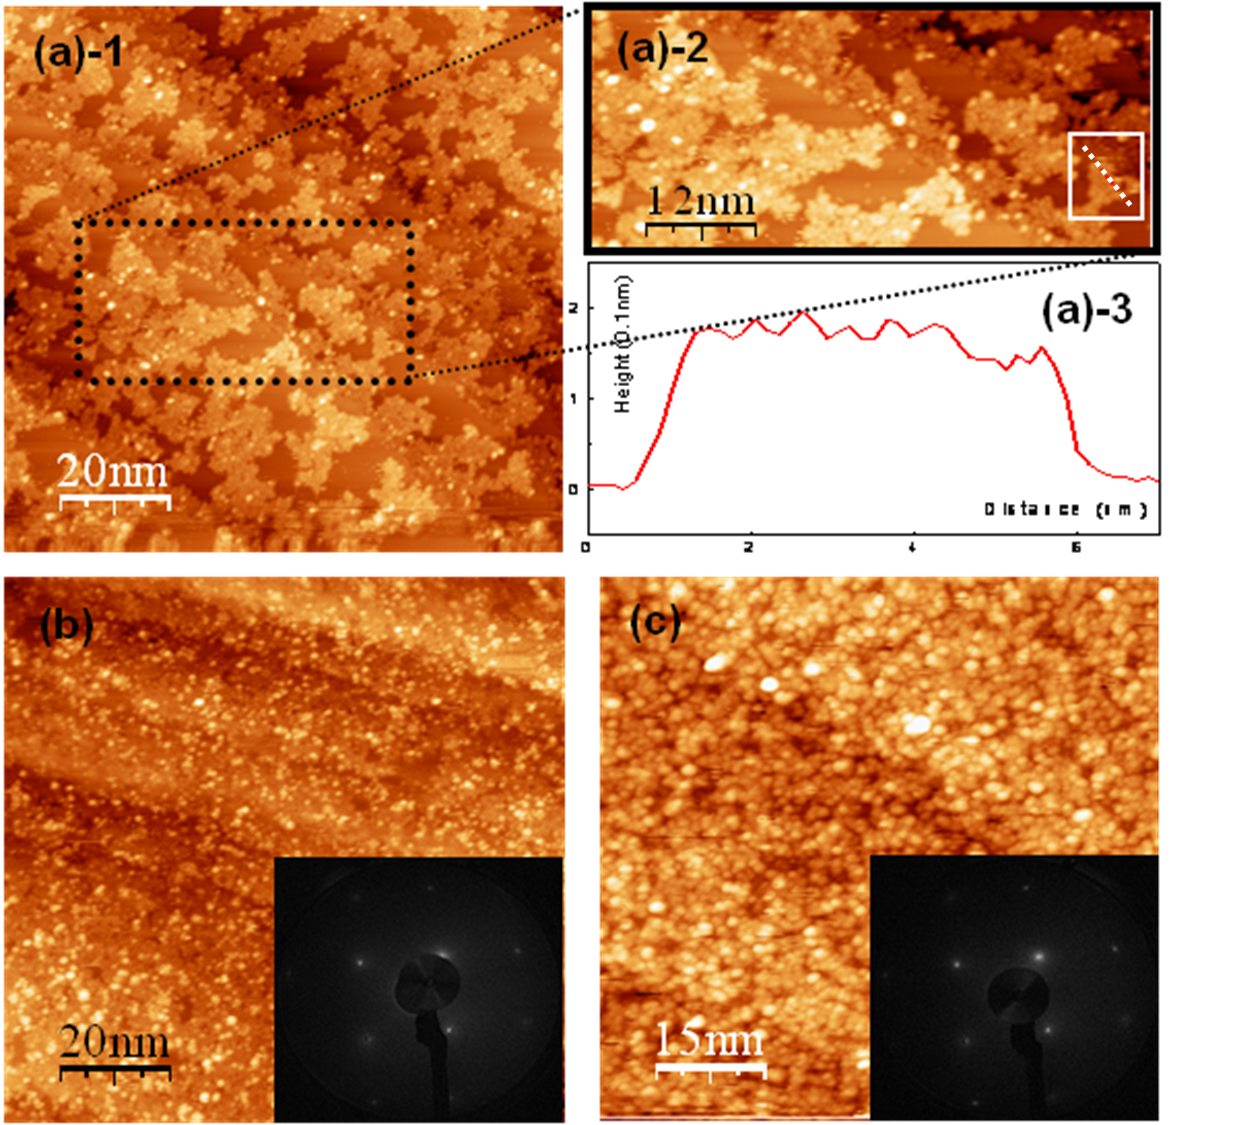
Figure 1 (a)-1 shows a typical image of a nickel oxide film with 0.5 ML coverage, consisting of nickel oxide patches. The line profile (Fig. 1 (a)-3) across a typical patch in Fig. 1 (a)-2 displays a plateau of apparent height nm, which corresponded to 1 ML in our previous STM study of NiO film on Ag(001) under similar tunneling conditions.STM As the film (with its nominal coverage of 0.5 ML) is mostly composed of islands of thickness 1 ML, we regard its Ni and O spectra asrepresentative of the electronic properties of a 1 ML NiO film. After further deposition to the nominal coverage is around 1 ML, the second layer is preferably occupied (Fig. 1 (b)), and the film is almost bilayered. (Fig. 1 (c)) All films exhibit the () LEED pattern (Fig. 1 (b) and (c)), whereas the well-known () reconstruction is observed only sporadically in the STM images (Figure not shown). However, the () reconstruction becomes abundant if is lowered beneath 10-6 Torr.
(Ni ) can be obtained by comparing the energy of a two-hole state, Ni , to that of two one-hole state, Ni , in accordance with the relationship
| (1) |
The variation of (Ni ) from that of bulk (actually bulk-like thick film) (Ni ) can then be determined by the following relation,
| (2) |
which is obtained via the approach of Altieri et al.Altieri To estimate (Ni ), we measured the XPS spectra of Ni , Ni , and the Ni Auger transition as functions of the thickness of NiO film. We also utilized the O 1s spectra to estimate (O Ni ), as described below.
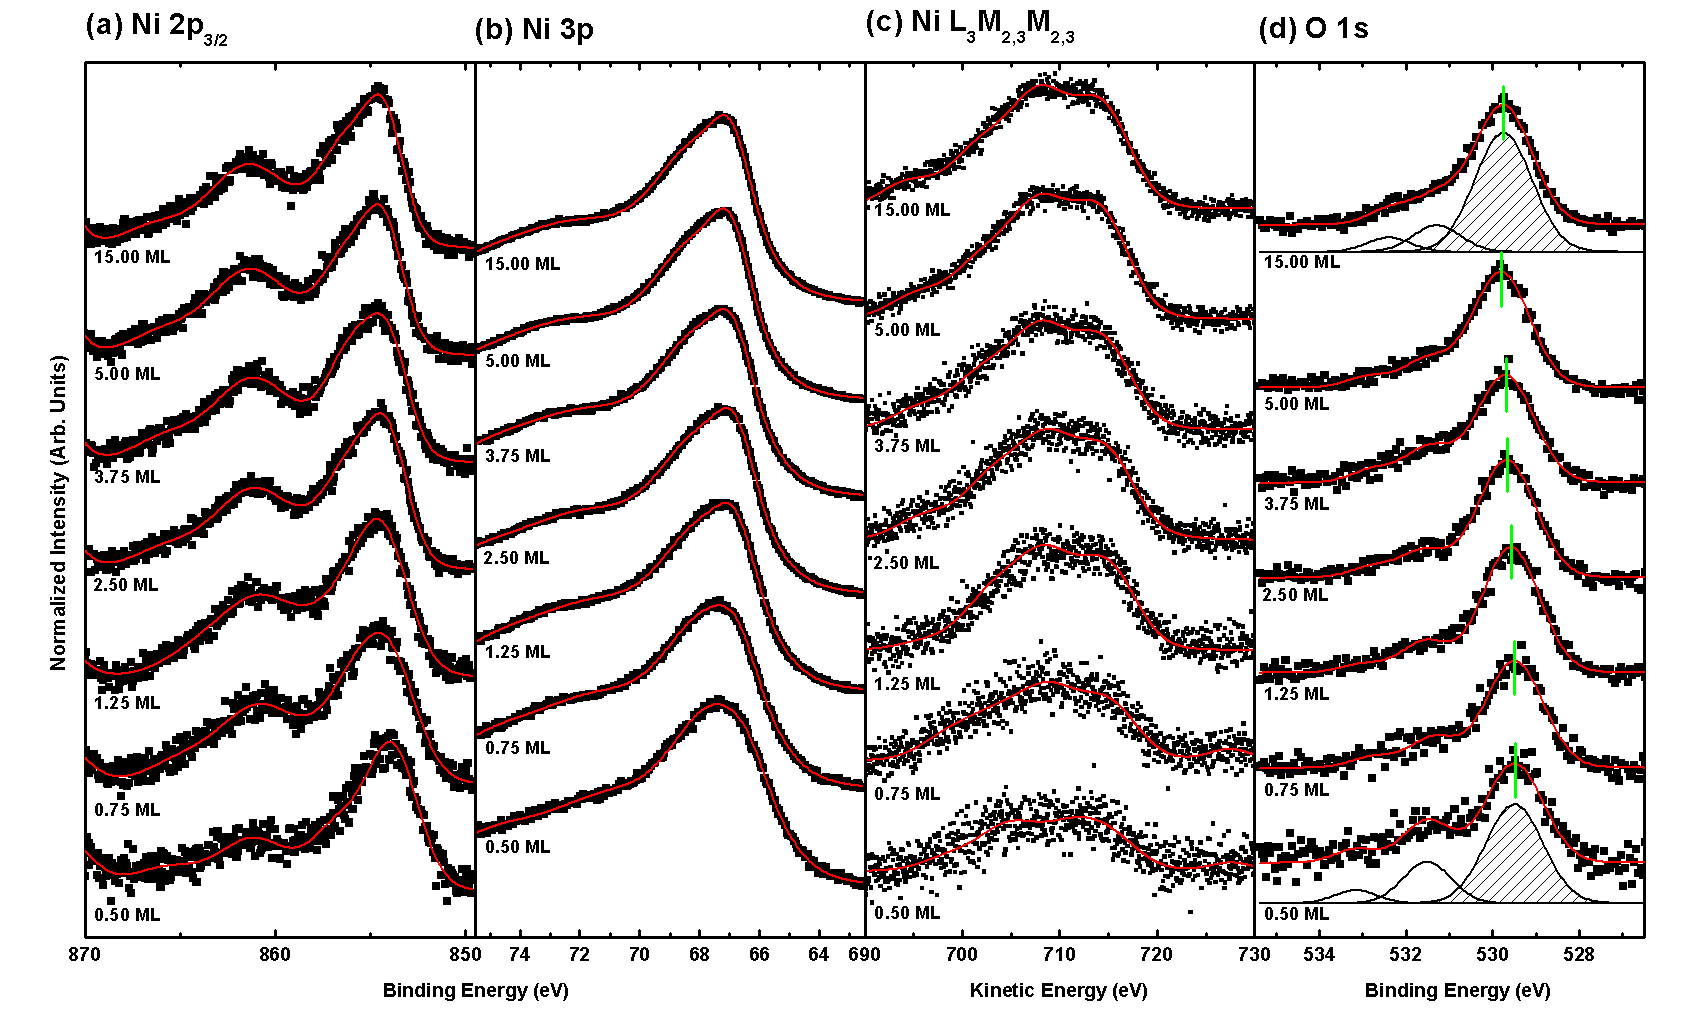
Figure 2 (a), (b), (c), and (d), respectively, show the Ni , Ni , NiLMM Auger transition, and O spectra of the NiO films. The thicknesses of the films range from submonolayer (0.5 ML) to 15.00 ML. Even visual inspection reveals monotonic shifts of the major peaks of those spectra with variation of the film thickness. However, the core-level spectra of Ni comprise many peaks of various origins, such as final state effects and non-local screening,chemical making identification of the main peak uncertain. This complication is also transferred to the NiLMM Auger transition. Thus, we estimate shifts of the peak positions of Ni , Ni , and the NiLMM Auger transition with variation in the film thickness in terms of shifts of the centroids of their spectra, anticipating that if shifts of the peak positions are mainly caused by extra-atomic relaxation, then all of the component peaks should shift by the same amount. Each spectrum is fitted with a minimal number (three or four) of Gaussian-convoluted Lorentzian peaks with Shirley backgrounds, which are used to obtain the centroid position. The red dotted lines overlapping the experimental spectra in Fig. 2 are best-fit curves.
To determine the peak positions of the O spectra, we fit each spectrum with Gaussian-convoluted Lorentzian peaks. The full widths at half-maxima of major peaks are 2.0 eV. The tick marks in the spectra indicate the resulting peak positions of the O spectra. The curve-fitting results suggest the existence of some chemical defects, possibly Ni2O3, Ni(OH)2 and/or NiO(OH), which appear as small shoulders in the spectra.chemical
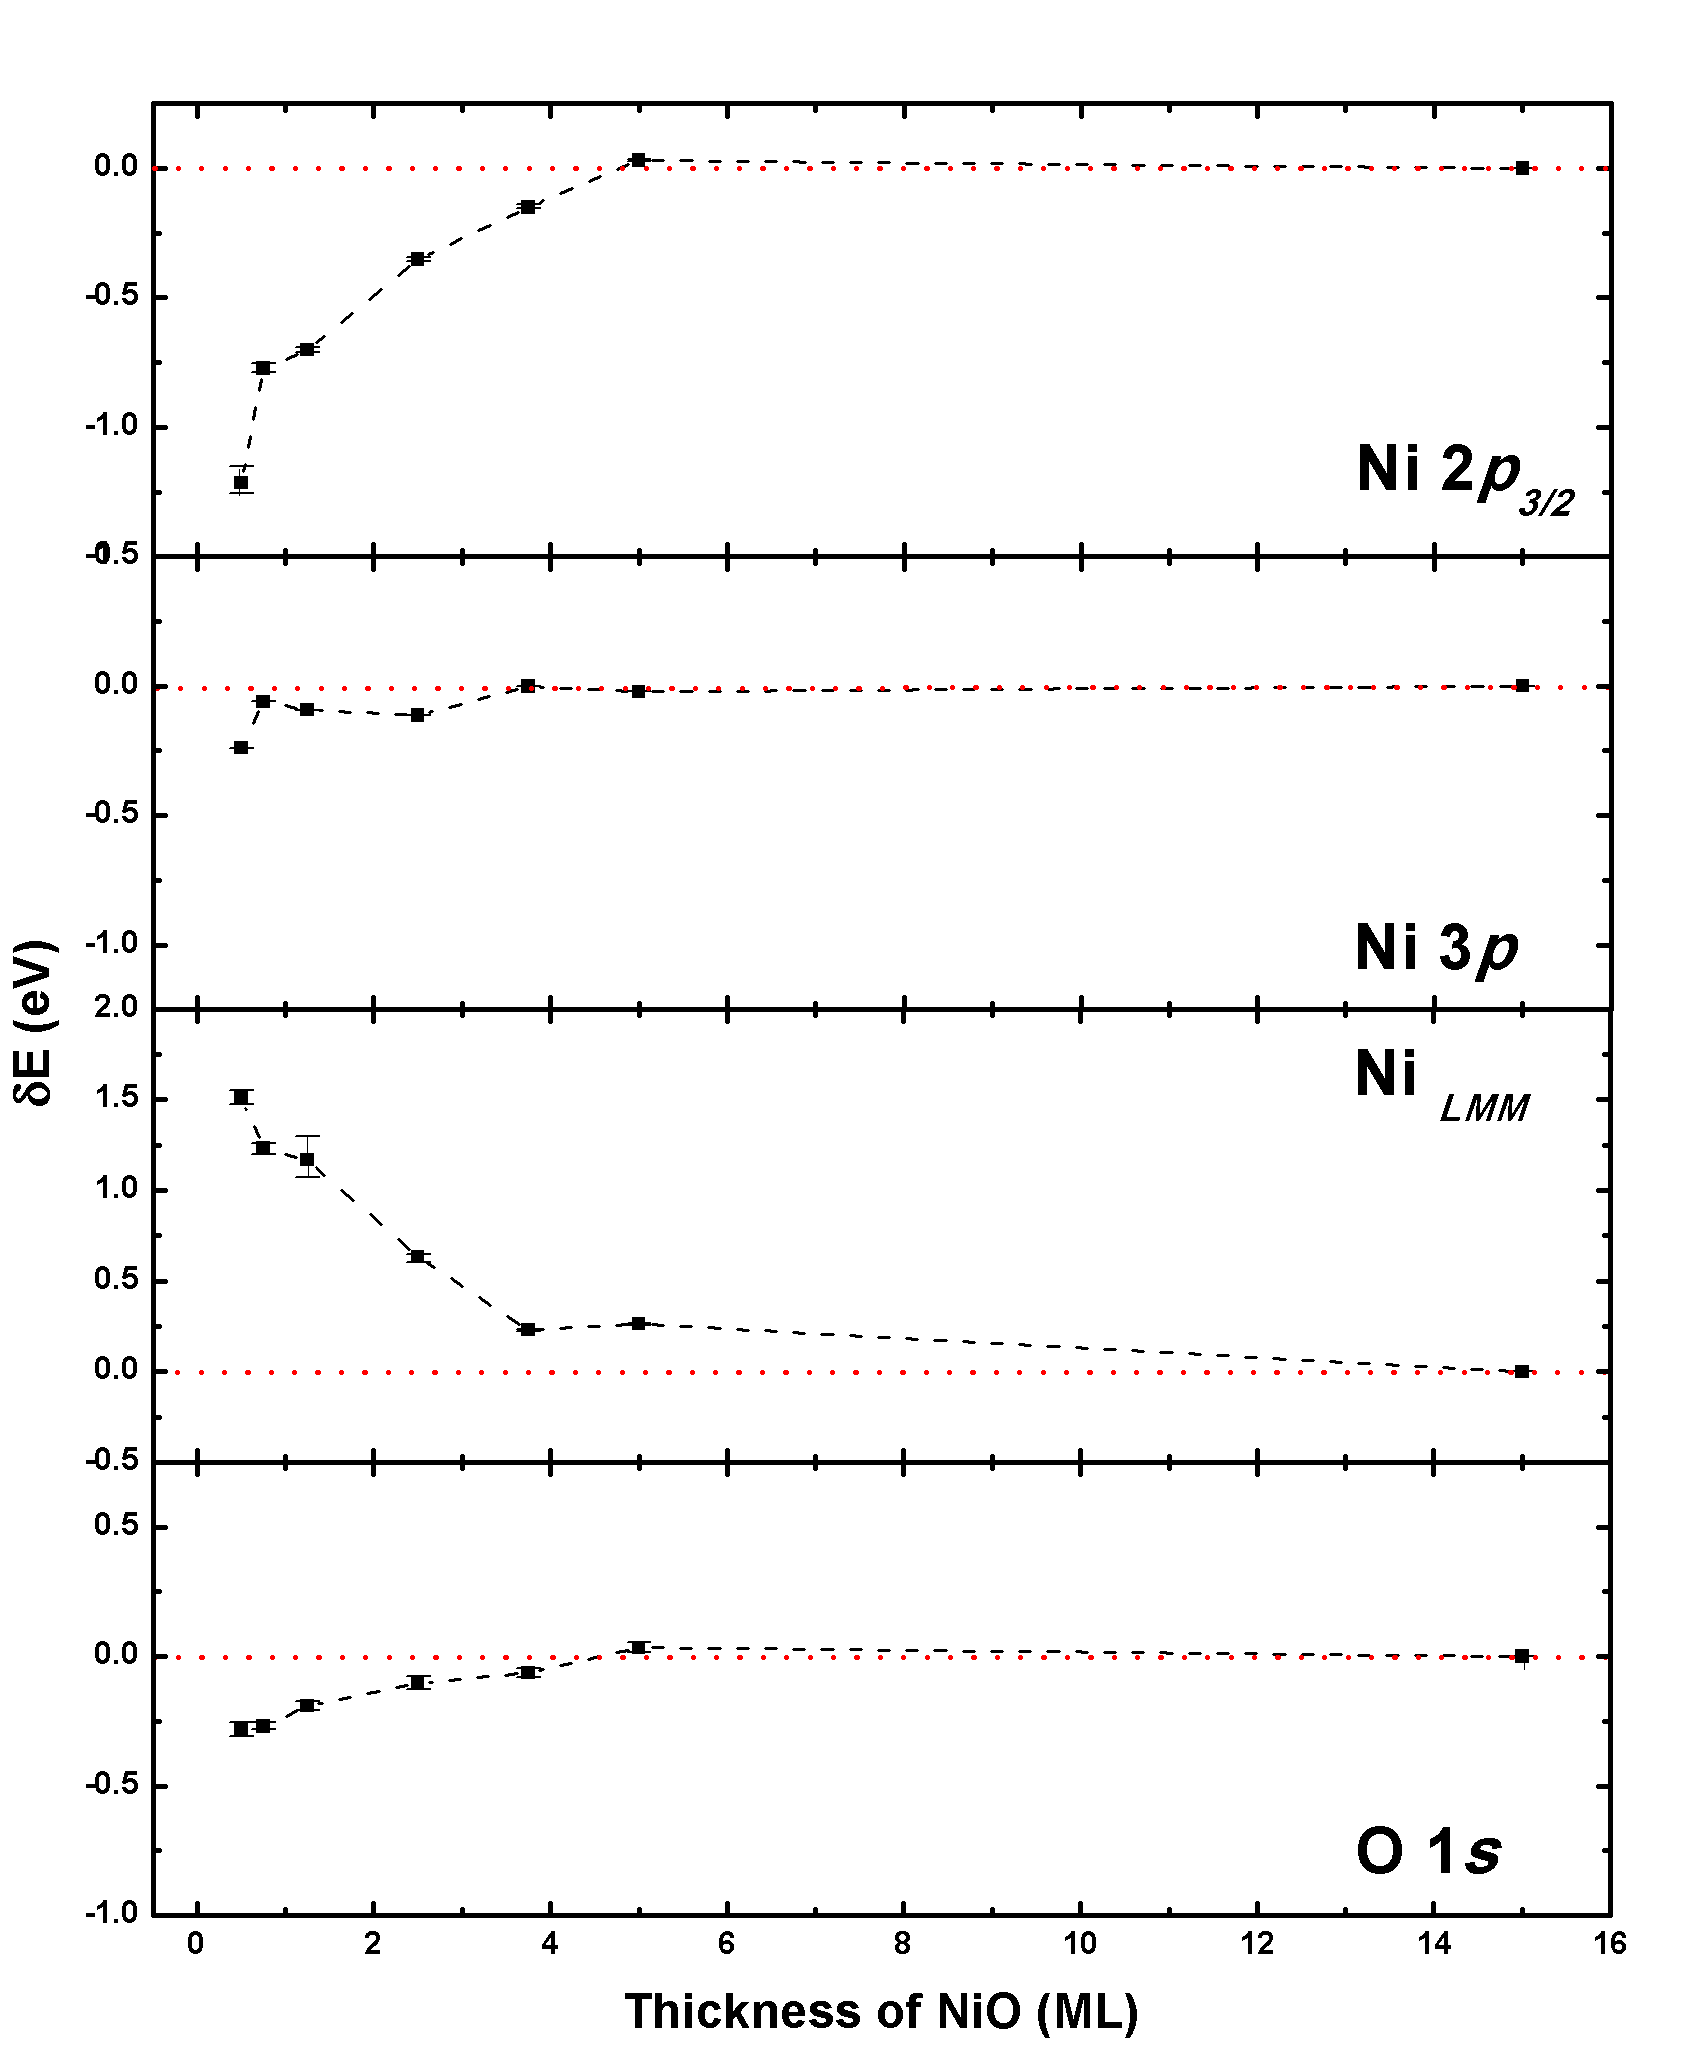
Figure 3 shows the centroid energies of Ni , , the Auger NiLMM spectra, and the energy of the O main peak as functions of the film thickness relative to the corresponding energies of the 15 ML film that is considered as a bulk-like film. Even though the data points exhibit some scatter, we may readily observe that as the film becomes thinner, the peak positions of all the photoelectron spectra tend to shift toward the lower binding energy side, whereas the Auger transition energy of NiLMM increases monotonically. For an ultrathin MgO film on Ag(001), a similar reduction of the binding energies of the photoelectrons and increase of the Auger electron energy for relevant transitions are also observed as the thickness of the film decreases.Altieri
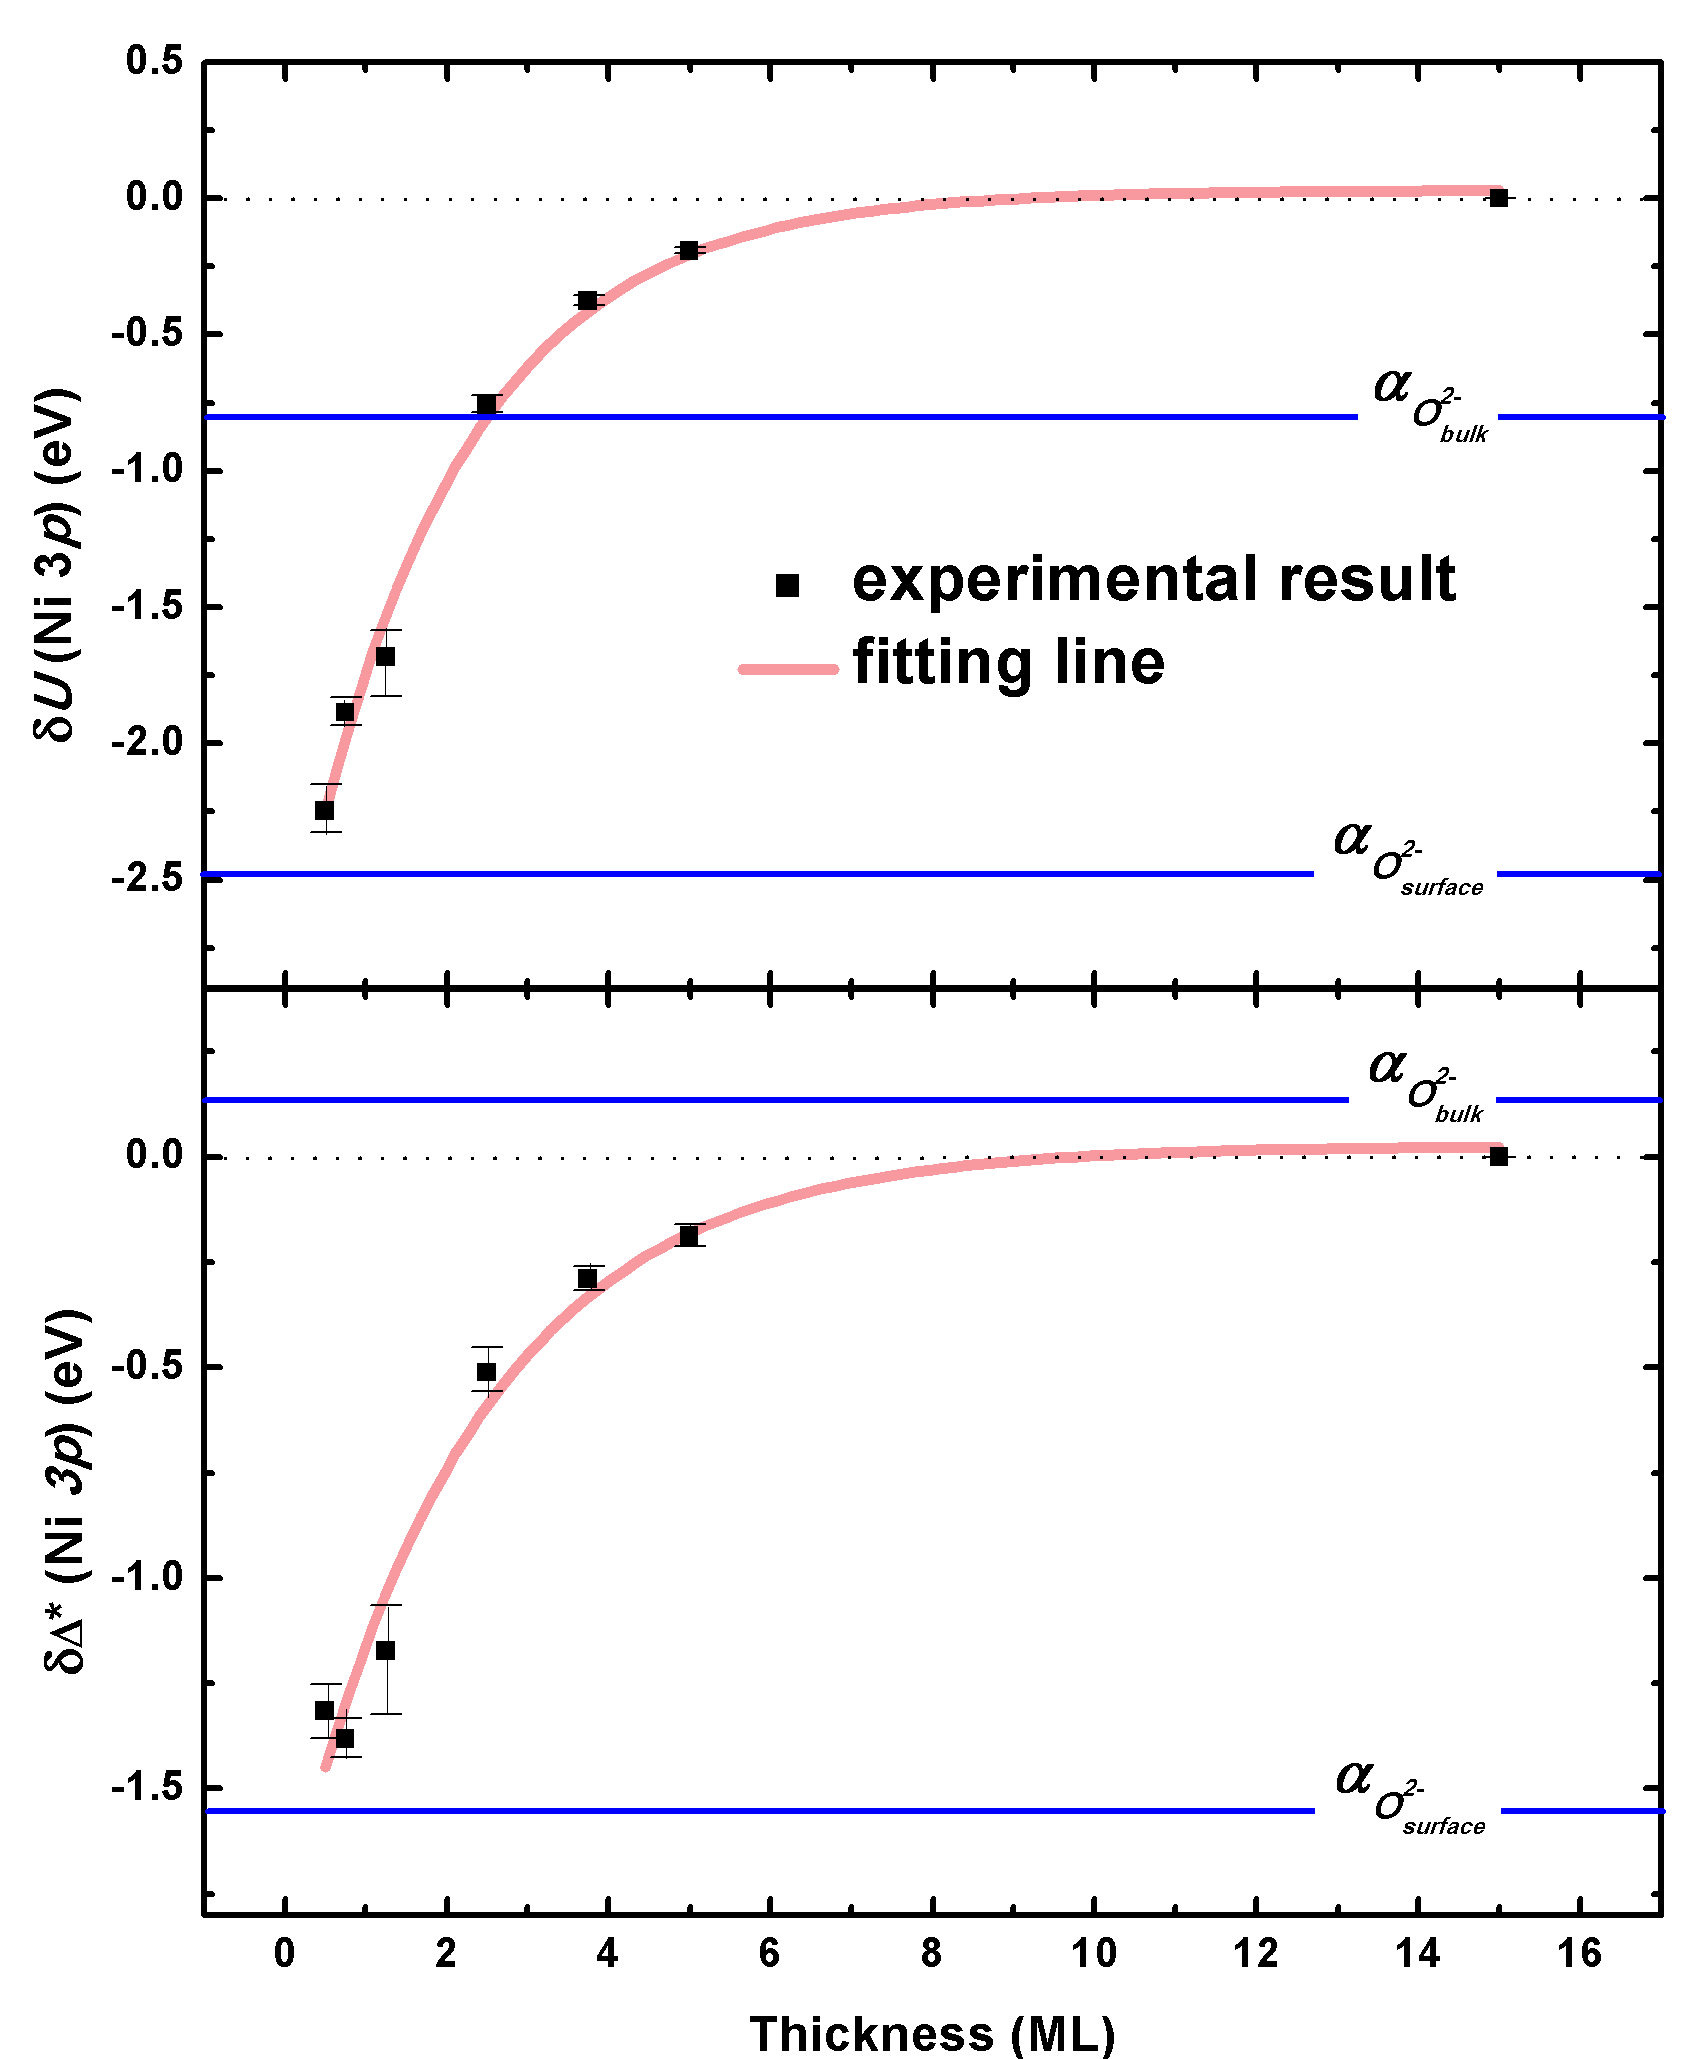
In Fig. 4 (a), the values of (Ni ) obtained from Eq. (2) are plotted relative to the value for the 15 ML film. (Ni ) decreases monotonically as the film becomes thin, as is the case for (Mg ) of ultrathin MgO films on Ag(001). However, (Ni ) changes very rapidly with increasing film thickness and is already negligible for films thicker than 5 ML. This behavior is in contrast to that of MgO films on Ag(001)Altieri , which exhibit substantial even for 10 ML (although both MgO and NiO of films have similar values for 1 ML coverage, as shown in Fig. 4 (a)). This is attributed to the larger polarizabilities (O2-) and (Ni2+) of NiO compared with MgO. In the bulk state, (O2-) of NiO (1.98 Å3) is larger than that of MgO (1.65 Å3). Furthermore, (Ni2+) 0.68 Å3, which is much larger than (Mg2+) 0.09 Å3 for MgO, possibly due to its closed-shell nature. The larger polarizabilities of NiO should make the screening of extra charges in the cation more effective, so extra-atomic relaxation should be more localized in NiO films than in MgO films. Hence, in response to charge fluctuation, NiO films exhibit bulk-like behavior at smaller thicknesses than MgO films. Note that for Fe2O3, (O2-)bulk is 2 2.91 Å3 (Ref. Raymond ), which is even larger than that of NiO. Thus, for the oxide film, the coverage at which nonzero is observed would be further limited according to the above argument, possibly below the experimental limit, as Chambers and DroubayChambers did not observe any for ultrathin Fe2O3 films on Pt(111). These authors also attributed the absence of to the large polarizabilities of the oxide.
The shifts of peak positions summarized in Fig. 3 can be suspected to originate from band bending due to charge transfer at the interface between the NiO film and Ag substrate. However, the amount of peak shift varies for different transitions in the same film, as Fig. 3 indicates. Hence, the peak shifts cannot be attributed to band-bending effects. Furthermore, hybridization between the NiO film and the Ag substrate at the interface is shown to be very weak by photoelectron spectroscopy of the valence bands of the filmselectronic , and this is also predicted by first principle calculations.Casassa
IV Discussion
| (Å3) | Bulk: 1.98 (Ref. Iguchi ; Nakatsugawa ; Moriceau ) | Surface: 2.43 (Ref. Iguchi ; Nakatsugawa ; Welton ) | |
|---|---|---|---|
| (Ni ) (eV) | -2.2 | ||
| (Ni ) (eV) | -1.3 | ||
| (eV) | 6.50 | ||
| (eV)) | Bulk | -12.20 | |
| 1 ML | -8.18 | ||
| (Ni ) (eV) | -2.48 | ||
| (Ni ) (eV) | -1.55 | ||
We investigate whether the extra-atomic relaxation represented by both and can account for the reduction of for the NiO films, as well as for the 1 ML MgO film on Ag(001).Altieri Because it is not easy to acquire layer-resolved values experimentally for films thicker than 2 ML, we calculated , , and thus only for a 1 ML film. is obtained from the following relationAltieri ,
| (3) |
where and are both chosen to be positive, following the convention of Altieri et al.Altieri
The contribution of to (Ni ) is obtained by comparing a two-hole state, Ni , with two one-hole states, Ni . Hence, is the difference between (2e)) for and two one-hole states 2e), corresponding to . Here, is the distance between a real charge and its image in the Ag substrate. By the analysis of image potential surface states on clean Ag(001), the image plane is located 1.26 Å above the Ag atoms in the surface layer.Smith As a result, the Ni atoms are separated from the image plane by 1.11 Å.Groppo Thus, according to Eq. (2), contributes eV to for a 1 ML film, assuming that Eimage is null for bulk NiO.
is determined by the difference between the polarization energies of oxide for a two-hole state and two singly charged holes: - 2 . For the calculation of bulk , we employ the polarizabilities (O2-, Ni2+) of bulk NiO, (O, Ni)bulk, while the polarizabilities of both O and Ni at the surface of bulk NiO, (O, Ni)surface, are used to calculate of the 1 ML film. For (O, three values have been reported: 1.49, (Ref. Kress ), 1.98 (Ref. Iguchi ; Nakatsugawa ; Moriceau ), and 2.64 (Ref. Janssen ) Å3. Among these, 1.98 Å3 is widely accepted. A value of 2.43 has been reported for (O (Ref. Iguchi ; Nakatsugawa ), which best fits the LEED I/V (spot intensity versus electron energy) of a bulk-terminated NiO(001) surface.Welton (Ni is obtained from the empirical relationship (O2-) + (Ni = 2.66 Å3. (Ref. Iguchi ; Nakatsugawa ) This relationship was obtained for bulk NiO, but we tentatively assume that it holds down to a 1 ML film. The resulting ’s for both (O and (O are summarized in Table I, along with for 1 ML NiO film.
Using the and values in Table I, we obtain the theoretical value of for a 1 ML NiO film from Eq. (3). The experimental value of (-2.2 eV) for the nominal 0.5 ML film, which is a model system for a 1 ML film, is well reproduced by the theoretical value, -2.48 eV (See Table I and Fig. 4). This observation suggests that and are the major origins of for NiO films, as well as for MgO filmsAltieri , and reinforces the model of Duffy et al.Duffy and Altieri et al.Altieri
Altieri et al. suggested that manipulation of charge fluctuation energies of ultrathin oxide films can be used to control their physical properties, such as Néel temperature .Altieri Reduced charge fluctuation energies affect the superexchange interaction in NiO films. According to Anderson’s expression for the superexchange, the coupling constant depends on both (Ni ) and (Ni ) as follows: . Therefore, one can expect that the reduced values of (Ni ) and (Ni ) for an NiO film would lead to an increase in the superexchange interaction for the film. In line with this conjecture, Altieri et al. found that for a 3 ML NiO film on Ag(001), did not decay as much as for an NiO film on an MgO substrate (in which no image charge screening is expected, and which therefore exhibits less reduction of and ).Tjeng
To evaluate from Eq. (4), we use (Ni 3p) in place of (Ni 3d) (which is not available). The variation in has an extra-atomic origin, and thus we can expect that (Ni ) will differ little from (Ni ). We may then estimate along the lines of Altieri et al.Altieri :
| (4) |
Here, we use (Ni ) in place of (Ni ) and denote the resulting by . From the intrapolation of (Ni ) and in Fig. 4, the values of (Ni ) and for a 3 ML film are estimated to be -0.62 and -0.47, respectively. For and of bulk NiO, we use 6.5 and 4.0 eV, respectively, referring to the report of Taguchi et al.Taguchi Combining the above input, is found to be 0.0364 for a 3 ML NiO film on Ag, while for bulk NiO is 0.0252. Here, we assume the transfer integral between the anion O and the cation Ni is the same for both bulk and the 3 ML film, as is a very local property and is assumed to be little influenced by extra-atomic effects.
We can now estimate for a 3 ML film in the mean field approximation. In the mean field approximation, , where S is the spin moment of an Ni ion, and N the mean number of nearest neighbors of Ni ions. Then,
| (5) |
For a bulk-like thick NiO film on Ag(001), was experimentally determined to be 535 K.Tjeng 1.90 (Ref. Cheetham ) and 2.2 (Ref. Fernandez ; Neubeck ) have been reported for the total magnetic moment of bulk NiO. First principle calculations predict that of a 3 ML NiO film on Ag(001) reduces to 1.67 (the average of the moments of the 1st, 2nd, and 3rd layers).Cinquini If the ratio of the orbital moment to the spin moment is assumed to be the same (0.34) (Ref. Fernandez ; Neubeck ) for both bulk and film, is 0.81 (Ref. Cheetham ) or 0.94 (Ref. Fernandez ; Neubeck ), and is 0.71. The mean number of nearest neighbors of a 3 ML film is 9.33. If all this input is taken into account, then according to Eq. (6), is between 400 and 498 K for a 3 ML NiO film on Ag(001). The wide variation in originates mainly from the large uncertainty in the spin moment of bulk NiO. The experimentally determined of a 3 ML NiO film is 390 KTjeng , which is close to the range of the present estimate. Despite the many simplifications and assumptions, (Ni ) and (Ni ) seem to provide a reasonable estimate of the range of for an NiO film under the mean field approximation. Most importantly, the lower limit of the present estimate (400.00 K) is still much higher than the 40 K observed for a 3 ML NiO film on an MgO substrate.Tjeng At the very least, this supports the argument that the reduction of charge fluctuation energies on a polarizable substrate gives rise to high values of (as observed for the 3 ML NiO film on Ag(001) in comparison with the results for MgO(001)).
V Summary and Conclusion
Using both photoelectron spectroscopy and Auger electron spectroscopy, we found that the on-site Coulomb interaction energy of ultrathin NiO films on Ag(001) decreases monotonically in a manner analogous to the case of ultrathin MgO films on Ag(001). The observed value of (Ni ) for a 1 ML film was well reproduced by considering extra-atomic relaxations represented by image charge screening by the Ag substrate and modified polarization energy of the film, thus affirming the pictures of Duffy et al.Duffy and Altieri et al.Altieri Furthermore, using (Ni ), we estimated the value of TN for a 3 ML NiO film on Ag(001), and the estimate was comparable to experimental observation. Hence, the model proposed by the aforementioned authors seems to offer a unified picture of the variation in charge fluctuation energies of ultrathin MgO and NiO films, even though further refinement is necessary in view of the many assumptions/estimations employed without precise quantitative justification.
VI Acknowledgement
This work was supported by the KOSEF grant No. R01-2007-000-20249-0 and the NRF grant No. 20110004239.
References
- (1) D. M Duffy, and A. M. Stoneham, J. Phys. C, 16, 4087 (1983).
- (2) S. Altieri, L. H. Tjeng, F. C. Voogt, T. Hibma and G. A. Sawatzky, Phys. Rev. B 59, R2517 (1999).
- (3) S. A. Chambers and T. Droubay, Phys. Rev. B 64, 075410 (2001).
- (4) J. Zaanen, and G. A, Sawatzky, Phys. Rev. Lett. 55, 418 (1985).
- (5) G. Lee, and S.-J. Oh, Phys. Rev. B 43, 14674 (1991).
- (6) M. Taguchi, M. Matsunami, Y. Eguchi, A. Chainani, Y. Takata, K. Tamasaku, Y. Nishino, T. Ishikawa, H. Ohashi, and S. Shin, Phys. Bev. Lett. 100, 206401 (2008).
- (7) T. Bertrams, and H. Neddermeyer, J. Vac. Sci. Technol. B, 14, 1141 (1996).
- (8) J. Wollschlager, D. Erdos, H. Goldbach, R. Holpken, and K. M. Schroder, Thin Solid Films 400, 1 (2001).
- (9) M. Caffio, B. Cortigiani, G. Rovida, A. Atrei, and C. Giovanardi, J. Phys. Chem. B, 108, 9919 (2004).
- (10) S. Altieri, M. Finazzi, H. Hsieh, M. W. Haverkort, H.-J. Lin, C. T. Chen, S. Frabboni, G. C. Gazzadi, A. Rota, S. Valeri, and L. H. Tjeng, Phys. Rev. B 79, 174431 (2009).
- (11) H. N. Hwang, H.-S. Kim, B. Kim, C.-C. Hwang, S. W. Moon, S. M. Chung, C. Jeon, C.-Y. Park, K. H. Chae, and W. K. Choi, Nucl. Instr. and Meth. A 581, 850 (2007).
- (12) S. Yang, and J.-S. Kim, J. Korean Phys. Soc. 56, 659-665 (2010).
- (13) S. H. Phark,Y. J. Chang, and T. W. Noh, and J.-S. Kim, Phys. Rev. B 80, 035426 (2009).
- (14) S. Yang, S. Seong, and J.-S. Kim, J. Korean Phys. Soc. 57, 1312-1316 (2010).
- (15) S. Casassa, A. M. Ferrari, M. Busso, and C. Pisani, J. Phys. Chem. B 106, 12978 (2002).
- (16) M. Raymond and S. S. Hafner, Phys. Rev. B, 1, 979 (1970).
- (17) N. V. smith, C. T. Chem, and W. Weinert, Phys. Bev. B 40, 7565 (1989).
- (18) E. Groppo, C. Prestipino, C. Lamberti, R. Carboni, F. Boscherini, P. Luches, S. Valeri, and S. D’Addato, Phys. Rev. B 70, 165408 (2004).
- (19) W. Reichardt, V. Wagner, and W. Kress, J. Phys. C: Solid State Phys. 8, 3955 (1975).
- (20) E. Iguchi, and H. Nakatsugawa, Phys. Rev. B 51, 10956 (1995).
- (21) H. Nakatsugawa, and E. Iguchi, Surf. Sci. 357, 96 (1996).
- (22) P. Moriceau, A. Lebouteiller, E. Borders, and P. Courtine, Phys. Chem. Chem. Phys. 1, 5735 (1999).
- (23) G. J. M. Janssen, and W. C. Nieuwpoort, Phys. Rev. B 38, 3449 (1988).
- (24) M. R. Welton-Cook, and M. Prutton, J. Phys. C 13, 3993 (1980).
- (25) A. K. Cheetham and D. A. O. Hope, Phys. Rev. B 27, 6964 (1983).
- (26) V. Fernandez, C. Vettier, F. De Bergevin, C. Giles, and W. Neubeck, Phys. Rev. B 57, 7870 (1998).
- (27) W. Neubeck, C. Vettier, V. Fernandez, F de Bergevin, and C Giles, J. Appl. Phys. 85, 4847 (1999).
- (28) F. Cinquini, L. Giordano, G. Pacchioni, A. M. Ferrari, C. Pisani, and C. Roetti, Phys. Rev. B 74, 165403 (2006).