Glass-like ordering and spatial inhomogeneity of magnetic structure in Ba3FeRu2O9 : The role of Fe/Ru-site disorder
Abstract
Several doped 6 hexagonal ruthenates, having the general formula BaRu2O9, have been studied over a significant period of time in order to understand the unusual magnetism of ruthenium metal. However, among them, the =Fe compound appears different since it is observed that unlike others, the 3 Fe ions and 4 Ru ions can easily exchange their crystallographic positions and as a result many possible magnetic interactions become realizable. The present study involving several experimental methods on this compound establish that the magnetic structure of Ba3FeRu2O9 is indeed very different from all other 6 ruthenates. Local structural study reveals that the possible Fe/Ru-site disorder further extends to create local chemical inhomogeneity, affecting the high temperature magnetism of this material. There is a gradual decrease of 57Fe Mössbauer spectral intensity with decreasing temperature (below 100 K), which reveals that there is a large spread in the magnetic ordering temperatures, corresponding to many spatially inhomogeneous regions. However, finally at about 25 K, the whole compound is found to take up a global glass-like magnetic ordering.
PACS number(s): 75.50.Lk, 74.62.En, 78.30.Ly
I Introduction
Ruthenium based oxides have been drawing attention of the community for quite some time because they are the most salient examples of unusual 4 magnetism. One of the most well discussed compounds among the ruthenates in this regard is SrRuO3, srruo3_prb which has an orthorhombic structure (Space group: ) and exhibits ferromagnetism below a Curie temperature () of 160 K. Interestingly, the analogous CaRuO3 does not order magnetically down to the lowest temperature caruo3_para_PRB even though the crystal structure is similar to SrRuO3. However, structurally BaRuO3 is an exotic system, which is known to adopt at least four different crystal structures depending on the synthesis conditions. baruo3_PNAS Among these four structures, the most recently reported cubic polymorph stabilizes only at a very high pressure and shows ferromagnetic ordering below 60 K. baruo3_PNAS The other three polymorphs are all hexagonal, having differences in octahedral connectivities along the -axis, and all of them exhibit paramagnetic behavior. Cava_PRB ; zhao_JSSC The common factor between these three hexagonal polymorphs is the existance of two different octahedral sites for Ru ions in the crystal structure, giving rise to simultaneous presence of Ru-Ru and Ru-O-Ru connectivities. As a result, this particular structural geometry offers a unique opportunity to introduce different metal ions in one of these two octahedral sites and to probe the onset of various possible magnetic interactions involving ruthenium. Based on this idea, the structure and magnetic properties of different metal ruthenates Ba3Ru2O9 (rd Ru replaced by in BaRuO3) were scrutinized, where is varied from transition metals e.g. Ti, Mn, Fe, Co, Ni, Cu, Zn, and Cd, verdoes_AC ; Schaller_MRB ; zhao_JSSC1 ; donohue_IC ; Battle_JSSC ; Cava_JSSC ; Cava_PRB1 ; darriet_JSSC to 4 lanthanides e.g. La, Nd, Sm, Eu, and Lu, doi_JSSC ; doi_JSSC1 to alkali and alkaline earth metals like Li, Na, Mg, Ca, and Sr, darriet_JSSC ; loye_JACS ; CaRu2_JAC and more.
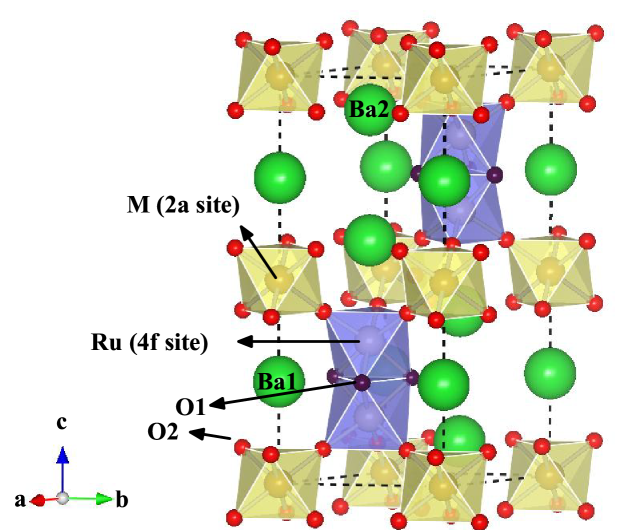
BaRu2O9 adopts the hexagonal BaTiO3 structure (6) (Fig. 1), which consists of a pair of face-shared octahedra (blue, Wyckoff notation: 4) and a single octahedron, connecting two such pairs (yellow, Wyckoff notation: 2) through corners. Henceforth, these two sites will be referred to as P and Q-sites, respectively. Interestingly, it has been observed that the foreign ions () usually show a clear affinity towards the Q-site, verdoes_AC ; Schaller_MRB ; zhao_JSSC1 ; donohue_IC ; Battle_JSSC ; Cava_JSSC ; Cava_PRB1 ; darriet_JSSC ; doi_JSSC ; doi_JSSC1 ; loye_JACS ; CaRu2_JAC forcing the Ru ions to occupy the P-site. In fact, it is this particular site preference of the cations that leads to the choice of the chemical composition BaRu2O9, where the two P-sites and the one Q-site are completely occupied by the Ru and the -ions, respectively. This naturally results in a direct Ru-Ru correlations within the two P-sites and Ru-O-M interactions involving Ru in a P-site and the metal ion in a Q-site. One advantage of these doped compounds is that unlike the undoped 6 BaRuO3, most of them could be synthesized under ambient pressure. The distance between the Ru ions within the pair of P-sites varies between 2.5 to 2.7 Å depending on the oxidation state and ionic radius of the ion, which is even smaller compared to the interatomic separation in pure Ru metal. As a result of this, the magnetism of the compounds with a nonmagnetic -ion such as Ca2+, Cd2+, Mg2+, In3+, Y3+ is mostly dominated by the Ru-Ru antiferromagnetic interaction within the isolated Ru2O9 dimer (pair of blue octahedrons in Fig. 1). doi_JSSC ; darriet_JSSC However, the scenario changes significantly in the case of intervening magnetic -ions such as Co2+, Ni2+ or Cu2+ occupying the Q-site, where a 3-dimensional antiferromagnetic order is realized involving both as well as Ru ions. Cava_JSSC ; Cava_PRB1
Among this ample variety of doped hexagonal ruthenates, Ba3FeRu2O9 (BFRO) is a unique member of 6H ruthenates family, due to the fact that unlike most other metals, the Fe ion does not show such exclusive affinity towards the Q-site and can actually occupy the P-site with relative ease. Cava_JSSC As a result there is substantial Fe/Ru site disorder in this compound and consequently, additional Ru-Fe and Ru-O-Ru configurations, other than the expected Ru-Ru and Fe-O-Ru correlations, also get activated in this compound, making the system magnetically more complex. However, despite of the peculiarities in this system, there are very few experimental reports on it, Cava_JSSC ; Cava_PRB1 and a detailed, comprehensive study is still missing.
In this paper, we report results of detailed magnetic characterization on BFRO along with the results of long and short range structural studies. Collectively, these results help to determine the true structure-property relationship for BFRO. It appears that many competing magnetic interactions come into play in this system due to Fe/Ru disorder, giving rise to strong magnetic frustration. As a result of this, a global ‘glass’-like order sets in at low temperatures. Interestingly, additional magnetic responses are found to exist over a large temperature range above this glass transition temperature. The structural information obtained from XRD and NPD (x-ray and neutron powder diffraction) and XAFS (x-ray absorption fine structure) indicate that the viability of Fe and Ru ions occupying the P and Q sites not only results in site disorder within a unit cell but also extends much beyond giving rise to ”clustering” with several inhomogeneous Fe and Ru rich regions. It is observed that this extended chemical inhomogeneity play an important role in generating magnetic metastabilities in the system much above the glass-like transition temperature.
II Experimental details
Stoichiometric amounts of BaCO3, Fe2O3 and RuO2 were ground in agate mortar and the mixture was calcined at 9000 C for 12 h. The calcined material was heated at 11500 C for 72 hrs in oxygen atmosphere with several intermediate grindings. The phase purity as well as the crystal structure of the sample was probed by means of powder x-ray diffraction (XRD) in a Bruker AXS: D8 Advanced x-ray diffractometer equipped with Cu radiation. The neutron powder diffraction (NPD) measurements were carried out on powder samples using the multi-position sensitive detector based focusing crystal diffractometer set up by UGC-DAE Consortium for Scientific Research Mumbai Centre at the National Facility for Neutron Beam Research (NFNBR), Dhruva reactor, Mumbai (India) at a wavelength of 1.48 Å. The samples were placed in vanadium cans that were directly exposed to neutron beam for 300 K data. For low temperature data, vanadium cans filled with the powder samples were loaded in a Cryogenics make cryogen-free magnet system. XRD and NPD patterns were analyzed using Rietveld method and the refinement of crystal structure was carried out using the JANA2000 jana2000 and FULLPROF fullprof softwares, respectively. The magnetic properties were studied in a Quantum Design SQUID magnetometer. The heat capacity was measured by relaxation method in a Quantum Design PPMS. 57Fe Mössbauer studies were carried out on powdered samples using a conventional constant acceleration spectrometer with a 57Co source. The velocity calibration was carried out using -Fe absorber and the typical line width obtained in our spectrometer was 0.28mm/s. The isomer shift (IS) reported is relative to -Fe. Ru K-edge (around 22711 eV) XAFS spectra were collected at the GILDA-BM08 (General Italian Line for Diffraction and Absorption) beamline of the European Synchrotron radiation facility (ESRF,Grenoble, France). GILDA The Ba3FeRu2O9 ceramic pellet was initially ground in an agate mortar using an automatic grinder in order to obtain fine powders which were then mixed with BN powders in the grinder for several minutes. This procedure ensures highly homogeneous samples suitable for high quality XAFS spectra. Measurements were performed in transmission mode keeping the sample at liquid nitrogen temperature in order to reduce thermal disorder in the structural XAFS signal. Two scans were collected and averaged in order to improve the signal to noise ratio. Standard procedures were adopted for data normalization and extraction of the structural signal ( ), and the quantitative analysis of the XAFS spectrum has been performed including single and multiple scattering terms along the lines already described monesi2005 using ESTRA and FITEXA programs. The weighted XAFS signal was Fourier filtered in the Å range and the Filtered spectrum was refined in the Å-1 range. In the fit, theoretical amplitude and phase functions were calculated using FEFF 8.2 code, feff for atomic clusters generated using the data of XRD and NPD data refinements. In the refinement of the XAFS data, particular care has been devoted to the next neighbour shells since the relative multiplicity of A-B (around 2.6 Å) and A-O-B (around 4 Å) (A,B = Fe/Ru) are directly related to the local chemical order around Ru ions. It is noticeable that RuOFe and RuORu contributions have largely different amplitude and phase functions, therefore giving a good chemical selectivity in the analysis.
III Result and discussions
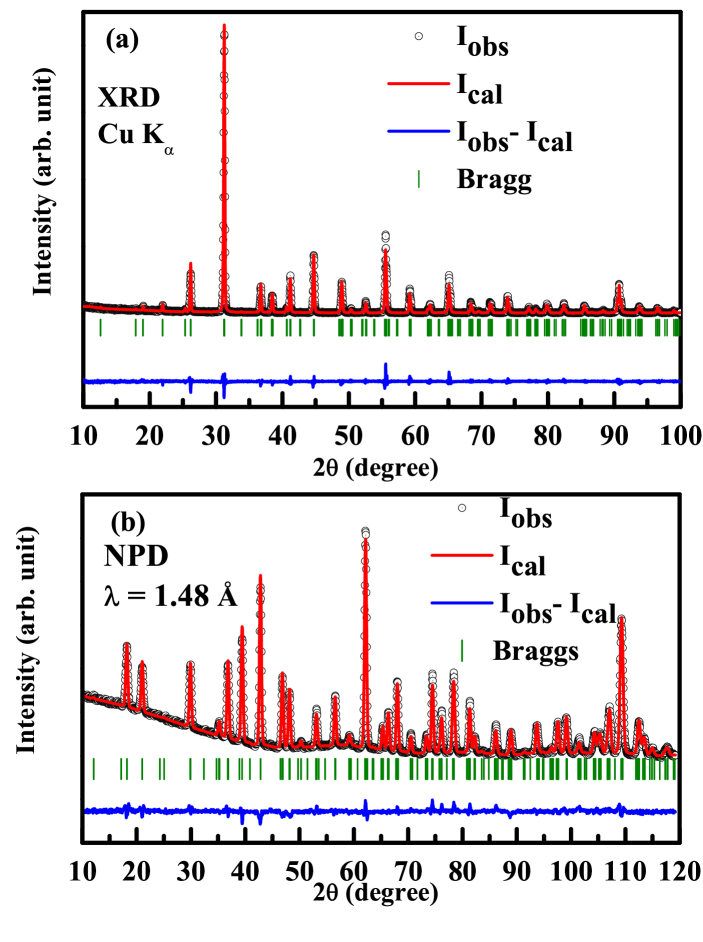
Powder XRD data collected from polycrystalline BFRO (Fig. 2(a)) confirms complete phase purity. All the peaks in the XRD pattern could be satisfactorily indexed and refined (red curve) with 6 layered hexagonal (6) crystal structure having space group 6. A similar result was obtained from the refinement of the powder neutron diffraction data collected at room temperature (Fig. 2(b)). However, the initial attempt to refine the XRD pattern assuming perfect Fe/Ru ordering i.e. complete occupancy of Fe at the 2 (Q) site and Ru in 4 site (P) did not yield satisfactory results. Consequently, each crystallographic position, 2 and 4, was set as jointly occupied by Ru and Fe with constrains of total position occupancy equal to 100% and keeping similar ADPs (atomic displacement parameters). This correction significantly improved the refinement, leading to mix occupancy of both positions. In the final stage of refinement the ADPs for each type of atoms were set to the values extracted from NPD data and not further refined. The refinement finally led to the formula Ba3Fe1.05(2)Ru1.95(2)O9, indicating minor loss of Ru in the sample. Neutron data refinement resulted in similar distribution of Fe and Ru over two crystallographic positions, however with higher standard deviations compared to XRD. This is not surprising keeping in mind the difference in the scattering factors for XRD and NPD. For XRD Ru (44) has almost twice the scattering power compared to Fe (26), while for NPD their scattering lengths are more close, 7.0 fm (Ru) and 9.4 fm (Fe). The refined structural parameters and the most significant bond lengths and angles are listed in Table I and II, respectively. The refinement of room temperature XRD data shows that 71% of the Q-site is occupied by Fe atoms and the rest (29 %) are occupied by Ru atoms. On the contrary the 83 % of the P-sites is occupied by Ru atoms and 17 % by Fe atoms. The interatomic distance between two Ru ions (Ru-Ru) in the Ru2O9 dimer is 2.631 Å which is longer than that in RuO9 dimer doi_jmatchem but shorter than that in RuO9 dimer. Cava_JSSC This indicates that the average valency of Ru ions lies between 4 and 5 in this compound, as is also expected from simple electron counting.
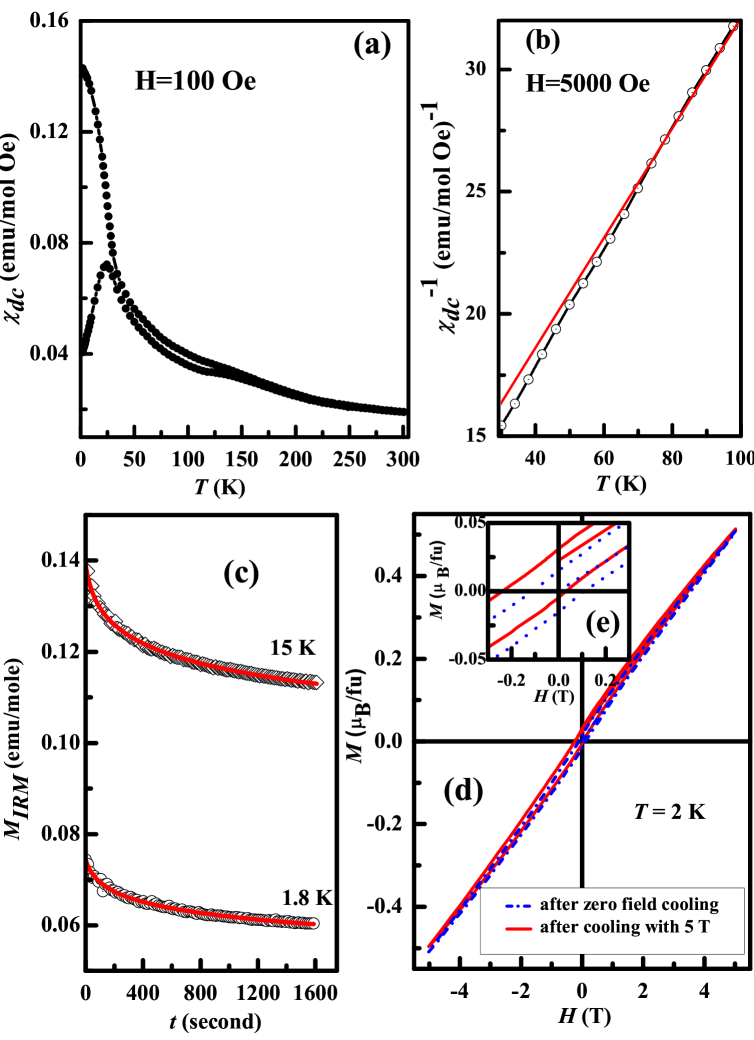
Next, we focus on the magnetic properties of this compound, which have not been reported in detail till date. In Fig. 3(a), we show the FC (field cooled) and ZFC (zero field cooled) magnetization curves as a function of temperature for BFRO, measured with 100 Oe applied field. The sample was cooled from 300 K to 2 K in absence of field for ZFC and in presence of 100 Oe field for FC, while both ZFC and FC data were taken during heating from 2 K to 300 K with 100 Oe field. It is observed that the FC and ZFC curves start to diverge from relatively higher temperatures and show a broad peak around 140 K. However, both FC and ZFC magnetization continue to increase with lowering temperature, and ZFC curve again exhibits a peak around 25 K. It is important to note here that the broad peak at the higher temperature, almost smears out in susceptibility measurements under comparatively higher field (not shown here). Moreover, the inverse susceptibility data measured in a magnetic field of 5 kOe applied field (Fig. 3(b)) clearly diverges from the standard Curie-Weiss behavior below 80 K. The high temperature linear fitting of the inverse susceptibility yields a value of -43 K, which indicates presence of antiferromagnetic interactions in the system. Such divergence in the FC-ZFC magnetization and also the deviation from the Curie-Weiss behavior at higher temperature establish that certain magnetic metastabilities develop much above the 3-dimensional global magnetic ordering sets in ( 25 K). Mydosh_PRB
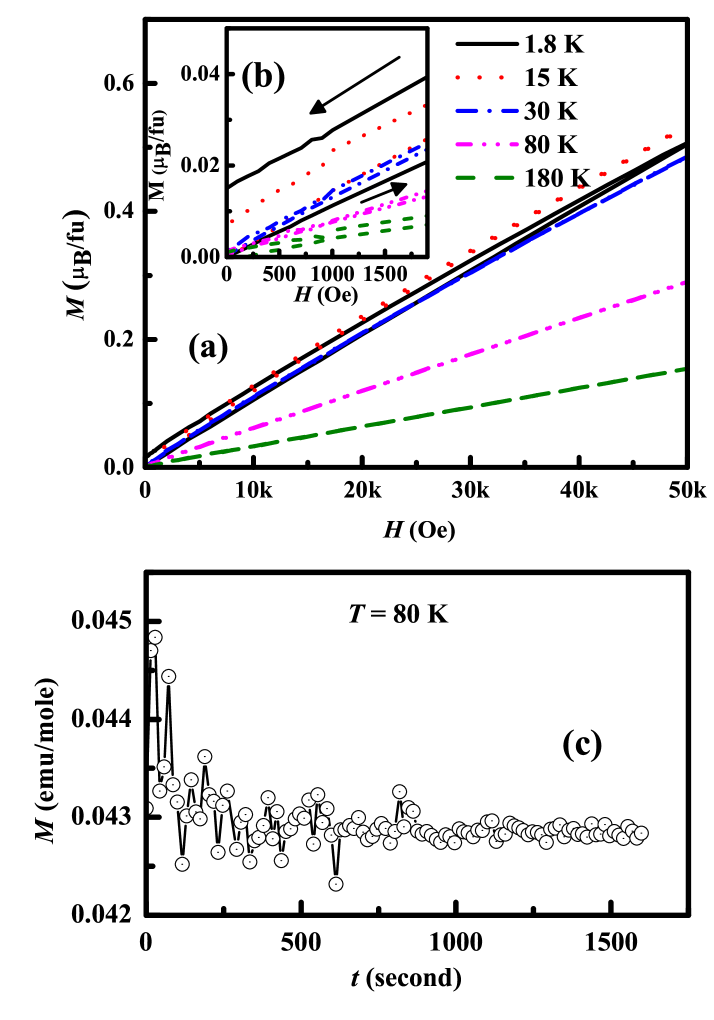
It is to be noted that the compounds with = Cu, Ni, Co etc. exhibit very different low temperature magnetic structures Cava_PRB1 compared to their Fe-analogue. Earlier neutron diffraction studies described long range antiferromagnetic structures Cava_JSSC for the Cu, Co and the Ni compounds at low temperature, while for the Fe analogue it had been mentioned that the Fe/Ru disorder gives rise to complex magnetic interactions. For example, presence of a variety of local magnetic configurations Cava_PRB1 and absence of any magnetic ordering in the neutron diffraction measurements Cava_JSSC have indeed been discussed before. Therefore, the magnetic structure of BFRO develops differently as a result of the Fe/Ru site disorder. In order to confirm the nature of the magnetic order at low temperatures, isothermal remanent magnetization (IRM) measurements have been carried out on BFRO. For this purpose, each time the sample was cooled from 300 K in zero field to the measuring temperature, 5 kOe field was applied for 5 minutes, and then M was noted as a function of time (t) immediately after the field was switched off. The results are shown in Fig. 3(c). For T= 1.8 K and 15 K, MIRM undergoes a slow decay, indicative of a glassy behavior in the system. The IRM at these two temperatures can be fitted well with the logarithmic function, MIRM=M0-Sln(1+t/t0), as shown by red solid lines in Fig. 3(c). The logarithmic time dependence of the IRM is observed in magnetic materials with hysteretic magnetization and/or glassy systems. magneticrelaxation_EVS ; Nd2PtSi3_ssc Generally, materials with high coercivity show a pronounced time dependent behavior, however, if the applied field is higher than the coercive field the relaxation is attributed to glass-like behavior. Here, at 1.8 K the coercive field is 1140 Oe (Fig. 3(d)), whereas the relaxation measurements were performed after the application of 5 kOe field, which is much higher than the coercive field. Hence, the strong relaxation effects in this case are obviously of microscopic rather than macroscopic (domains) in origin. Ho5SiGe_PRB The values of the viscosity coefficient S are 0.0037 emu/mole and 0.0067 emu/mole for 1.8 K and 15 K, respectively. These IRM measurements indicate that unlike the Cu, Co, or Ni compounds, Ba3FeRu2O9 undergoes a ‘glass’-like transition with lowering temperature.
In panel 3(d), the ZFC as well as FC (cooled under 50 kOe applied field) M vs. H loops of BFRO at 2 K are shown. The ZFC () curve shows a clear hysteresis loop with coercivity of 1140 Oe but without any signature of saturation till the highest field of measurement. Interestingly, such loops are not uncommon among spin glasses e.g. the well known canonical spin glass alloys, CuMn or AgMn, also exhibit identical hysteresis loop at low temperatures. kouvel_61_JPCS The absolute value of M at 50 kOe magnetic field is found to be only 0.51 B/f.u. (formula units), indicating presence of a significant number of uncorrelated spins. However, the most fascinating feature of this measurement is the large shift of the low temperature () loop collected under field-cooled condition. However, observation of such ‘exchange bias’ effect is also common in the well known spin glass alloys, which arises due to the coexisting ferro- and antiferromagnetic interactions between the magnetic ions, placed at different separations because of the intrinsic composition fluctuation. kouvel_60_JAP ; kouvel_61_JPCS ; kouvel_63_JPCS ; kouvel_NiMn_59_JPCS ; kouvel_84_JAP ; Wu_91_JAP Therefore, similar spatially varying chemical fluctuations might exist also in BFRO, which results in such resemblances with the magnetic behaviors of other canonical spin glass metallic alloy systems.
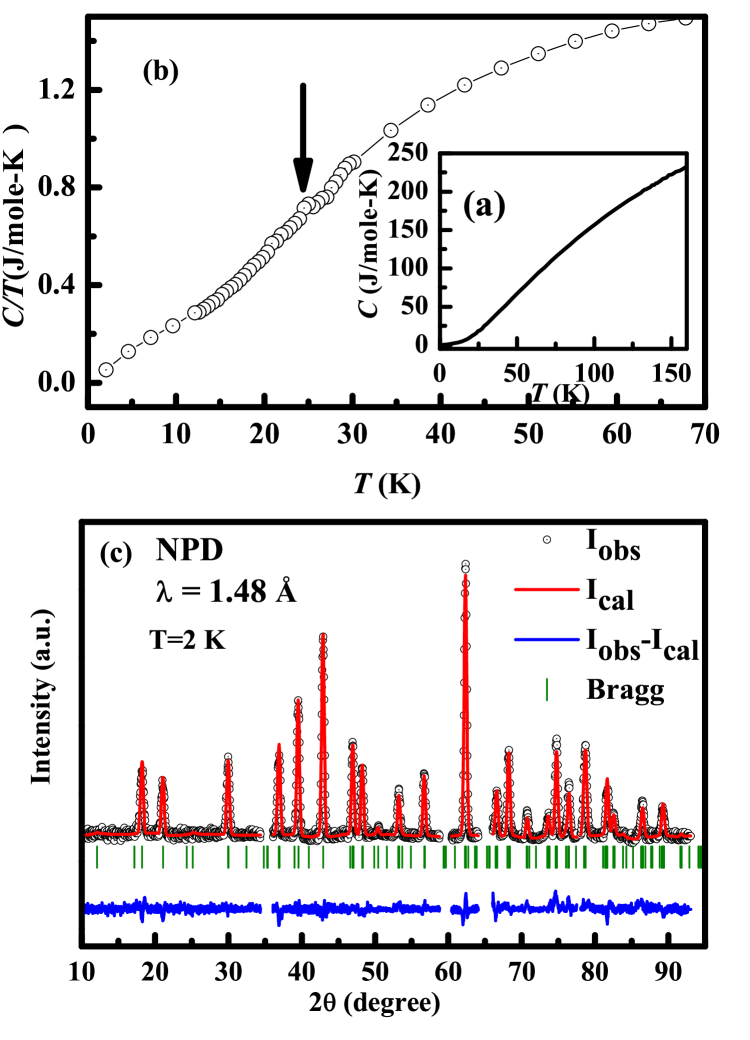
Identification of the low temperature magnetic transition as a transition to a ‘glass’-like magnetic phase is further realized by the temperature dependent heat capacity (C) measurements. It is well known that spin glass transitions do not produce any sharp feature in the C vs. measurement, Wenger_C_PRB ; Uemara_C_PRB ; EVS_C_PRB1 ; EVS_C_PRB2 because above a few Kelvin temperature, the non-magnetic contributions to seems to overwhelm the magnetic or spin-glass terms. However, there are suggestions of extracting the signature of the ‘freezing’ phenomena from the C/T (=d/d) vs. T plots instead, Mydosh_book but even in such attempts only a very weak feature could be observed near the freezing temperature. In the present case, it is noticed that C gradually decreases as T decreases down to 1.8 K without any evidence for any well defined peak characterizing a long range magnetic order, as shown in Fig. 4(a). However, when the data is plotted in the form of C/T vs. T, a very weak feature could be seen at 25 K as indicated by an arrow in Fig. 4(b). The small size of this feature indicates that the entropy change associated with the transition is very small, as expected in a glassy transition with randomness in magnetic interactions. Further, the NPD data at 2 K (Fig.4(c)) exhibit neither any significant change in any peak intensity nor the development of any additional peaks compared to those at room temperature, signifying the fact that at 2 K, the magnetic phase is neither ferromagnetic nor antiferromagnetic (within the resolution of the instrument). The spectral pattern is modified at certain angles due to the interference from the magnet shroud and those 2 regions are excluded from refinement. In this refinement, the occupancies of Ru and Fe at the 2 and 4 sites were kept fixed at the values obtained from the refinement of room temperature NPD data. All peaks of the observed pattern were reproducible in the refinement with space group 6 without any significant magnetic contribution. This result clearly confirms that there is no structural transition at low temperature and also the magnetic transition at 25 K does not led to any long range magnetic ordering. Therefore, the heat capacity and the NPD results presented in Fig. 4 with the description that the low temperature magnetic transition observed in this system is probably a glassy one.
Now, it has been shown above (Fig. 3) that magnetic metastabilities exist much above the glass transition temperature. Therefore, next we concentrated on measurements above 25 K in order to understand the high temperature magnetic structure of the system. The M vs. H were measured at different temperatures and are shown in Fig. 5(a). For better visual clarity we have plotted only the first quadrant of the loop and to focus on the remanent magnetization, we have plotted the same data in Fig 5(b) in an expanded scale. For each temperature, the loop has two branches, one from 0 Oe to 50 kOe and other from 50 kOe to 0 Oe as indicated by arrows for 1.8 K data in Fig. 5(b). At 1.8 K, there is a remanent magnetization of 0.015 B/f.u., which lowers down to 0.007 B/f.u. at 15 K. The hysteresis loops measured at 30 K and higher hardly show any remanent magnetization, indicating near hysteresis loss above 25 K. However, IRM measurement at 80 K exhibits a small remanence which remained almost constant with time, as shown in Fig. 5(c). The magnitude of this constant IRM at 80 K is approximately 0.0425 emu/mole which is small but not absolutely negligible considering the fact that the value of IRM is only 0.1375 emu/mole at t=0 at 15 K. Therefore, the higher temperature magnetic data reveal contradictory behaviors such as weak but stable remanence as well as a clear deviation from the Curie-Weiss behavior below 80 K even though loss of perceptible hysteresis in M(H) curves occurs above 25 K. Again, it is worth mentioning here that such behavior, much above the spin glass transition temperature, is indeed observed in many canonical spin glass systems like the well known CuMn or AgMn metallic alloys, kouvel_60_JAP ; kouvel_61_JPCS ; kouvel_63_JPCS where the statistical compositional fluctuations inherent to atomically disordered systems have been held responsible for such magnetic features. Therefore, the observed anomalous behaviors are definite indications of many local magnetic configurations above 25 K in this case, Cava_PRB1 which might appear due to chemical inhomogeneities in the system. The origin of such inhomogeneities could be the relative distribution of Fe and Ru ions in the compound, as is revealed by XAFS measurements, discussed later.
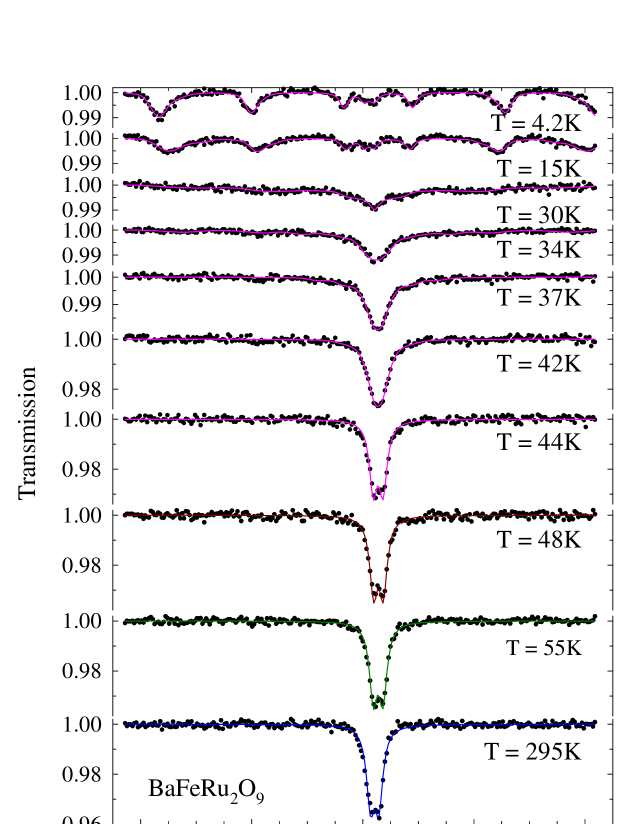
However, in order to probe the presence of such inhomogeneous magnetic ordering, we have also carried out 57Fe Mössbauer experiments at different temperatures, shown in Fig. 6. The room temperature spectrum consists of a pure quadrupolar split (e2qQ/2 = 0.3 mm/s) spectral line which indicates paramagnetic nature of the sample at room temperature. It shows an isomer shift of 0.43 mm/s with respect to Fe metal (typical of a high spin Fe3+ species) and it undergoes thermal red shift with decreasing temperature. However, at sufficiently low temperatures there is a clear decrease in intensity of the absorption line accompanied by a broadening of the line signifying the appearance of magnetic hyperfine field (see the line at 48 K or below). This loss of paramagnetic intensity could be interpreted by the formation of broad hyperfine split signal, appearing from locally ordered Fe ions at the cost of paramagnetic, uncorrelated Fe spins. As the loss in the paramagnetic intensity occurs gradually with lowering temperature, there is obviously no sharp para- to ferro- transition, reminiscent of a series of magnetic transitions. Finally, below 30 K, the paramagnetic line nearly disappears and a well resolved hyperfine split spectra typical of magnetically ordered systems appears, confirming the onset of a magnetic transition below this temperature. The magnetic hyperfine field at 4.2 K is found to be 49 T, which is similar to that observed in Fe3O4. It should be noted that even at 4.2 K, a small paramagnetic component ( 8%) is observed which may imply that some Fe ions are yet to order at this temperature. All of these observations are consistent with the inferences obtained from the magnetization studies.
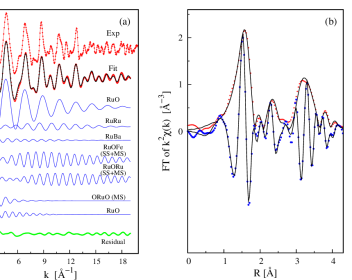
Finally, we performed XAFS studies to probe the origin of inhomogeneous magnetic structure at higher temperature. It is likely that the Fe/Ru disorder can extend further, giving rise to spatially extended regions with different Fe neighborhoods, ranging from isolated Fe atoms to extended Fe “clusters” with Fe filling both the nearest neighbor P and Q sites. Now, such different regions can order at different temperatures depending on their size and composition. Although the diffraction probes undoubtedly confirmed the Fe/Ru site disorder within an unit cell, such measurements cannot reveal different local compositions, which can be substantially different and would actually manipulate the physical properties heavily. xafs_PRL The analysis of Ru K-edge XAFS data allows us to achieve detailed insight about the local chemical structure on BFRO. Fig. 7(a) and 7(b) show the Ru -edge XAFS data, and its Fourier transform along with the respective best theoretical curves. The structural parameters obtained from XAFS analysis are presented in Table III. The most important point to note here is the fact that Ru finds higher number of Ru neighbors both in the P and Q-sites, compared to the findings of the diffraction experiments. It is to be noted that unlike XAFS, the inherent assumption for XRD or NPD refinements is that the overall chemical composition of a material must be maintained within the single unit cell. On the other hand, XAFS technique being a local probe, can provide more detailed insight on the relative arrangement of Fe and Ru ions without any such restriction.xafs_PRL In the first attempt, the XAFS data were refined constraining the P and Q site occupancies to the values obtained by diffraction data. However the quality of the XAFS data refinements definitely improves (the factor is sensibly reduced) on removing these constraints. In this way, the analysis of the Ru local environment depicts noticeable chemical inhomogeneity beyond an unit cell volume, where clear Ru-rich regions are found to be present in the system. The much larger Ru-Ru (between P-sites around 2.6 Å) and Ru-O-Ru (linking P-Q sites, around 3.9 Å) connectivities, observed in XAFS compared to the same from XRD (shown within square brackets in Table III) conclusively establish this fact. It is to be noted that Ru-O-Fe and Ru-O-Ru distances are found very similar within our experimental accuracy and might have certain errors in quantification. However, as the XAFS results clearly indicate presence of Ru-rich areas, Fe-rich regions also have to be formed in the system. Therefore, it appears that the ability of the Fe ions to fit in both the P and Q-sites not only creates Fe/Ru site disorder within a unit cell but also allows preferential clustering to occur over certain spatial domains. Obviously, such a possibility does not exist for other BaRu2O9 compounds, where the occupancy of the ions is always restricted to Q-site and no - or -O- correlations are permitted. Overall, our long range and local structural investigations prove that the microscopic chemical composition can be vastly different from assumed long range structures and also show that the Fe-member of BaRu2O9 series of compounds clearly stands out and altogether belongs to a different class with respect to other members of the family.
Now, it is possible to correlate the observed chemical ‘inhomogeneity’ with these anomalous magnetic behaviors for T 25K. It can be easily speculated that different Fe-rich regions of various spatial extents and compositions may start to order magnetically at higher temperatures, while they remain uncorrelated with respect to each other. The () curve of such a mixture fails to exhibit distinct loops but anomalies at higher temperature become visible in IRM or inverse susceptibility behaviors. However, when the temperature is lowered to 25 K, a global magnetic correlation sets in and many different possible interactions give rise to strong frustration and a 3-dimensional ‘glassy’ order.
IV Conclusion
In summary, our detailed experimental study establishes Ba3FeRu2O9 compound to be a special one with respect to other members of the family, where the possibility of Fe/Ru-site disorder gives rise to many competing magnetic interactions and as a result, a global ‘glass’-like ordering occurs at lower temperature. The random distribution of Fe and Ru ions also gives rise to spatial inhomogeneity that further complicates the magnetic structure. The Fe-rich regions start to order at rather higher temperature and probably, a distribution of magnetic transitions exist at higher temperatures.
V Acknowledgement
SM thanks CSIR, India for fellowship. SR thanks UGC-DAE CSR Mumbai Centre, DST-RFBR and DST Fast Track, India for financial support. DDS acknowledges J. C. Bose National Fellowship.
References
- (1) mssr@iacs.res.in
- (2) P. B. Allen, H. Berger, O. Chauvet, L. Forro, T. Jarlborg, A. Junod, B. Revaz, and G. Santi, Phys. Rev. B 53, 4393 (1996).
- (3) G. L. Catchen, T. M. Rearick, and D. G. Schlom, Phys. Rev. B 49, 318 (1994).
- (4) C.-Q. Jin, J.-S. Zhou, J. B. Goodenough, Q. Q. Liu, J. G. Zhao, L. X. Yang, Y. Yu, R. C. Yu, T. Katsura, A. Shatskiy, and E. Ito, Proc. Natl. Acad. Sc. 105, 7115 (2008).
- (5) J. T. Rijssenbeek, R. Jin, Yu. Zadorozhny, Y. Liu, B. Batlogg, and R. J. Cava, Phys. Rev. B 59 4561 (1999).
- (6) J.G. Zhao, L.X. Yang, Y. Yu, F.Y. Li, R.C. Yu, Z. Fang, L.C. Chen, and C.Q. Jin, J. Solid State Chemistry 180, 2816 (2007).
- (7) D. Verdoes, H. W. Zandbergen, And D. J. W. Ijdo, Acta Cryst. C 41, 170 (1985).
- (8) H. U. Schaller, A. Ehmann, and S. Kemmler-Sack, Mater. Res. Bull. 19, 517 (1984).
- (9) J.G. Zhao, L.X. Yang, Y. Yu, F.Y. Li, R.C. Yu, and C.Q. Jin, J. Solid State Chemistry 181, 1767 (2008).
- (10) P. C. Donohue, L. Katz, And R. Ward, Inorg. Chem. 5, 339 (1966).
- (11) P. Lightfoot and P. D. Battle, J. Solid State Chemistry 89, 174 (1990).
- (12) J. T. Rijssenbeek, Q. Huang, R. W. Erwin, H. W. Zandbergen, and R. J. Cava, J. Solid State Chemistry 146, 65 (1999).
- (13) J. T. Rijssenbeek, P. Matl, B. Batlogg, N. P. Ong, and R. J. Cava, Phys. Rev. B 58, 10315 (1998).
- (14) J. Darriet, M. Drillon, G. Villeneuve, and P. Hagennmuller, J. Solid State Chemistry 19, 213 (1976).
- (15) Y. Doi, K. Matsuhira, and Y. Hinatsu, J. Solid State Chemistry 165, 317 (2002).
- (16) Y. Doi, Y. Hinatsu, Y. Shimojo and Y. Ishii, J. Solid State Chemistry 161, 113 (2001).
- (17) K. E. Stitzer, M. D. Smith, W. R. Gemmill, and H. C. zur Loye, J. Am. Chem. Soc. 124, 13877 (2002).
- (18) J. Wilkens and H. Mullerbuschbaum, J. Alloys and Compounds 177, L31 (1991).
- (19) V. Petricek, M. Dusek, and L. Palatinus, JANA 2000; Institute of Physics, Academy of Science of the Czech Republic: Prague, Czech Republic, 2002.
- (20) J. Rodríguez-Carvajal, Physica B 192, 55 (1993).
- (21) SS. Pascarelli, F. Boscherini, F. D’Acapito, J. Hrdy, C. Meneghini, and S. Mobilio, J. Synchrotron Radiat. 3, 147 (1996).
- (22) C. Monesi, C. Meneghini, F. Bardelli, M. Benfatto, S. Mobilio, U. Manju, and D. D. Sarma, Phys. Rev. B 72, 174104 (2005).
- (23) S. I. Zabinsky, J. J. Rehr, A. Ankudinov, R. C. Albers, and M. J. Eller, Phys. Rev. B 52, 2995 (1995).
- (24) Y. Doi, M. Wakeshima, Y. Hinatsu, A. Tobo, K. Ohoyama, and Y. Yamaguchi, J. Mater. Chem. 11, 3135 (2001).
- (25) A. F. J. Morgownik and J. A. Mydosh, Phys. Rev. B 24, 5277 (1981).
- (26) S. Majumdar, E. V. Sampathkumaran, D Eckert, A Handstein, K-H Müller, S. R. Saha, H Sugawara and H Sato, J. Phys.: Condens. Matter 11, L329 (1999).
- (27) D. X. Li, S. Nimori, Y. Shiokawa, Y. Haga, E. Yamamoto, and Y. Onuki, Solid State Commun. 120, 227 (2001).
- (28) N. K. Singh, D. Paudyal, Ya. Mudryk, V. K. Pecharsky, and K. A. Gschneidner, Jr., Phys. Rev. B 81, 184414 (2010).
- (29) J. S. Kouvel, J. Phys. Chem. Solids 21, 57 (1961).
- (30) J. S. Kouvel, J. Appl. Phys. 31, 142S (1960).
- (31) J. S. Kouvel, J. Phys. Chem. Solids 24, 795 (1963).
- (32) J. S. Kouvel and C. D. Graham Jr., J. Phys. Chem. Solids 11, 220 (1959).
- (33) W. Abdul-Razzaq and J. S. Kouvel, J. Appl. Phys. 55, 1623 (1984).
- (34) W. Abdul-Razzaq and M. Wu, J. Appl. Phys. 69, 5078 (1991).
- (35) L. E. Wenger and P. H. Keesom. Phys. Rev. B 13, 4053 (1973).
- (36) C. R. Wiebe, J. E. Greedan, P. P. Kyriakou, G. M. Luke, J. S. Gardner, A. Fukaya, I. M. Gat-Malureanu, P. L. Russo, A. T. Savici, and Y. J. Uemura, Phys. Rev. B 68, 134410 (2003).
- (37) S. Rayaprol, K. Sengupta, and E. V. Sampathkumaran, Phys. Rev. B 67, 180404(R) (2003).
- (38) N. Mohapatra, K. K. Iyer, Su. Rayaprol, and E. V. Sampathkumaran, Phys. Rev. B 75, 214422 (2007).
- (39) J. A. Mydosh, Spin Glasses: An Experimental Introduction (London: Taylor and Francis) (1993).
- (40) C. Meneghini, Sugata Ray, F. Liscio, F. Bardelli, S. Mobilio, and D. D. Sarma Phys. Rev. Lett. 103, 046403 (2009).
The atomic positions: Ba(1): 2b(0, 0, 1/4); Ba(2): 4(1/3, 2/3, z); Ru/Fe: 4(1/3, 2/3, z); Fe/Ru: 2(0, 0, 0); O1: 6h (x, 2x, 1/4); O2: 12k(x, 2x, z)
Constrained: BBa(1)=BBa(2)
| Atom | Parameter | XRD at 300 K |
|---|---|---|
| a (Å) | 5.7310(2) | |
| c (Å) | 14.0768(8) | |
| V (Å3) | 400.396(3) | |
| Ba1 | B (Å2) | 0.5053 |
| Ba2 | z | 0.0908(1) |
| B (Å2) | 0.5053 | |
| Ru/Fe (P-site) | z | 0.8434(1) |
| B (Å | 0.3474 | |
| n | 0.833(8)/0.167(8) | |
| Fe/Ru (Q-site) | B (Å2) | 0.3474 |
| n | 0.71(1)/0.29(1) | |
| O(1) | x | 0.508(1) |
| B (Å2) | 0.4343 | |
| O(2) | x | 0.837(1) |
| z | 0.0811(5) | |
| B (Å2) | 0.4343 | |
| Rp(%) | 9.98 | |
| Rwp(%) | 15.35 | |
| 2 | 1.26 |
| XRD 300 K | ||
|---|---|---|
| Ba1-O1 6 | 2.865(7) | |
| Ba1-O2 6 | 2.879(9) | |
| Ba2-O1 3 | 2.831(8) | |
| Ba2-O2 6 | 2.869(9) | |
| Ba2-O2 3 | 2.949(6) | |
| Ru/Fe-O2 3 | 1.993(9) | |
| Ru/Fe-O1 3 | 2.056(9) | |
| Fe/Ru-O2 6 | 1.984(8) | |
| Ru/Fe-O (average) | 2.025 | |
| Ru/Fe-Ru/Fe | 2.631(2) | |
| Ru/Fe-O1-Ru/Fe | 79.55(6) | |
| Ru/Fe-O2-Fe/Ru | 177.09(9) |
| Shell | N | R (Å) | Å2) |
|---|---|---|---|
| RuO | 6 | 1.976(6) | 2.9(2) |
| RuRu | 0.89(4) [0.69] | 2.61(1) | 4.5(6) |
| RuFe | 0.11 [0.31] | 2.62(1) | 5.5(4) |
| RuBa | 7.6(2) | 3.49(1) | 7.2(4) |
| RuORu | 2.4(1) [0.91(8)] | 3.91(2) | 3.3(3)) |
| RuOFe | 1.9(1) [2.33(2)] | 3.92(2) | 1.6(2) |
| ORuO | 6 | 3.90(2) | 3.6(9) |
| RuO | 20(2) | 4.56(2) | 15.(5) |
| R2 = 0.93% [=1.1%] | |||