Optical and Near-IR long-term monitoring of NGC 3783 and MR 2251-178: evidence for variable near-IR emission from thin accretion discs.
Abstract
We present long term near-IR light curves for two nearby AGN: NGC 3783 and MR 2251-178. The near-IR data are complemented with optical photometry obtained over the same period of time. The light curves in all bands are highly variable and good correlations can be seen between optical and NIR variations. Cross-correlation analysis for NGC 3783 suggests that some disc near-IR emission is present in the J-band flux, while the H and K-bands are dominated by emission from a torus located at the dust sublimation radius. For MR 2251-178 the cross-correlation analysis and the optical–near-IR flux-flux plots suggest that the near-IR flux is dominated by disc emission. We model the optical to near-IR Spectral Energy Distributions (SED) of both sources and find that disc flaring might be a necessary modification to the geometry of a thin disc in order to explain the observations. The SED of MR 2251-178 gives some indications for the presence of NIR emission from a torus. Finally, we consider the implications of the standard alpha disc model to explain the different origin of the variable NIR emission in these AGN.
keywords:
Seyfert galaxies: general — Seyfert galaxies: individual(NGC 3783, MR 2251-178)1 Introduction
Variability was very early established as a trade mark of Active Galactic Nuclei (AGN). Variability has also been used as a key tool to derive physical properties of AGN: characteristic time scales were used to infer sizes of the emitting regions, lags between the ionising continuum and the line response have been used to determine Black Hole masses (), multi-wavelength light curves have been used to study the geometrical and physical connections between the different regions around the central engine.
The scenario accepted until recently for the interplay of the emitting regions is that variability is driven by the emission from the X-ray corona located close to the central Black Hole (e.g., Collin-Souffrin, 1991; Krolik et al. 1991; Clavel et al., 1992; Collier et al. 1999; Cackett et al. 2007). The negligible optical inter-band lags was early evidence that pointed towards reprocessing of high-energy photons by the accretion disc, where the characteristic distances between the different emitting regions correspond to the light travelling time (Collin-Souffrin, 1991; Krolik et al. 1991; Clavel et al., 1992). Later on, the measurement of short lags between the X-ray emission and the optical, and the leading of the X-rays whenever significant lags were determined (e.g., Edelson et al., 1996; Wanders et al., 1997; Shemmer et al., 2001; Desroches et al., 2006), lent support to this picture (see also Nandra et al., 2000 for evidence supporting reprocessing from the correlation between the UV flux and the spectral shape of the X-ray emission), since for intrinsic disc variability shorter wavelengths should lag longer wavelength emission by long (viscous) time-scales. Also, light curves showed that the amplitude of the X-ray variations was much larger than that seen in the optical, which can be explained by the damping of the signal during the disc reprocessing. However, a full picture of the interplay between the X-ray corona and the disc might not be complete just yet, as new evidence seems to suggest that long term optical variability is driven by accretion rate fluctuations in the disc itself (see Section 3.1 and also Arévalo et al., 2008, 2009, and references therein).
Long term ( years), well sampled optical, UV, and X-ray monitoring of AGN is available for several sources (e.g., Breedt et al., 2010; Chatterjee et al., 2009; Shemmer et al., 2001; Giveon, et al., 1999; Türler et al., 1999; Korista et al., 1995; Clavel et al., 1991, Clavel, Wamsteker & Glass, 1989). However, near-IR data of similar quality has been lacking until recently. The new implementation of robotic observations and queue-based operations of other telescopes is changing this situation rapidly.
Suganuma et al. (2006) presented high quality optical and near-IR light curves for 4 Seyfert 1 galaxies obtained over 3 years of intense monitoring. The analysis of these observations, together with some other data available in the literature, showed that the lags observed at near-IR wavelengths are in very good agreement with the location of a putative dusty torus whose inner face should be found at the dust sublimation radius, i.e., at a distance proportional to , where corresponds to the luminosity of the central source. This behaviour is expected for a torus that intercepts a significant fraction of the near-UV and optical flux from the central source and reradiates it in the near and mid-IR. In this scenario, any flux variations in the central source will be followed by variations at these near-IR wavelengths, with a delay that will be characterised by the location of the torus inner face, which corresponds to the distance at which dust no longer sublimates under the strong glare of the central radiation.
Near-IR emission, however, can be emitted by the colder regions of an accretion disc itself, although there is no clear theoretical predictions of the real extent of the outer regions of the disc. Kishimoto et al. (2008) have presented evidence for near-IR disc emission in Quasars in polarised flux. They find that the spectral energy distribution is very close to , as expected for a Shakura-Sunyaev disc. More recently Landt et al. (2011) have shown that emission from an accretion disc and hot dust are required to explain the continuum around 1 micron in a sample of AGN.
In this paper we will present near-IR observations for NGC 3783 and MR 2251-178, and argue that we have detected near-IR variability from their accretion discs. This paper is organised as follows: In Section 2 we characterise our targets; in Section 3 we describe the acquisition and analysis of the data; in Section 4 we give estimates for the host contribution to our nuclear photometry; in Section 5 we present our results in the form of light curves, cross correlation analysis, flux-flux plots and spectral energy distributions; finally, Section 6 discusses our findings and the summary is presented in Section 7. In this article we adopt a concordance CDM cosmology with = 70 km/s/Mpc.
2 NGC 3783 and MR 2251-178 Black Hole Masses
NGC 3783 is a well studied nearby Seyfert galaxy located at a distance of 42 Mpc (). Early reverberation mapping campaigns were reported by Reichter et al. (1994) and Stirpe et al. (1994). Revised results were later reported by Onken & Peterson (2002) and Peterson et al. (2004), finding a black hole mass of .
For MR 2251-178, a very nearby Quasar (), a black hole mass of was recently reported by Wang, Mao & Wei (2009) using spectroscopic data and applying the luminosity-radius relation for the Broad Line Region as calibrated by Green & Ho (2005). We have also obtained spectroscopic data for MR 2251-178 using the RC spectrograph on the 1.5m telescope at CTIO and operated by the SMARTS consortium. The data were obtained on the 20th of December 2006 and reduced and calibrated in the standard way.
Following Peterson et al. (2004) we measure a line-width for H of 4,145 km/s. Using our light curves (presented in Section 5.1) we determine an average 5100Å flux of ergs/s/cm2/Å. For a distance of 274 Mpc, we obtain a black hole mass of , in complete agreement with the value determined by Wang, Mao & Wei (2009). These estimates are also in agreement with the lack of an observed break in the X-ray Power Spectrum Density, which puts an lower limit to the black hole mass of (Summons et al., in preparation).
3 Data
3.1 Optical Observations and previous results
Optical and X-ray monitoring for NGC 3783 and MR 2251-178 were already presented elsewhere (Arévalo et al., 2008; Arévalo et al., 2009). The analysis of the optical and X-ray light curves showed that while the time delay observed between the X-ray and the optical bands for MR 2251-178 was consistent with days, NGC 3783 required that some optical flux was produced about 6 light days away from the region where the X-rays were produced (Arévalo et al., 2008, 2009).
Crucially, both sources showed that optical long term variations (time scales of years) presented very large fluctuations which could not be explained by the reprocessing of the X-ray light curve. Hence, Arévalo et al. (2008, 2009) have suggested that the long term variability seen in the optical is driven by the intrinsic fluctuations of the accretion flow and is characterised by the disc viscous time scales.
In this work we have extended the coverage of the optical light curves by one year for NGC 3783 and two years for MR 2251-178. The data initial reduction followed the same steps detailed in Arévalo et al. (2008, 2009). The photometry was obtained taking all images to a common seeing and then performing aperture photometry with a diameter of 3.7 arc-seconds.
3.2 Near-IR SMARTS observations
The J, H, and K observations were obtained between the 1st of December 2006 and the 1st of August 2009 for NGC 3783, and between the 1st of August 2006 and the 20th of November 2009 for MR 2251-178. We used the ANDICAM camera mounted on the 1.3m telescope at CTIO and operated by the SMARTS consortium. The field of view corresponds to 140 arc-seconds, with a pixel size of 0.274 arc-seconds. Exposure times were 40 seconds in the J band and 20 seconds in the H and K bands. The mean seeing was , with the smaller values found in the K-band. The average sampling of the light curves was days with a period of intensive ( daily) monitoring during the second year of observations for both sources. Simultaneous optical observations in the B and V-bands were also obtained and reduced as outlined above.
The data reduction followed the standard steps of dark subtraction, flat fielding, and sky subtraction using consecutive jittered frames. The light curves were constructed from relative photometry obtained through a fixed aperture of 2.7 and 3.6 arc-seconds in diameter for NGC 3783 and MR 2251-178, respectively, after all images were taken to a common seeing by convolving each image with a Gaussian of width , where is the width corresponding to some of the worst seeing conditions (dates with even poorest seeing were discarded) and is the width of each individual image. For NGC 3783 five different comparison stars were used to obtain the relative photometry whenever available. MR 2251-178 however, had only one comparison star within the field of view.
Photometric errors were computed as the squared sum of the standard deviation due to the Poissonian noise of the source and sky flux within the aperture, plus the uncertainty of obtaining the measurement itself. This last error was estimated as the dispersion in the photometry of the stars available in the field of view between two consecutive exposures and it was found to range from 0.02 to 0.05 in fractional flux.

4 Host Galaxy Contribution
One component that should be taken into account when studying AGN variability is the light contribution within the used aperture from the stellar population of the host galaxy. High mass sources might be spared from this correction if they have high accretion rates, but for systems with massive black holes and low accretion rates it is now known that the host will also contain a massive spheroid which should be accounted for since the emission from the active nuclei might not completely dominate the total observed flux. In the following subsections we will estimate this contribution for NGC 3783 and MR 2251-178.
4.1 NGC 3783
NGC 3783 was studied using the ACS camera on board the Hubble Space Telescope by Bentz et al. (2006) and the galaxy was modelled as a combination of a bulge, disc and bar in the F550M filter (Å). The amount of host light in our 3.7″ optical apertures at this wavelength corresponds to ergs/s/cm2/Å, while for the 2.7″ near-IR apertures it corresponds to ergs/s/cm2/Å (M. Bentz, private communication), with more than 95% of this flux coming from the bulge. To extrapolate this measurement at 5100Å to near-IR wavelengths we will assume that only the bulge contributes significantly to the measured fluxes and will use the spectral energy distribution of the appropriate stellar population.
The stellar populations in bulges vary as a function of their luminosity. Massive bulges are characterised by old stellar populations which are well represented by a single epoch of star formation (Peletier et al., 1999; Peletier & Balcells, 1997), while the colours of less massive bulges found in late type galaxies are better characterised when younger stellar populations are also included (Carollo et al., 2007). From the determination of the black hole mass in NGC 3783 the mass of the bulge is found to be (Häring & Rix, 2004), at the lower limit of the range in the Peletier’s sample, and therefore it should be well represented by a stellar population with 1 to 2 times solar metallicities and ages around 9-12 Gyr.
We have used the simple stellar population models from the work of Maraston et al. (2005), scaled to the HST measurement at 5100Å, to determine the host contributions to the near-IR fluxes. A correction is introduced to account for the different apertures used during the photometric measurements in the optical and near-IR images. It is found that, after scaling, the single stellar population model with and 9 Gyr contributes less to the near-IR flux than the model with and 12 Gyr by a factor of 1.4–1.5, while the contributions are nearly equal in the B and V bands. The final B-band value reported in Table 1 corresponds to the average from these two extreme values and agrees within 25% with the value derived by Alloin et al. (1995) using a similar aperture. For a visualisation of the contributions, see Section 5.4.1.
| Galaxy | |||||
|---|---|---|---|---|---|
| NGC 3783 | 1.51e-15 | 2.20e-15 | 1.18e-15 | 7.89e-16 | 3.43e-16 |
| MR 2251-178 | 1.0e-16 | 1.7e-16 | 1.2e-16 | 8.7e-17 | 3.9e-17 |
| MR 2251-178 | 3.2e-16 | 5.0e-16 | 3.7e-15 | 2.6e-16 | 1.2e-16 |
4.2 MR 2251-178
For MR 2251-178 there is no study of the host galaxy, except for H imaging of the very extended ionised nebula around the quasar (see Shopbell, Veilleux & Bland-Hawthorn, 1999, and references therein). We have therefore estimated the host contribution to our photometry in an indirect way. Marconi & Hunt (2003) have determined a tight correlation between the black hole mass and the total bulge luminosity in the B and near-IR bands which can allow us to infer the bulge light contribution to our photometry.
Using the estimate of the black hole mass in MR 2251-178 we can determine the total bulge near-IR flux. Next it is necessary to interpolate to the flux within our aperture. To do this we need to assume a characteristic bulge effective radius () and Sersic index (). Marconi & Hunt’s sample suggests that for a black hole kpc is appropriate (although values of as low as 1 kpc and as high as 9 kpc are also being observed for this mass range). The work of Graham & Driver (2007) shows that should be adopted. Computing the fraction of flux within our apertures, it is found that this represents about of the bulge light. The scatter in , however, is large, implying that the correction can range from 15% to 45% of the total bulge flux.
This exercise is clearly a circular argument since we have not taken into account the host contribution to our photometry when determining the black hole mass in Section 2. However, while the dependency of the luminosity-radius relation on the optical luminosity goes as , the dependence on the H width goes as FWHM2 (e.g., Netzer & Trakhtenbrot, 2007). Therefore our estimate is fairly robust and correcting for the host contribution only lowers our estimate of the mass by a small factor which is well within the errors involved in the method.
The host contribution fluxes in our apertures are presented in Table 1 where two values are shown for MR 2251-178 corresponding to contributions within our aperture of 15% and 45% of the total bulge luminosities. Given the very similar apertures used to obtain the optical and near-IR photometry for MR 2251-178, no aperture correction was applied in this case.
5 Results
| Galaxy | Band | ||||
|---|---|---|---|---|---|
| NGC 3783 | 2.48e-14 | 6.19e-15 | 2.92 | 3.18 | |
| 4.99e-15 | 1.21e-15 | 2.61 | 2.96 | ||
| 4.60e-15 | 1.13e-15 | 2.72 | 2.89 | ||
| 5.06e-15 | 9.87e-16 | 2.00 | 2.23 | ||
| MR 2251-178 | 8.48e-15 | 1.41e-15 | 2.14 | 1.75 | |
| 1.56e-15 | 1.45e-16 | 1.14 | 1.37 | ||
| 1.13e-15 | 8.26e-17 | 0.88 | 1.30 | ||
| 1.07e-15 | 5.32e-17 | 0.58 | 1.26 |
5.1 Light Curves
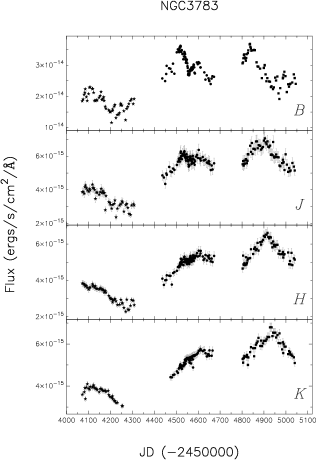
The near-IR light curves are presented in Figure 1, together with the optical B-band. All data have been corrected for foreground extinction in the Milky Way and host contribution. Since this correction is not certain for MR 2251-178 we show two scales to the y-axis, one corresponding to a 15% correction (on the left) and one corresponding to a 45% correction (on the right).
The light curve for NGC 3783 presents a very interesting behaviour, where optical long term variations (time scales of months to years) are well reproduced in the near-IR, but with short time variations (time scales of days to weeks) being more obvious in the shorter near-IR bands and possibly completely gone in the K-band. This can be better seen in the first two years of monitoring where the J-band follows closely the short time variability of the B-band light curve, albeit with a smaller amplitude. The third year of monitoring clearly shows that on longer time scales the near-IR bands lag behind the optical light curve, with the lag being larger at longer wavelengths.
On the other hand, MR 2251-178 presents a good agreement between the optical and all the near-IR bands. Interestingly, the fourth year of monitoring presents an unusual pattern, where the fast variability seems to be more significant in the J and H-bands than in the optical. Unfortunately, the photometric errors are quite large in the K-band, and the fast variation of the lightcurves cannot be assessed in the same detail.
In Table 2 we present the most relevant characteristics for the light curves after resampling the periods of intensive monitoring to the same cadence as in the rest of the light curves. Notice the clear reduction in the amount of variability towards longer wavelengths seen in both sources.
5.2 Cross Correlation Analysis
To examine the relation between the regions responsible for the emission seen in the optical and near-IR in a more quantitative manner, we obtained the cross correlation between the light curves presented in the previous Section.
To estimate the cross correlation between the light curves, we used the discrete correlation function (DCF) method of Edelson & Krolik (1988). The lags corresponding to the main peak in these functions, and their errors, were estimated using the random sample selection method of Peterson et al. (2004), selecting 67 percent of the data points in the B and NIR light curves and calculating the DCF centroid for 1000 such trials. The lags quoted correspond to the median of the distribution of trial centroids and the errors are the 67% bounds. Centroids are calculated as weighted average of the DCF points above 50% of the peak value DCFmax. Further details of the procedure can be found in Arévalo et al. (2008).
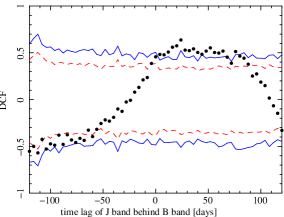
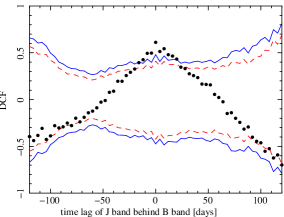
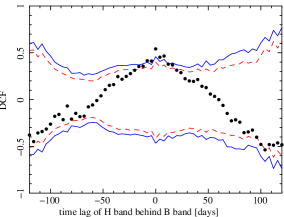
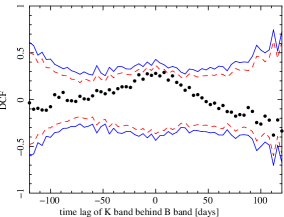
Figure 2 presents the optical–near-IR cross correlation obtained for NGC 37783 and MR 2251-178. It can be seen that for MR 2251-178 the cross correlation between the optical and the J and H bands presents a strong peak consistent with a zero lag between the different wavelengths. On the other hand, it was not possible to determine a centroid for the K-band with a confidence level above 95%. This is likely due to a combination of two factors: the large error bars in the light curve, and the small amplitude of the variation in this band. Notice, for example, that between the first and second year of monitoring the B-band light curve presented a jump flux 50%, while the K-band flux level did not present any significant increase. Despite this, the general behaviour of the K-band cross correlation seems to follow the trend observed at shorter wavelengths.
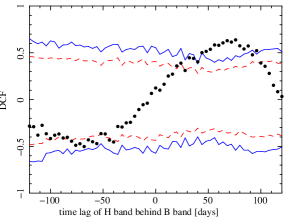
However, the cross correlation of the optical and near-IR data for NGC 3783 shows a very different behaviour, as expected from the light curves already discussed. The cross correlation between the J and B-band show a very wide peak, which extends from 10 days (location where the correlation rises above the 99% probability), to 60–80 days (where the correlation finally falls below the 99% probability). In contrast, the correlation between the B and H-band correlation shows a much narrower peak with a clear centroid around 60–70 days. This last finding is in very good agreement with the results found by Glass (1992) who determined a lag of about 80 days after 15 years of monitoring with a total of about 65 photometric measurements in the U and K bands and interpreted it as the response from a dusty torus. Glass (2004) reported a longer lag ( days) but pointed out that the sampling of the new data were not good. He also reported an average delay between the J and L-bands of 148 days, where the L-band presumably corresponds to emission arising in colder regions of the dusty torus.
We interpret the behaviour of the cross correlation of the optical and near-IR light curves in NGC 3783 as being due to the presence of two emitting regions. While one region seems to dominate at shorter wavelengths (primarily in the J-band) and follows closely the short term variability of the optical light curves with a lag of a few days, the second region seems to be much further away and essentially follows the long term variations of the dusty torus. Using the relation between and the distance at which the inner face of the torus is located (Suganuma et al., 2006), we predict a distance of light days for the dusty torus in NGC 3783. This is in very good agreement with our findings.
Beckert et al. (2008) determined the size of the inner face of the dusty torus in NGC 3783 using MIDI VLTI observations and find a radius of 0.2–0.3 pc, which corresponds to a light travel time of light-days (see also Kishimoto et al., 2009). This is however, a model dependent determination and values much smaller are also allowed (although not favoured) by Beckert et al. (2008). Besides, while the mid-IR interferometric observations report on a light-weighted-size of the emitting torus, near-IR variability studies are much more sensitive to the innermost regions of the torus, where the response to the variations of the central source are maximised. What has been learnt from the mid-IR interferometric data, however, is that the dusty structure surrounding the central source is quite extended (Kishimoto et al., 2009).
Table 3 summarises the cross correlation analysis between the optical and near-IR bands for NGC 3783 and MR 2251-178.
| Galaxy | lag | lag | lag | lag | |
|---|---|---|---|---|---|
| NGC 3783 | 60 | ||||
| MR 2251-178 | — | 190 |
5.3 Optical–Near-IR Flux–Flux Plots

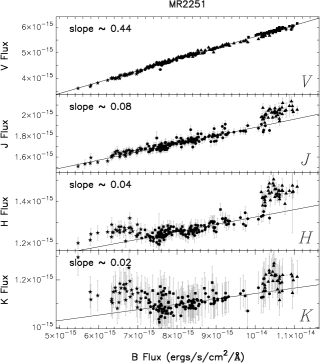
Flux-flux plots of simultaneous data points at different wavelengths can also be used to establish the level of correlation between different emitting regions. Figure 3 presents flux-flux plots for NGC 3783 and MR 2251-178. While NGC 3783 has been corrected for host contribution, no correction has been applied to MR 2251-178 given the uncertainty in this value.
To visualise a simple situation, let us assume that the emission observed in two bands arises as simple thermal reprocessing of the emission from a central variable X-ray source located at a height above the axis of an axisymmetric thin disc. For much larger than each radius will radiate as a Black Body of temperature , with most of the flux being emitted within a narrow spectral region characterised by . Then, if the light travel time between these two regions is small compared to the variability time-scales and the sampling interval, a close-to-linear relation should emerge between the bands.
A very tight linear relation is seen between the B and V bands for MR 2251-178, as shown in Figure 3 (see also Arévalo et al., 2008), which is a good indication that all of the optical flux arises from a rather compact region which is causally connected. We will assume that this is the accretion disc.
In the previous section we determined that for MR 2251-178 the delay between the optical and the J and H-band light curves is very short. This is consistent with the flux-flux plots presented in Figure 3. All the near-IR bands also show linear correlations with the B-band flux albeit with nearly flat slopes. These linear relations can be interpreted as being due to nearly simultaneous variation in the optical and near-IR bands. Hence, we can assume that the near-IR flux is also being produced in the accretion disc.
We need to understand the different slopes, however. Assuming the simple model described above, for a constant albedo we would expect that the same fraction of the incident X-ray flux will be thermalised at each radius, with the incident flux being for large . This heating flux will be added to the gravitational energy released at each radius, which is also . Hence, we can expect that the fractional reprocessed X-ray flux should remain fairly constant with radii (i.e., as a function of wavelengths). However, our observations show that while the B-band flux nearly doubled during the observational campaign, the V-band presented a 50% flux increment, and the near-IR bands show less than 10% variation. One possible explanation is a wavelength dependent albedo. Another possibility is that the variation in the near-IR is highly diluted by another near-IR component, like the emission from a dusty torus.
It is interesting to notice that the linear relations seen between the optical and near-IR bands for MR 2251-178 break for low and high B-band fluxes, while they hold for ergs/s/cm2/Å. Outside this range, an “excess” of emission appears, which can be interpreted as a new component to the near-IR emission. However, while the “new” component at low B-band fluxes seems to be present only in H and K, the “new” component at high B-band fluxes is clearly visible in all near-IR bands. This might indicate that the near-IR excess at low B-band fluxes is due to the presence of a dusty torus, since it is expected that the emission from this component peaks somewhere in the mid-IR. The excess at high B-band fluxes is consistent with the different variability trends seen in the fourth year of monitoring, as already commented in Section 5.1. This might correspond to a new component of near-IR emission, like an outburst in the outer parts of the accretion disc, for example.
For NGC 3783 the situation is quite different due to the delays already discussed in Section 5.2. In Figure 3 it can be seen that some linearity is present in the flux-flux plots, but with large scatter for all near-IR bands. In fact, two regimes are present: in the first year of monitoring the slope of the correlations in all bands are positive due to the consistent flux decline observed during this period; in the second and third year of monitoring the flux-flux slopes change from being slightly positive in the J-band to slightly negative in the K-band. This is because of the anti-correlation in the light curves around MJD , , and , where the B-band light curve presents a flux decline while the near-IR light curves show a flux rise. Since the delay becomes larger at longer wavelengths, the strongest anti-correlation is seen in the K-band.
We constructed delayed flux-flux plots of the B-band versus the J and H bands, meaning pairs of photometric data where the near-IR points corresponded to the time of the B-band observation plus a delay. For the J-band different delays were tried because of the very broad peak seen in the cross-correlation plot shown in Figure 2, which could be due to the presence of more than one emitting region, as we already have discussed. For the H-band we tried delays within the range of values allowed by the cross-correlation results. The delayed flux-flux plots showed some reduction in the scatter of the photometry around a linear fit to the two regimes observed in Figure 3, but this was consistent with a reduction due to the smaller number of points available when constructing the delayed photometric pairs of data, so no further conclusions can be reached on this point.
5.4 Modelling of the Spectral Energy Distributions
The nuclear BVJHK Spectral Energy Distributions (SEDs) for NGC 3783 and MR 2251-178 are presented in Figures 4 and 5. The SED points have been computed as the mean of the photometric fluxes determined for each nucleus after resampling the intensive part of the light curves to the average sampling. The data have been corrected for foreground extinction and the host contribution is taken into account. For NGC 3783 this correction is fairly accurate, while for MR 2251-178 we have adopted a correction of 30% of the bulge total fluxes in BJHK as determined in Section 4.2.
The small number of SED points does not allow for a real fitting procedure; instead we have attempted to use all available information for each source and modelled the SED taking into account these constraints. These are: 1) the SED itself; 2) the knowledge that the disc and/or another emitting region contributes significantly to the individual SED points; 3) the restrictions on the location of the different emitting regions from the cross correlation analysis presented here and in Arévalo et al. (2008, 2009); 4) the spectra of the fast variability component, which we assume is modulated by the reprocessing of the X-ray emission on the disc and the intrinsic variations in the accretion flow; 5) the spectra of all the variability signal, where any constant component to the SED has been removed.
We want to build a toy model that can account for the observational constraints imposed by our sources. We assume a model of an -disc illuminated by a central X-ray source. Analytically, the emitted SED corresponds to the sum of the Black Body emission () from each of the disc annuli:
where and are the innermost and outermost disc radii and is the solid angle subtended by a disc annuli as seen by the observer. The temperature as a function of radius is found to be (Cackett, Horne & Winkler, 2007):
| Galaxy | |||||||
|---|---|---|---|---|---|---|---|
| Model | (ergs/s/cm2) | ||||||
| NGC 3783 | |||||||
| Model A | 3e | 0.015 | 1.0 | 10 | 3.8e | 50 | 1200 |
| Model B | 3e | 0.015 | 1.0 | 10 | 3.8e | 50 | 1200 |
| 1.3† | 50† | ||||||
| MR 2251-178 | |||||||
| Model A | 3e | 0.01 | 1.8 | 100 | 5.9e | 50 | — |
| Model B | 3e | 0.01 | 1.0 | 1 | 4.5e | 80 | 1500 |
| 100‡ | |||||||
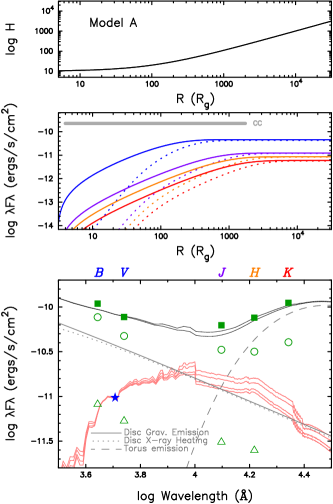

where is the accretion rate, is the Stefan-Boltzman constant, the accretion efficiency, is the derivative of the function that describes the vertical profile of the disc, is the disc albedo, is the 0.01–500 keV luminosity of the central X-ray source, is the distance from the X-ray source to a position at radius on the disc, and is the angle between the direction on the incident X-ray radiation and the local normal to the disc surface. Since the true factor to extrapolate from the observed X-ray luminosity to the 0.01–500 keV energy range is not well known, nor is the disc albedo, the term can be regarded as a “fudge” term in the above equation. Other model parameters are the height of the X-ray source above the disc () which determines and , and the disc central height which we always assume to be equal to 10 (notice that this introduces an asymptotic behaviour in the logarithmic representation of the disc profile for small values of , as can be seen in the top panels of Figures 4 and 5). Model parameters for our sources are presented in Table 4, all of which are allowed to vary freely except for the black hole mass. We did not perform a residual minimization routine to fit the model, given the small number of data points and large number of free parameters; we simply searched for parameters that produced a good description of the data. Therefore, no error estimation of the parameters is possible.
The disc emission is represented in the SEDs by two components (Figures 4 and 5, bottom panels): one due to the release of gravitational energy only (first term in the previous equation), and another representing the emission due to the reprocessing of X-rays (second term in the previous equation). To the disc emission we have added the near-IR emission from a warm dusty torus. No direct evidence for the presence of a torus is found in our data for MR 2251-178. However, the SED fit suggests that torus emission might be present in this object, as discussed further in Section 5.4.2. Figures 4 and 5 also present the cumulative emission for different bands from the release of gravitational energy and the reprocessing of X-rays (middle panels) and the disc profile as a function of radius (top panels).
Arévalo et al. (2008, 2009) have shown that the optical long term variability (on time scales of years) is most likely driven by fluctuations in the accretion flow. On the other hand the component corresponding to the reprocessing of X-ray heating carries the fast modulation from the variable X-ray central source. Hence, we can estimate a lower limit to the flux from this component by measuring the rms of the fast variability. To isolate the very fast variations we have computed the flux rms of the residuals of the yearly segments of the light curves with respect to a fit using a low order (up to quadratic) Legendre polynomial in the V, B, J and H bands. These flux upper limits are plotted in Figures 4 and 5 using triangles. The K-band was omitted because of the larger errors.
We also determined the difference spectrum for the sources, this is, the spectra obtained by subtracting the observed SED around the lowest flux level from the spectra observed around the highest flux level. When computing the difference spectra any constant component to the SED will be subtracted out. In particular, the host galaxy contribution should be completely eliminated for both sources, and since no clear evidence for the presence of variable emission from the torus in MR 2251-178 is found from the cross-correlation analysis, its difference spectra should represent only disc emission. In general, any disc component that remained constant during the period of monitoring will also be subtracted out, while any component with constant shape but different scaling factors will retain its spectral signature.
A final remark: since there is now good evidence that some (and more likely most) of the variability is driven by changes in , it is possible that the gravitational heating component could vary by a factor of a few with , while our toy models, which assume a steady state approximation, are not capable of reflecting this dynamic behaviour.
5.4.1 NGC 3783
The near-IR constraints we would like to meet for NGC 3783 are a non-negligible amount of disc emission in the J-band and a torus component that becomes progressively more significant when moving from the J to the K-band. Variability constraints also tell us that the optical emission presents a 6 day lag behind the X-rays (Arévalo et al., 2009). The difference spectrum presented in Figure 4 (shown with empty circles in the bottom panel) corresponds to emission from all the variable components in NGC 3783, and presents the expected upturn in the near-IR, as the variable torus emission becomes prominent in the H and K-bands. On the other hand, the very fast variability (empty triangles), which as argued before should be dominated by the X-ray reprocessed emission, does not present such turn up.
Following Arévalo et al. (2009), we first model the disc in NGC 3783 as a surface with constant radius-to-height ratio, (using a power law notation, , with and ). As can be seen in the bottom panels of Figure 4, the components corresponding to the release of gravitational energy and X-ray heating have very similar spectral slopes all the way from the B to the K-band and therefore their scaling is not constrained by the modelling. Adopting a 2–10 keV X-ray luminosity for NGC 3783 of ergs/s, a conversion factor to the 0.01–500 keV band of 5, and an albedo of 40% as determined by Arévalo et al. (2009), we obtain the values for and presented in Table 4. Allowing for the presence of a dusty torus with a temperature of 1200 K, it is possible to obtain a good fit to the observed SED, as seen in Figure 4. The J-band presents similar contributions from the disc and torus, while the torus becomes more prominent towards longer wavelengths.
The unexpectedly long 6 day lag between the X-rays and the optical emission is shown in the middle panels of the Model A in Figure 4 as a long light-grey “CC” horizontal bar, which extends from the axis of symmetry of the system, where the X-ray source is assumed to be located, to a radius of several light days (). Even though the formal errors for the lag between the X-ray and optical bands allow for a 2 sigma distance , Arévalo et al. (2009) argue that this is a robust result since the positive lag was found when obtaining the cross-correlation of the entire light curve as well as when using the period of fast monitoring.
Model A is not consistent with the 6 day lag between the X-ray and optical emission. We do not know with certainty what fraction of the optical flux is causing the variability which gives rise to the cross correlation signal, and although the fast variability measurements (green triangles in Figure 4) suggest that this might not be very large, Model A shows that hardly any optical emission is produced past , which contradicts our previous results.
The 6 day lag is driven by the reprocessing of X-ray emission, since the optical bands vary behind the X-rays, as this emission illuminates and heats the accretion disc. To shift the amount of X-ray reprocessed emission to regions further out from the central source we need to introduce some flared structure that would increase the surface area that receives direct illumination from the central X-ray source. However, to have a significant amount of optical emission at the X-ray heating has to be very efficient so that high enough temperatures are obtained. If this is achieved assuming an azimuthaly symmetric, , flaring geometry the total amount of reprocessed emission, from the optical to the near-IR, exceeds the observed SED by several orders of magnitude.
Therefore we assume that superimposed onto the geometry already presented in Model A a ‘hump’ (a spiral arm?) located at and subtending a very small solid angle is heated to very high temperatures and produces the optical emission that lags the X-ray central source by 6 days. The smaller subtended area of this structure also alleviates the problem of observing a coherent variation from a structure located at such large distances from the central region. This scenario is presented by Model B in Figure 4, which is a small departure from model A and therefore retains several of the previous traits, as can be seen in Table 4. As before, emission from a dusty torus is also included. Light-grey curves show the characteristics of the new hump component. The general fit to the SED is still good, as this new component is not energetically very significant.
The presence of the hump is visible in the top panel as two radial cuts are shown, one running across it and the other one running across any other radial direction. To avoid overcrowding, the middle panel only shows the emission from the general disc in the B and J-bands, while the emission from the reprocessing of the X-rays by the hump, also in the B and J-bands, is included in light-grey colour. The hump shifts some of the reprocessing of the X-ray emission towards distances more consistent with the cross correlation results and its SED is consistent with that of the fast variability. Most likely, to properly model this component we would have to introduce an non-axisymmetric geometry, which is beyond the scope of our simple toy models.
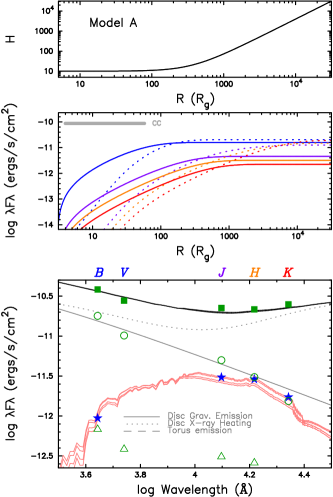
5.4.2 MR 2251-178
No direct evidence for the presence of a torus is found in the lightcurves of MR2251-178 (see also Section 6.2 for further analysis), while disc emission is clearly seen from the optical to the near-IR bands, as determined by our analysis of the cross-correlation and flux-flux plots (Arévalo et al., 2008; Section 5.2). In fact, the cross-correlation results set constraints to the distance between the regions of the disc responsible for the variable emission at optical and near-IR wavelengths, with no more than a few days as upper limits. In Figure 5 the distance from the centre of symmetry of the system to a radius of 1 light-day is represented by a “CC” horizontal bar. Also, for MR 2251-178 the difference spectrum presented in Figure 5 is steep all the way from the optical to the near-IR, while the fast variability spectrum, which is dominated by the X-ray reprocessing, shows a slightly flatter spectral shape.
Table 2 shows that the variable component in the near-IR light curves of MR 2251-178, either driven by the reprocessing of X-ray emission or the intrinsic fluctuations in the accretion flow is small. This is also shown by the very flat slopes in the flux-flux plots presented in Section 5.3. Therefore, the near-IR emission is dominated by a non-variable component and the variability constraints have to be used with care, since they might not represent what the bulk of the near-IR emission is doing. More valuable information is found in the difference and the fast variability spectra, as we will see next.
Without direct evidence for the presence of a dusty torus from our cross correlation analysis, we want to consider how to produce the large amount of near-IR flux shown in the SED using the accretion disc alone. To produce near-IR emission from the disc we adopted a disc profile of the form with and to achieve the desired flaring geometry. The result can be seen in Model A of Figure 5. The general fit to the observed SED is reasonably good and the emission at optical wavelengths peak close to the limit set by the “CC” bar. However, the X-ray reprocessed component presents a spectral shape which is very different to both, the difference spectrum and the fast variability spectrum, while the near-IR bands peak at . In fact, the model predicts that of the K-band emission corresponds to reprocessed X-rays and this large output should introduce larger variability than that observed. For example, of the reprocessing is taking place within , which corresponds to a light travel time of days. Therefore the K-band light curve should be very similar to that of the optical emission but smoothed with a kernel of 30-60 days (60 days corresponding to an edge-on line-of-sight towards the disc), which is not the case. Finally, to achieve the necessary geometry, an extremely thick disc is required, with for , which is not expected for the estimated accretion rate observed in this object (see Section 6.3). Hence, we discard this model.
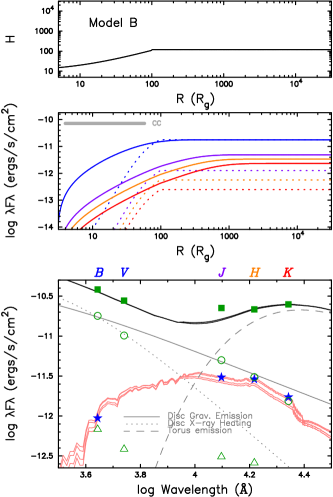
The non-variable near-IR emission could originate in a dusty torus instead of the disc itself, which is bound to be more variable. Hence, we will explore a model where the near-IR emission arises from a non-variable dusty torus.
First, we assume that a dusty torus is responsible for most of the near-IR emission, while most of the variability signatures should originate in the disc. However, no simple flaring geometry would match both, the shape of the SED and the time constraint from the cross-correlation analysis, which imply a surprisingly fast near-IR response. Hence, in Model B we introduce a further modification to the model geometry, with the disc presenting a tapered profile after a characteristic radius . Effectively, the tapering (in this case to a slab profile) stops the X-ray heating for . This ensures that the bulk of the near-IR reprocessed emission comes from regions inwards of . Also, the tapering stops the rapid increase in the disc thickness introduced by the strong flare required at low .
Our fit with a flaring tapered geometry characterised by , and emission from a torus is presented in the right panel in Figure 5. Other parameters are found in Table 4. The fudge luminosity for Model B corresponds to ergs/s. Orr et al. (2001) estimated a 0.01–500 keV X-ray flux for MR 2251-178 of ergs/s/cm2, while Arévalo et al. (2008) inferred an albedo of 0.4 for the disc surface. For a distance of 274 Mpc, this results in a total X-ray luminosity of ergs/s. Our model therefore, is a factor of 2 too low when compared with this prediction. However, the SED shows that there is still some degree of degeneracy between the scaling of the and components, while the actual albedo might be larger than predicted. More problematic is the fact that the spectrum of the X-ray reprocessed emission is very steep, as a result of the truncation of further near-IR reprocessing at larger . This is in sharp contrast with the flat spectrum of the fast variability component, particularly in the near-IR (although the fast variability in the H-band is poorly constrained for this object - see Figure 1). No combination of the (already quite large) set of model parameters could alleviate this problem.
6 Discussion
6.1 MR 2251-178: disc or jet emission?
One possible origin for the nearly simultaneous optical and near-IR variability in MR 2251-178 is the presence of a jet. In this case the emission would be due to synchrotron instead of thermal processes. Jet emission is found to be prominent in radio-loud AGN and in relativistically boosted radio-quiet AGN (also known as radio-intermediate AGN; Falcke et al., 1996; Barvainis et al., 2005). Radio-loud AGN are defined as those with (where ; Kellermann et al., 1989), radio-intermediate AGN are those with , while radio-quiet AGN have .
Radio counterparts to MR 2251-178 have been found from the cross-correlation of the NRAO VLA Sky Survey (NVSS) with the Second Incremental Data Release of the 6 degree Field Galaxy Survey (6dFGS DR2; Mauch & Sadler, 2007) and the ROSAT Bright Source Catalog (RBSC; Bauer et al., 2000). The determined flux is about 16 mJy at 1.4 GHz. Assuming a radio spectral index for radio-intermediate AGN (; Barvainis et al., 2005) we can infer the flux at 5 GHz. Hence, we find that MR 2251-178 has based on our observed B-band flux (Table 2). Clearly, MR 2251-178 corresponds to an unbeamead AGN. Notice that the value for radio-quite sources can be even steeper, making the derived even smaller.
6.2 A torus in MR 2251-178?
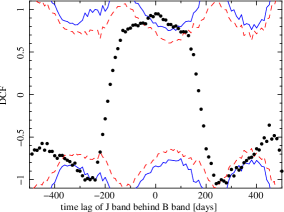
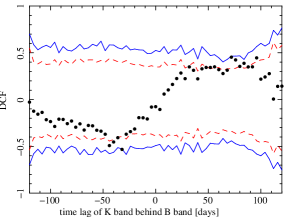
No evidence for a torus is seen in the cross correlation analysis presented in Section 5.2, which indicates that the response from all near-IR bands to the variable X-ray source seems to come from a much closer source, that we identify with the accretion disc. However, since the Suganuma et al. (2006) relation predicts the presence of a torus at the dust sublimation radius which, for MR 2251-178 is at 190 light days ( in units of ), we need to explore the DCF to cover longer time scales.
Figure 6 presents the long-term cross-correlation between the optical and J band. In this case we did not calculate separate DCF functions for each yearly segment and average the results but rather calculated the DCF of the entire light curves. For this reason, the large amplitude long-term fluctuations dominate the correlation, making the central peak much broader. The good correspondence between smaller-amplitude, rapid fluctuations, which dominated the DCF in Fig. 2, produces the narrower peak superimposed on the center of the distribution, again consistent with a zero lag. No positive correlation features are found at the expected dust sublimation lag of 190 days. The result obtained using the H band is of worse quality but consistent to that presented in Figure 6, while using the K band gives unconstrained results, as expected.
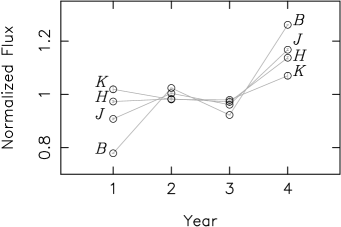
The low signal-to-noise of the K-band light curve is in fact preventing us from better assessing the presence of the torus at the wavelength where it should make a more significant contribution. Figure 7 presents the normalised yearly averaged light curves for MR 2251-178 which allows us to examine the long term variations in each band, minimizing the impact of photometric errors. It can be seen that the variability pattern changes towards longer wavelengths, where the variations are not only smaller in amplitude, but also move in the opposite sense with respect to the shorter wavelengths: between the first and second year of monitoring the flux increases at short wavelengths but decreases in the K band. This might be the signal of a slowly varying torus.
The lack of clear variability from the torus, however, is surprising. In type 1 objects we should have a direct view to the central source and the inner face of the torus, which is the region where the largest amount of variation should be found. Maybe the torus is located further away than expected and the variation should be seen at even longer time scales than the ones we are able to study. This might be the case if MR 2251-178 was significantly brighter in the past, forcing the sublimation radius to recede to large distances. Similarly, a variation in the distance to the inner part of the torus in NGC 4151 was reported by Koshida et al. (2009).
Alternatively, the torus geometry might subtend a small solid angle as seen by the central source, in which case its varying flux might be buried in the disc emission. In fact, a near-IR “excess” is seen in the flux-flux plots presented in Figure 3, but only in the H and K-bands. This corresponds to observations during the first year of monitoring. Unfortunately only a monotonic decrease in flux is observed at all wavelengths during that period, so if this emission comes from the torus it is not possible to draw any conclusions about its possible response to variations from the central source.
From the analysis of XMM-Newton data Kaspi et al. (2004) found that the 6.4 keV iron emission line in MR 2251-178 is weak (with an equivalent width of eV), suggesting a weak torus component. However, this is also consistent with a high albedo if the accretion disc is very highly ionised which is a result also consistent with our modelling of the disc in Section 5.4.2.
The need for Black Body emission in the near-IR is also suggested by our fit to the SED. This is consistent with the presence of a torus, which would dominate the SED beyond wavelengths of a few microns.
6.3 Hot and cold disc emission
| Galaxy | Refs. | |||
| NGC 3783 | 30 | 0.06 | 0.21 | 1, 2 |
| MR 2251-178 | 300 | 0.04-0.4 | 0.11-0.19 | 2, 3 |
| NGC 3227 | 42 | 0.014 | 0.14 | 1, 2 |
| NGC 4395 | 0.4 | 0.0012 | 0.23 | 4 |
| NGC 4051 | 2 | 0.15 | 0.52 | 1, 5, 6 |
| NGC 7469 | 12 | 0.54 | 1, 2 | |
| Q0144-3939 | 1,180 | 0.26 | 0.12 | 7 |
| 3C95 | 8,330 | 0.37 | 0.08 | 7 |
| CTS A09.36 | 1,180 | 0.29 | 0.13 | 7 |
| 4C09.72 | 10,290 | 0.22 | 0.07 | 7 |
| PKS2310-322 | 1,420 | 0.37 | 0.13 | 7 |
| Ton202 | 4,115 | 0.15 | 0.08 | 7 |
Our analysis clearly indicates the detection of variable near-IR emission from the disc of MR 2251-178 and suggests that some disc near-IR emission is also present in NGC 3783. Evidence is groing that accretion disc emission is indeed visible in the near-IR regime (Landt et al., 2011; Kishimoto et al., 2008; Minezaki et al., 2006). In fact, based on the cross-correlation analysis of the optical and J and H-band data for NGC 4395, Minezaki et al. (2006) argue that the observed variability comes from the outer region of the accretion disk. In addition, Tomita et al. (2006) have assumed the presence of a variable disc component that extends from the optical to the near-IR to interpret the light curves of MCG +08-11-011. They find a SED index for this component of , still consistent with the predicted value of 1/3.
Suganuma et al. (2006) did not find direct evidence in any of their sources for the presence of near-IR emission arising from the accretion disc. In fact, their optical versus near-IR flux-flux plots for NGC 5548, NGC 4051 and NGC 3227 (their Figure 13) look like pure scatter diagrams, except for NGC 7469 where some correlation seems to be present. This seems to indicate that in these sources the variable near-IR emission is dominated by the distant large torus, or by the much slower variations of the accretion flow in the outer parts of the accretion disc. On the other hand, in MR 2251-178 the variable near-IR emission is dominated by the reprocessing of X-rays by the disc.
Uttley et al. (2003) already pointed out that the nature of the disc reprocessed emission will depend on the location of those regions of the disc exposed to the X-ray illumination. The range of temperatures that characterise the reprocessed emission will depend on the thermal structure of the disc, which in turn is determined by the black hole mass and the accretion rate as and , for expressed in Eddington units. Furthermore, Uttley et al. (2003) invoke results from X-ray binaries to argue that the size of the X-ray emitting region, expressed in units of , is constant for all sources. Therefore, for small accretion rates and/or large black hole masses, we expect a cold accretion disc, where the near-IR emitting region will be located at small values of and will be more likely to be exposed to a significant fraction of the X-ray flux. The opposite situation, a hot accretion disc, is expected for sources characterised by small Black Hole masses and/or large accretion rates. The fast variability observed in different bands, which traces the variations produced by the central X-ray source, therefore, represents a tool that allow us to map the regions being illuminated and heated by X-ray flux.
To test this scenario we have gathered the values of the black hole masses and accretion rates for our sources and those found in Suganuma et al. (2006), Minezaki et al. (2006), and Kishimoto et al., (2008). These are presented in Table 5. For NGC 3783 and MR 2251-178 the accretion rates are based on the observed bolometric luminosities, and not on the values determined during our SED fitting. This is because our determination of only accounts for the direct release of gravitational power into the disc, while the X-ray heating is determined by the observed value of . However, the high energy emission (and any released mechanical energy) is also powered by the gravitational potential energy which ultimately takes the form of a hot corona (and a mechanical jet). Since we do not have a prescription to relate with , remains as an extra parameter in the SED models.
As before, measurements of and for NGC 3783 are fairly accurate, while clear uncertainties remain for MR 2251-178. Besides, the black hole estimates presented in Section 2, the determination of the bolometric luminosity for MR 2251-178 is rather vague: assuming the bolometric corrections computed by Marconi et al. (2004) we find that the B-band luminosity predicts ergs/s, while the 2-10 keV luminosity gives ergs/s. This shows that MR 2251-178 is fairly “X-ray loud”, with an index of 1.2 (for a definition of see Tananbaum et al., 1979), close to the edge of the distribution for quasars and local Seyferts (Zamorani et al., 1981; Grupe et al., 2010). Hence, there is about one order of magnitude uncertainty in the bolometric luminosity of MR 2251-178, as well as in its accretion rate.
Table 5 shows that MR 2251-178 is located in the lower part of the distribution of values when compared with local NGC Seyferts and, if its lower accretion rate is confirmed, it fits well within the range of values shown by Kishimoto’s sample of Quasars. However, the power to clearly introduces a weak dependency on , and given the uncertainties involved in these measurements it is still premature to draw firm conclusions. In fact, NGC 4395 (for which the detected intra-day near-IR variations also argue in favor of J and H-band disc emission; Minezaki et al., 2006), has a value of well consistent with the other NGC galaxies. Hence, even though Table 5 could be telling us that MR 2251-178 hosts the coolest accretion disc it remains to be tested further whether the combination of these two fundamental parameters, and , is sufficient to fully determine the temperature distribution in thin accretion discs. As already shown in this work the geometry of the disc (e.g., the presence of flaring, humps, or tapering of the disc) might also play a significant role.
This finding could have important implications for the analysis of other sources with small ratios where the near-IR emission is normally interpreted as a dust emission while it might correspond to emission from the accretion disc.
7 Conclusions
We have obtained high quality near-IR light curves for two nearby AGN: NGC 3783 and MR 2251-178, which are characterised by very different values of their black hole mass. The light curves track variations on time-scales from a few days up to three years for NGC 3783 and four years for MR 2251-178. From the analysis of these data, together with the results already presented in Arévalo et al. (2008, 2009) we find the following:
-
1.
The Near-IR light curves for both our sources, NGC 3783 and MR 2251-178, show a strong correlation with the optical light curves.
-
2.
For NGC 3783 the optical and near-IR cross correlation analysis suggests that two emitting regions are present in the J-band emission, one consistent with a short lag and another found much further out. We identify these regions as the accretion disc and a dusty torus. The H and K lags ( days) are consistent with the presence of dust in a torus located at the sublimation radius.
-
3.
For MR 2251-178 the lags measured between all near-IR and optical wavelengths are consistent with lags of days. This suggests that the variable near-IR emission arises from the accretion disc in this source.
-
4.
From the cross correlation analysis we find no direct evidence for the presence of a dusty torus in MR 2251-178 as expected from the delays predicted by the Suganuma et al. (2006) relation. We checked that the emission is not due to the presence of beaming emission from a radio jet.
-
5.
Flux-flux plots for both sources are consistent with the findings from the cross correlation results. The linear relations observed between the optical and near-IR bands in MR 2251-178 confirm that the variable near-IR emission originates in the accretion disc. However, some near-IR excess seen at low optical fluxes might suggest the presence of a dusty torus.
-
6.
We determined a satisfactory SED representation for NGC 3783 adopting a model of an -disc illuminated by a central X-ray source plus a dusty torus at a distance consistent with the dust sublimation radius. The model is able to reproduce the optical and near-IR spectral energy distribution as well as other timing constraints. The modelling of MR 2271-178 is not as adequate and requires the presence of a dusty torus.
-
7.
We tentatively interpret the differences in the origin of the near-IR emission in our sources, as well as those reported by Suganuma et al. (2006) and Kishimoto et al. (2009), as the result of the location of the colder regions in the accretion disc with respect to the central illuminating X-ray sources, as originally suggested by Uttley et al. (2003).
Acknowledgments
We thank the anonymous referee for helpful comments. PL gratefully acknowledges support by Fondecyt Proyect 1080603 and Fondap Project 1501003.
References
- Arévalo et al. (2009) Arévalo, P., Uttley, P., Lira, P., Breedt, E., McHardy, I. M., Churazov, E., 2009, MNRAS, 397, 2004
- Arévalo et al. (2008) Arévalo, P., Uttley, P., Kaspi, S., Breedt, E., Lira, P., McHardy, I. M., 2008, MNRAS, 389, 1479
- Barvainis et al. (2005) Barvainis, R., Lehár, J., Birkinshaw, M., Falcke, H., Blundell, K. M., 2005, ApJ, 618, 108
- Bauer et al. (2000) Bauer, F. E., Condon, J. J., Thuan, T. X., Broderick, J. J., 2000, ApJS, 129, 547
- Bentz et al. (2009) Bentz, M. C., Peterson, B. M., Netzer, H., Pogge, R. W., Vestergaard, M., 2009, ApJ, 697, 160
- Bonning et al. (2009) Bonning, E. W., Bailyn, C., Urry, C. M., Buxton, M., Fossati, G., Maraschi, L., Coppi, P., Scalzo, R., Isler, J., Kaptur, A., 2009, ApJL, 697, L81
- Breedt et al. (2010) Breedt, E., McHardy, I. M., Arévalo, P., Uttley, P., Sergeev, S. G., Minezaki, T., Yoshii, Y., Sakata, Y., Lira, P., Chesnok, N. G., 2010, MNRAS 156
- Cakett et al. (2007) Cackett, E. M.; Horne, K., Winkler, H., 2007, MNRAS, 380, 669
- Carollo et al. (2007) Carollo, C. M., Scarlata, C., Stiavelli, M., Wyse, R. F. G., Mayer, L., 2007, ApJ, 658, 960
- Chatterjee et al. (2009) Chatterjee, R., et al., 2009, ApJ, 704, 1689
- Clavel et al. (1989) Clavel, J., Wamsteker, W., Glass, I. S., 1989, ApJ, 337, 236
- Clavel et al. (1991) Clavel, J. et al., 1991, ApJ, 366, 64
- Clavel et al. (1992) Clavel, J., Nandra, K., Makino, F., Pounds, K. A., Reichert, G. A., Urry, C. M., Wamsteker, W., Peracaula-Bosch, M., Stewart, G. C., Otani, C., 1992, ApJ, 393, 113
- Collier et al. (1999) Collier, S., Horne, K., Wanders, I., Peterson, B. M., 1999, MNRAS, 302, L24
- Collin-Souffri (1991) Collin-Souffrin, S., 1991, A&A, 249, 344
- Desroches et al. (2006) Desroches, L. B., et al., 2006, ApJ, 650, 88
- Edelson et al. (1988) Edelson, R. A., Krolik, J. H., 1988, ApJ, 333, 646
- Edelso (1996) Edelson, R. A. et al., 1996, ApJ, 470, 364
- Falcke et al. (1996) Falcke, H., Patnaik, A. R., Sherwood, W., 1996, ApJL, 473, L13
- Giveon et al. (1999) Giveon, U., Maoz, D., Kaspi, S., Netzer, H., Smith, P. S., 1999 MNRAS, 306, 637
- Glas (1992) Glass, I. S., 1992, MNRAS, 256, L23
- Glas (2004) Glass, I. S., 2004, MNRAS, 350, 1049
- Graham et al. (2007) Graham, A. W., Driver, S. P., 2007, ApJ, 655, 77
- Grupe et al. (2010) Grupe, D., Komossa, S., Leighly, K. M., Page, K. L., 2010, ApJS, 187, 64
- Häring et al. (2004) Häring, N., Rix, H.-W., 2004, ApJl, 604, L89
- Kaspi et al. (2004) Kaspi, S., Netzer, H., Chelouche, D., George, I. M., Nandra, K.,, Turner, T. J., 2004, ApJ, 611, 68
- Kellermann et al. (1989) Kellermann, K. I., Sramek, R., Schmidt, M., Shaffer, D. B., Green, R., 1989, AJ, 98, 1195
- Kishimoto et al. (2008) Kishimoto, M., Antonucci, R., Blaes, O., Lawrence, A., Boisson, C., Albrecht, M.,, Leipski, C., 2008, Nature, 7203, 492
- Kishimoto et al. (2009) Kishimoto, M.; Hönig, S. F.; Tristram, K. R. W, Weigelt, G., 2009, A&A, 493, L57
- Korista et al. (1995) Korista, K. et al., 1995, ApJS, 97, 285
- Koshida et al. (2009) Koshida, S., Yoshii, Y., Kobayashi, Y., Minezaki, T., Sakata, Y., Sugawara, S., Enya, K., Suganuma, M., Tomita, H., Aoki, T.,, Peterson, B. A., 2009, ApJL, 700, L109
- Krolik et al. (1991) Krolik, J. H., Horne, K., Kallman, T. R., Malkan, M. A., Edelson, R. A., Kriss, G. A., 1991, ApJ, 371, 541
- Landt et al. (2011) Landt, H., Elvis, M., Ward, M. J., Bentz, M. C., Korista, K. T., Karovska, M., 2011, MNRAS in press
- Marconi et al. (2003) Marconi, A., Hunt, L. K., 2003, ApJL, 589, L21
- Marconi et al. (2004) Marconi, A., Risaliti, G., Gilli, R., Hunt, L. K., Maiolino, R., Salvati, M., 2004, MNRAS, 351, 169
- Marasto (2005) Maraston, C., 2005, MNRAS, 362, 799
- Mauch et al. (2007) Mauch, T., Sadler, E. M., 2007, MNRAS, 375, 931-950
- Minezaki et al. (2006) Minezaki, T., Yoshii, Y., Kobayashi, Y., Enya, K., Suganuma, M., Tomita, H., Koshida, S., Yamauchi, M., Aoki, T., 2006, ApJ, 643, L5
- Nandra et al. (2000) Nandra, K., Le, T., George, I. M., Edelson, R. A., Mushotzky, R. F., Peterson, B. M., Turner, T. J., 2000, ApJ, 544, 734
- Netzer et al. (2007) Netzer, H., Trakhtenbrot, B., 2007, ApJ, 654, 754
- Ogle et al. (2004) Ogle, P. M., Mason, K. O., Page, M. J., Salvi, N. J., Cordova, F. A., McHardy, I. M., Priedhorsky, W. C., 2004, ApJ, 606, 151
- Peletier et al. (1999) Peletier, R. F., Balcells, M., Davies, R. L., Andredakis, Y., Vazdekis, A., Burkert, A., Prada, F., 1999, MNRAS, 310, 703
- Peletier et al. (1997) Peletier, R. F., Balcells, M., 1997, New Astronomy, 1, 349
- Peterson et al. (2994) Peterson, B. M., Ferrarese, L., Gilbert, K. M., Kaspi, S., Malkan, M. A., Maoz, D., Merritt, D., Netzer, H., Onken, C. A., Pogge, R. W., Vestergaard, M., Wandel, A., 2004, ApJ, 613, 682
- Peterson et al. (2005) Peterson et al., 2005, ApJ, 632, 799
- Shemmer et al. (2001) Shemmer, O. et al., 2001 ApJ, 561, 162
- Shield (1999) Shields, G. A., 1999, arXiv:astro-ph/9903401
- Shopbell et al. (1999) Shopbell, P. L., Veilleux, S., Bland-Hawthorn, J., 1999, ApJL, 524, L83
- Suganuma et al. (2006) Suganuma, M., Yoshii, Y., Kobayashi, Y., Minezaki, T., Enya, K., Tomita, H., Aoki, T., Koshida, S., Peterson, B. A., 2006, ApJ, 639, 46
- Tananbaum et al. (1979) Tananbaum, H., Avni, Y., Branduardi, G., Elvis, M., Fabbiano, G., Feigelson, E., Giacconi, R., Henry, J. P.; Pye, J. P., Soltan, A., Zamorani, G., 1979 , ApJL, 234, L9
- Tomita et al. (2006) Tomita, H., Yoshii, Y., Kobayashi, Y., Minezaki, T., Enya, K., Suganuma, M., Aoki, T., Koshida, S., Yamauchi, M., 2006, ApJL, 652, L13
- Türler et al. (1999) Türler, M., et al., 1999, A&A, 134, 89
- Uttley et al. (2003) Uttley, P., Edelson, R., McHardy, I. M., Peterson, B. M., Markowitz, A., 2003, ApJl, 584, L53
- Wanders et al. (1997) Wanders, I., et al., 1997, ApJS, 113, 69
- Wang et al. (2009) Wang, J., Mao, Y. F., Wei, J. Y., 2009, AJ, 137, 3388
- Woo et al. (2002) Woo, J-H, Urry, C. M., 2002, ApJ, 579, 530
- Zamorani et al. (1981) Zamorani, G., Henry, J. P., Maccacaro, T., Tananbaum, H., Soltan, A., Avni, Y., Liebert, J., Stocke, J., Strittmatter, P. A., Weymann, R. J., Smith, M. G., Condon, J. J., 1981, ApJ, 245, 357