How peculiar was the recent extended minimum - A hint towards double minima
Abstract
In this paper, we address the controversy regarding the recent extended solar minimum as seen in helioseismic low- and intermediate-degree mode frequencies: studies from different instruments identify different epochs of seismic minima. Here we use mode frequencies from a network of six identical instruments, Global Oscillation Network Group, continuously collecting data for more than 15 years, to investigate the epoch of minimum in solar oscillation frequencies prior to the beginning of solar cycle 24. We include both low- and intermediate-degree modes in the range of 0 – 120 and frequency range of 2.0 – 3.5 mHz. In this analysis, we demonstrate that there were indeed two minima in oscillation frequencies, depending upon the degree of modes, or more precisely the lower turning point radius of the propagating wave. We also analyze frequencies as a function of latitude to identify the beginning of solar cycle 24. We observe two minima at high latitudes and a single minimum at mid/low latitudes. This scenario is in contrast to cycle 23 where the epoch of seismic minimum did not change with latitude or depth. Our results also hint towards a possible role of the relic magnetic field in modifying the oscillation frequencies of modes sampling deeper layers.
1 INTRODUCTION
The prolonged period of minimal solar activity and the delayed onset of solar cycle 24 have invoked a great deal of interest among solar physicists to identify precisely when the activity minimum occurred and how different it was from previously recorded minima. A variety of data from the solar interior to the corona has been analyzed to seek the origin of such an unusually low solar activity for a long duration (e.g., see articles in Cranmer, Hoeksema & Kohl 2010). All of these analyses indicate that the current minimum was much deeper than previous ones in modern era. Since the source of solar activity is believed to lie in a shear layer at the base of the convection zone, known as the tachocline, the analysis of helioseismic data is important in order to probe these regions. Fortunately, the availability of continuous, consistent helioseismic data for two consecutive solar minima has provided a unique opportunity to study the changes in the solar interior that might have led to this unusual minimum.
Using Birmingham Solar-Oscillation Network (BiSON) frequencies of low-angular degree ( 3) modes for about three solar cycles, Broomhall et al. (2009) found that the frequencies were significantly lower in the extended minimum as compared to those during the previous ones. Similar results were obtained by Salabert et al. (2009) in an analysis based on the data collected by the space-based Global Oscillations at Low Frequencies (GOLF) on board the Solar and Heliospheric Observatory (SOHO) spacecraft (Gabriel et al., 1995). They further pointed out that cycle 24 started in late 2007, despite the absence of any visible activity on the solar surface. The analyses of modes in intermediate-degree range between 20 and 150, obtained from the Global Oscillation Network Group (GONG: Harvey et al. (1996)), also showed lower oscillations frequencies during the recent minimum (Jain et al., 2010; Tripathy et al., 2010), however these studies did not identify the minimum as occurring until the end of 2008, leading to an extended phase of low activity. Furthermore, the zonal and meridional flow patterns inferred from inverting frequencies also suggested a delayed onset of the new cycle. Howe et al. (2009) compared the evolution of the zonal flow pattern in the upper convection zone and suggested that the mid-latitude flow band corresponding to the recent cycle moved more slowly towards the equator than was observed in the previous cycle. As a result, there was a gradual increase in the apparent length of the cycle. Antia & Basu (2010) confirmed these results and compared the behavior of the low-latitude prograde band in past two minima. They pointed out that the flow band bifurcated in 2005 after merging in 2000, and merged again in 2007 before disappearing around the beginning of the new activity cycle in 2009. This is different from the previous minimum where split bands merged at the beginning of 1996 and disappeared soon after the activity minimum was reached. Evidence that the meridional circulation developed at medium-high latitudes before the beginning of a new cycle also supported the extended duration of low/no activity and delayed onset of cycle 24 (González Hernández et al., 2010).
While most studies suggest that the beginning of cycle 24 occurred in late 2008/early 2009, the results from the low-degree mode frequencies were puzzling. In this context, we investigate the response of frequencies of low-degree as well as intermediate-degree modes during the recent extended period of low activity. The low-degree frequencies analyzed by Salabert et al. (2009) were obtained by unresolved (Sun-as-a-star) Doppler velocity observations, while intermediate-degree frequencies, studied by Tripathy et al. (2010), were obtained with resolved Doppler observations. To eliminate the influence, if any, of the techniques of observation and mode fitting, we use data from a network of six identical instruments that treats both low- and intermediate-degree modes in a similar way. Finally, the depth and latitudinal dependence of the modes are studied during the last two minima. We present an analysis confined to modes that sense information from the tachocline region at different latitudes which provides useful information on the rise of a new cycle at mid latitudes.
2 DATA
We use -mode frequencies, obtained from the GONG111ftp://gong.nso.edu/data/, for the individual () multiplets, , where is the radial order and is the azimuthal order, running from to . The mode frequencies for each multiplet were estimated from the power spectra constructed by the time series for individual GONG Month (GM = 36 days). Here we used the standard GONG peak-fitting algorithm to compute the power spectra based on the multitaper spectral analysis coupled with a Fast Fourier transform (Komm et al., 1999). Finally, Lorentzian profiles were used to fit the peaks in the spectra using a minimization scheme guided by an initial guess table (Anderson, Duvall, Jr. & Jefferies, 1990; Hill et al., 1998). The guess table is based on fits to a special data set – a ’grand average’ of six 3-month periods at the beginning of GONG operation (R. Howe 2011, private communication) and is consistent for all data sets. Frequencies for m 0 are calculated by applying a Legendre rotation expansion to the m 0 frequencies.
The data analyzed here consist of 293 36-day overlapping data sets, with a spacing of 18 days between consecutive data sets, covering the period from 1995 May 7 to 2009 October 31 (i.e. GM = 1 – 147) in 5-minute oscillation band; 2000 3300 Hz and 0 120. Thus, these data sets start about a year before the minimum of solar cycle 23 and end several months after the minimum of solar cycle 24. While most of earlier analysis are based on the -averaged frequencies, our analysis based on () multiplets has the advantage of studying latitudinal variations in frequency shifts that allows us to investigate the changes around the activity belt where signatures of the rise of a new solar cycle first appear.
3 RESULTS
3.1 Epochs of minima in acoustic oscillations and solar activity
We calculate shifts in frequencies with respect to the guess frequencies, as used by the GONG pipeline in the fitting of a particular multiplet (). Since the frequency shift has a well-known dependency on frequency and mode inertia (Jain, Tripathy & Bhatnagar, 2001), we consider only those modes that are present in all data sets and the shifts are scaled by the mode inertia as defined by Christensen-Dalsgaard & Berthomieu (1991). The mean frequency shifts, , is calculated from the following relation,
| (1) |
where is the inertia ratio, is the error in frequency measurement, and is the change in measured frequency for a given , and . We also calculate a 11-point (i.e. 216 days) running mean of frequency shifts to smooth out short-term variations. This is shown by solid lines in all figures. The epoch of minimum in each case is defined by the lowest value in computed smoothed frequency shifts during the low-activity phase of solar cycle.
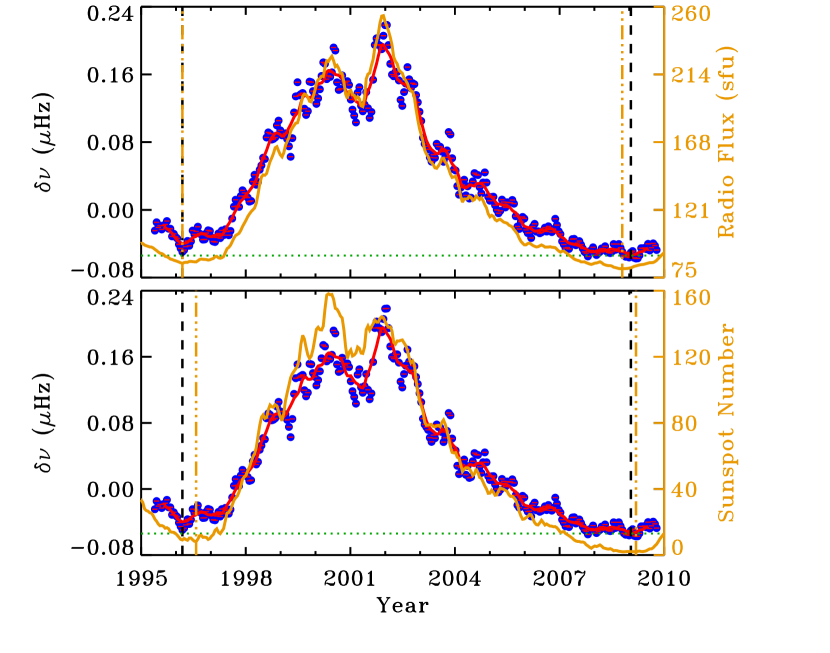
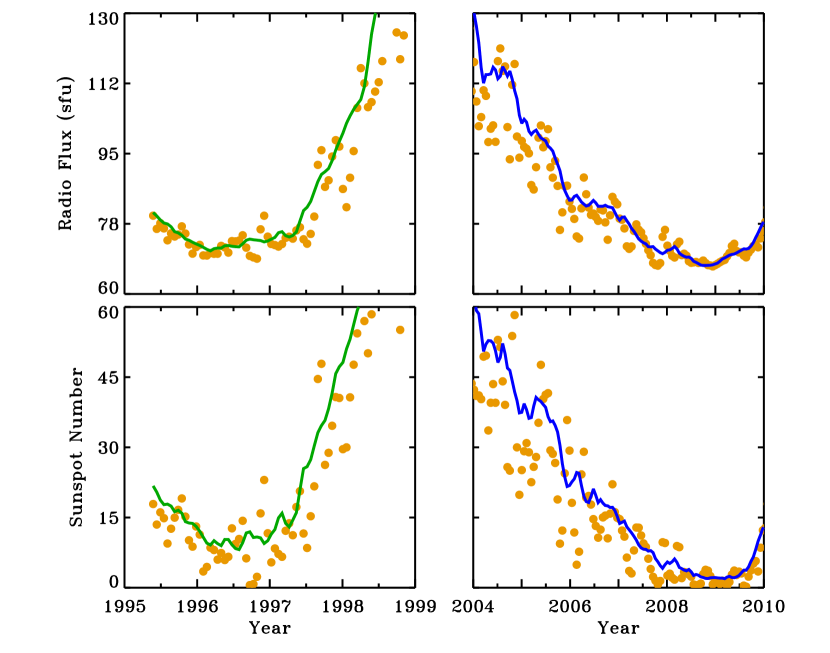
The temporal variation of calculated is shown in Figure 1. Dashed vertical lines correspond to the minima in frequency shifts as determined from the smoothed values. It is evident that the minimum at the beginning of solar cycle 23 (henceforth MIN23) occurred in early 1996 while the beginning of 2009 represented the minimum during the current extended phase of low activity. We also plot the variation of sunspot numbers222ftp://ftp.ngdc.noaa.gov/STP/SOLAR_DATA/SUNSPOT_NUMBERS/INTERNATIONAL and the 10.7 cm radio flux333ftp://ftp.ngdc.noaa.gov/STP/SOLAR_DATA/SOLAR_RADIO/FLUX/Penticton_Adjusted, calculated over the same period as the frequency shifts and smoothed with an 11-points running mean. The smoothed-sunspot numbers show minima in mid 1996 and early 2009, respectively which are slightly displaced from the minima seen in radio flux. Furthermore, the frequencies during the minimum prior to solar cycle 24 (henceforth MIN24) were lower than those during MIN23 in agreement with earlier results (Tripathy et al. (2010); and references therein). This difference is estimated to be around 0.015 Hz. The most significant discrepancy between and sunspot numbers is seen at the solar maximum where twin peaks show opposite behavior. The first peak in sunspot number (mid-2000) is higher than the secondary pear (late-2001), while frequency shifts had a maximum around secondary peak. This has already been discussed, in both low- and intermediate-degree modes (Chaplin et al., 2007; Jain, Tripathy & Hill, 2009a). The linear correlation coefficients calculated using unsmoothed and smoothed values of frequency shift and activity indices are given in Table I. It is evident that there is a decrease in correlation during the minimum phase of the solar cycle as discussed in our earlier work with fewer data points (Jain, Tripathy & Hill, 2009b). This decrease in correlation for smoothed values is not as significant as for the unsmoothed values of frequency shifts and activity indices. The correlation coefficients obtained for both indices using smoothed values are comparable, i.e. 0.89 and 0.91 for sunspot number and radio flux, respectively, at MIN23, and 0.96 and 0.97 at MIN24. We do not notice any significant change in correlation between unsmoothed frequency shifts and activity indices at two minima, however smoothed frequency shifts are better correlated with solar activity than at MIN23. Contrary to these results, by analyzing GOLF data, Salabert et al. (2009) found an anti-correlation between frequency shifts of = 0 and = 2, and activity indices at MIN24. In addition, Broomhall et al. (2009) also showed large difference between the activity proxy and the frequency shifts of low- modes, obtained from the BISON network, during the declining phase of the cycle 23.
3.2 dependence of the epochs of minima
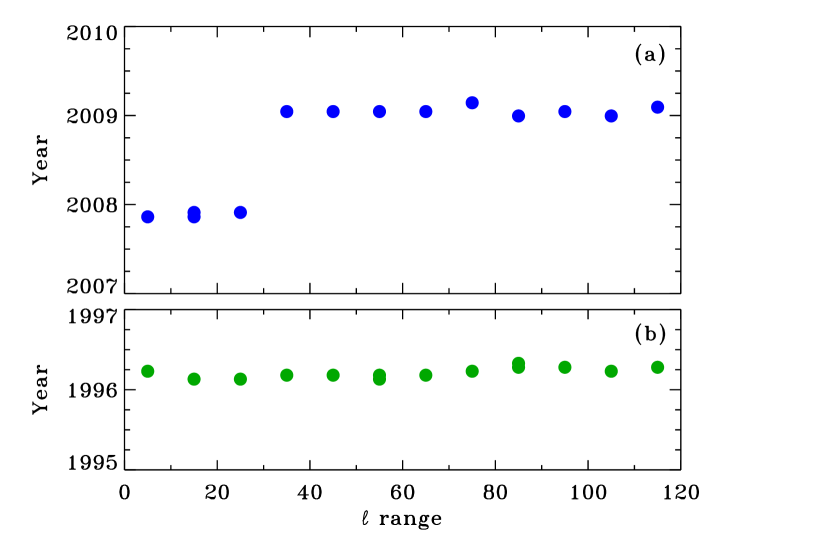
To investigate the angular degree dependence on frequency shifts, we illustrate, in Figure 2, the epochs of minima in frequency shifts for different ranges, from 0 to 120 in steps of 10, at MIN23 and MIN24. We define the epochs of minimum as periods of lowest values of smoothed frequency shifts within 1 error. This criterion suggests a few epochs where the minimum is extended over more than one data point for a particular range. It is seen that the frequency minimum at the MIN23 for all ranges was in early 1996 with the interval between the earliest and the latest minima is about 54 days. In contrast, there were two minima at MIN24 depending on the range. For = 0 – 10, 10 – 20 and 20 – 30, the minimum was in late 2007 which coincides with the minimum seen in GOLF low- frequencies (Salabert et al., 2009). On the other hand, the beginning of 2009 was the minimum for other ranges () which supports the results of intermediate-degree mode frequencies (Tripathy et al., 2010). Thus, for the first time, the temporal variation of frequency shifts indicates an unusual scenario at MIN24 where low- and intermediate-degree modes sense different minima.
To validate these findings, we divide the solar interior into four distinct layers and investigate the temporal variation with depth approximated by , which is defined by the relation (Christensen-Dalsgaard & Berthomieu, 1991)
| (2) |
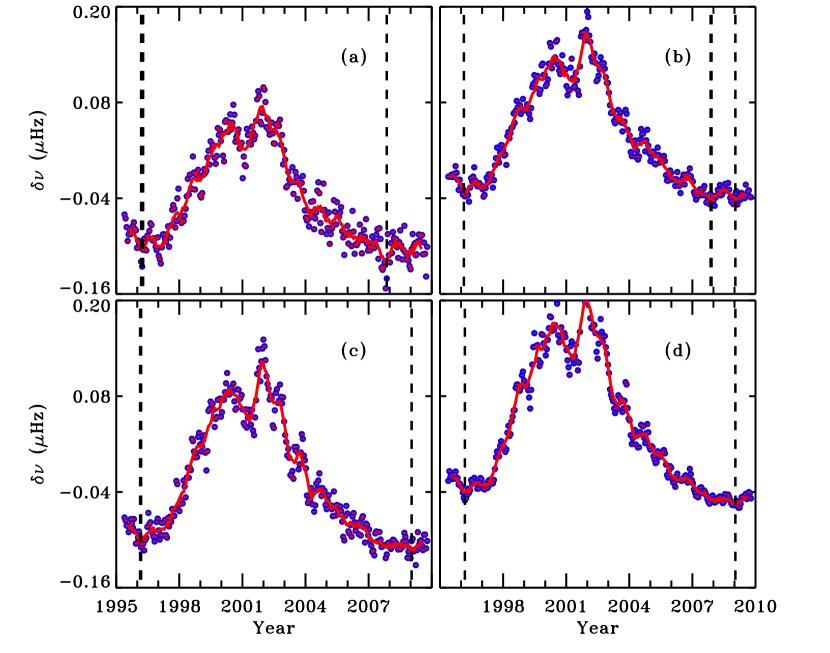
where is the sound speed and is the lower turning point radius. A higher value of denotes a smaller value of and hence a greater depth. In Figure 3, we plot temporal variation of frequency shifts for modes with their turning point radius in the core ( = 0.0 – 0.3), the radiative zone ( = 0.3 – 0.7), near the tachocline ( = 0.71 – 0.73), and the convection zone ( = 0.7 – 1.0) where is the radius of the Sun. About 1%, 12% and 2% of total modes are found to have their turning points in the core, radiative zone and tachocline respectively, while the rest of the modes were confined to the convection zone. Since the sound speed increases rapidly with depth, the acoustic modes spend less time in the deeper layers than the shallower layers, hence these modes are more influenced by changes in outer layers. Figure 3 shows that the epoch of minimum at MIN23 was at the beginning of 1996 in all four cases while it varied with depth range at MIN24. Note that the modes with turning point radius in the core are mainly dominated by low- values and sense a minimum a year earlier than in other three layers. This is in agreement with Figure 2 of this paper and also with Salabert et al. (2009). Further, we see two dips in frequency shifts in Panels (a) and (b) during the recent minimum but the lowest of these dips in Panel (a) is at the end of 2007 while the minimum in Panel (b) is reached at two different times separated by about a year. Two dips apart by 2 years during the minimum of cycle 24 have been reported in low- BiSON and GOLF frequencies (Broomhall et al., 2009; Fletcher et al., 2010); these have been interpreted as the signature of a second dynamo just below the solar surface. We also notice the minimum in frequencies with around the tachocline (Panel c) and in the convection zone (Panel d) at the beginning of 2009 in agreement with the appearance of activity at the solar surface. These results clearly indicate the complex nature of the relationship between oscillation frequencies and solar magnetic activity.
3.3 Latitudinal dependence of the epochs of minima
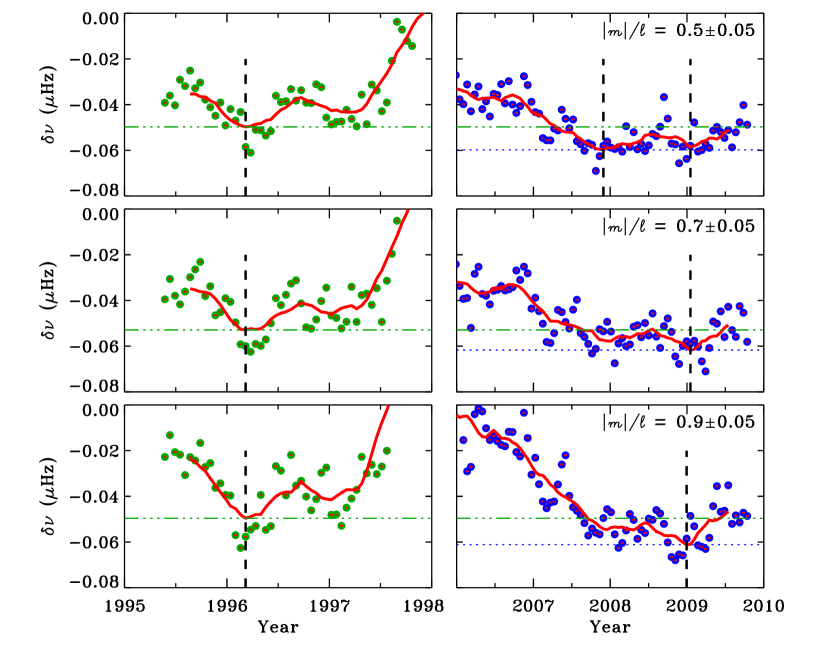
Since the magnetic activity related to a new solar cycle emerges first at mid latitudes, we follow the changes in mode frequencies as a function of the latitude using different values of . For = 1, the modes are sensitive to the regions near the equator while = 0 represents modes with sensitivity at higher latitudes. Figure 4 shows the mean variation in frequency shifts at selected values of during MIN23 and MIN24. We again notice that the frequencies at all latitudes during MIN24 are lower than those during MIN23. Further, in view of the above discussion, it is not surprising to obtain a single epoch of minimum at MIN23 for all three values of . On the contrary, the frequency shifts hint towards a double minima at MIN24 for = 0.5, and a single minimum for = 0.7 and 0.9. Although most of well-known surface activity indices do not indicate the minimum in late 2007, as the downward trend in their values continued until the end of 2008, there are observations where early signs of the beginning of the new cycle were possibly seen. The appearance of a sunspot in Active Region 10981 for three consecutive days during 2008 Jan 4 – 6 at high latitude (30o N) with new cycle polarities hinted towards the rise of cycle 24 in early 2008 (Phillips, 2008a). However, more sunspots fulfilling the criteria of cycle 24 were not visible for several months after 2008 January. The emergence of three big sunspots at low latitudes with previous cycle polarities a few months later (magnetic polarity in accordance with cycle 23) suggested that the minimum after cycle 23 had not yet been reached (Phillips, 2008b). These observations are not unusual as sunspots from both cycles are randomly seen during the minimum before approaching the bottom level of the activity. The two strong dips seen in oscillation frequencies at certain latitudes can be understood in terms of localized changes in the activity level. The mean variation in sunspot number and radio flux during the two minima discussed here is shown in Figure 5. A close examination of the right panels of Figure 5 reveals that there was indeed a slight rise in activity at the beginning of 2008 but the trend did not continue. The two dips seen in oscillation frequencies may be interpreted as the manifestation of the competition between the magnetic fields from both the solar cycles. We also note periodic variations in that are addressed in Section 4.
3.4 Minimum as seen in the tachocline region
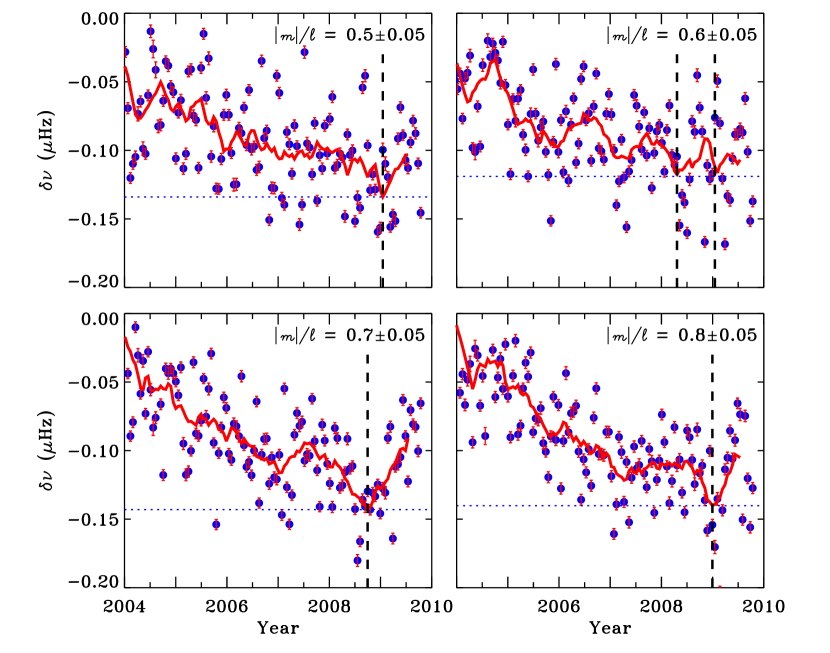
In order to explore the conditions near the tachocline at different latitudes during the extended minimum, we plot, in Figure 6, the mean variation in frequency shifts since 2004 for four values (0.5 0.8) combined with lower turning point of modes in the depth range of = 0.71 –0.73. Although there is a large scatter in , the 11-point running mean, in all cases, clearly indicates the strongest dips occurred around the end of 2008 except for = 0.6 where another dip is seen in first half of 2008. Further, at = 0.5 and 0.8, we see a plateau from 2007 to mid 2008 and afterwards the frequency started to decrease again. However, for = 0.7, which is closer to the active-latitudinal belt, the frequencies increased at the beginning of 2007 before reaching the minimum in last quarter of 2008. This can be compared with the right two panels of Figure 5; although there was a small increase in solar activity around the beginning of 2008, the activity level after mid 2007 did not change much. This was the period of low activity when a very few sunspots were visible for long periods, and other solar activity indices, e.g. radio flux, followed a slow decrease before approaching the minimum. As the frequency variation for three values of values clearly shows a sharp dip near the minimum and an increase in the frequencies after the minimum in late 2008, the variation at = 0.6 is not conclusive where we see two minima; one in second quarter and other at the end of 2008. The = 0.6 corresponds to the region near active-latitude belt where the signatures of a new cycle are expected to emerge first. As mentioned earlier, the sunspots from both previous and new cycles during the minimum phase appeared randomly on the solar disk and there were a large number of spotless days before the rise of cycle 24, we thus speculate that the different behaviour at = 0.6 might have resulted from these observed facts. The solar activity indicators, as shown in Figure 5, also support the rise of solar cycle 24 after 2008.
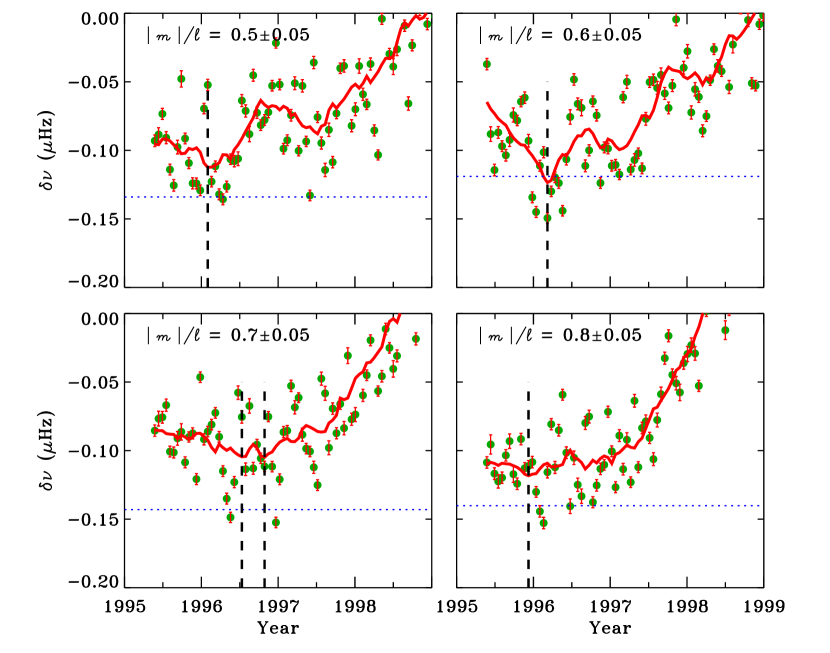
Figure 7 shows a similar variation in frequencies during the minimum of cycle 23. The top two panels, corresponding to = 0.5 and 0.6, show periodic variations while we find a relatively smooth trend for the modes at = 0.7 and 0.8. As expected, for values of lying within the active-latitudinal belt, the variation is similar to that seen in activity indices (left panels of Figure 5). Thus, the minimum reached in oscillation frequencies near the tachocline does not change significantly with latitudes and coincides with the minimum in visible surface activity.
4 DISCUSSION
It is been argued for a long time that the perturbations of near-surface layers generated by the changes at the tachocline are mainly responsible for the changes in frequencies, however the observations during the extended minimum provides an indication that there might be some effects from layers as deep as the core. The analysis of mode frequencies with lower turning points in the inner 30% of solar interior indicates a minimum earlier than that obtained in outer layers or surface activity. Further, Fletcher et al. (2010) reported a quasi-biennial (2 year) signal in low-degree solar oscillation mode frequencies. Their study suggests that the 2 year signal, a predominantly additive contribution to the acoustic 11 year signal, has its origin in significantly deeper layers than the 11 year signal and is positioned below the upper turning point of the modes. Since the depth of a mode’s upper turning point increases with decreasing frequency, one can expect low- modes to be more influenced by the shallower layers. Thus, they argued that a second dynamo, seated near the bottom layer extending 5% below the solar surface, may be responsible for the 2 year signal. Finally, the presence of two dynamos operating at different depths might be responsible for the observed double minima during the extended period of low activity.
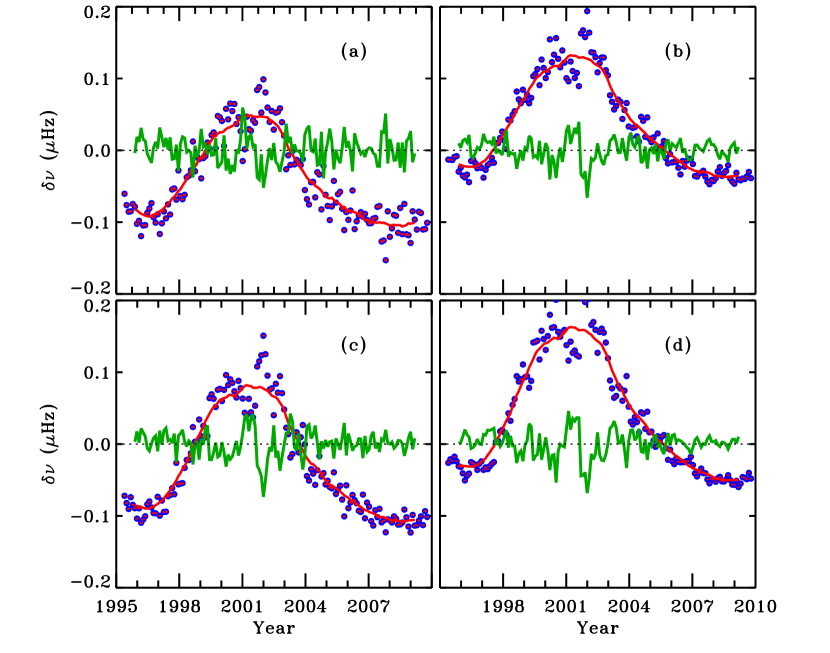
To examine this quasi-biennial signal in the GONG frequencies, we follow the procedure as adopted by Fletcher et al. (2010); we subtract a smooth trend from mean shifts of independent time series by applying a boxcar filter of width 2 years. Figure 8 illustrates both the 11-year signal of the solar cycle and the frequency residuals for four different layers discussed in Figure 3. Although we find a weak 2-year periodicity at high activity period which is similar to the periodicity seen in proxies of solar activity (Benevolenskaya, 1998), no significant trend during the periods of low activity is noticed. We further apply the fast Fourier transformation to identify any significant trend in the frequency residuals. We did not find any prminent peak in this analysis which indicates that no other periodicity, except the 11-year solar cycle signal, is present in the GONG data. Thus, the absence of any significant trend of quasi-biennial signal (except during periods of high activity) suggests a different scenario that hints towards different physical processes which might be involved at different depths.
To investigate the solar origin of double minima seen in the oscillation frequencies, we consider two major fields inside the Sun: (i) a weak field at the core that plays a crucial role in the generation of 22-year magnetic polarity cycle (Mursula, Usoskin & Kovaltsov, 2001) and is believed to have been present in the Sun since its formation (Cowling, 1945), (ii) a megagauss field just beneath the convection zone that is responsible for the dynamo mechanism (Dziembowski & Goode, 1989) and the 11-year cyclic variation in solar activity. We speculate that a competition between these fields plays a significant role in explaining the variation in oscillation frequencies. It is possible that the relic field senses the minimum eariler than the field seated at the base of the convection zone. This is manifested in the form of early minimum seen in low-degree modes whose lower tuning points lie in the core. Further, the existence of two minima for the modes returning from radiative zone indicate an inter-connection between weak and strong magnetic fields. We anticipate that these fields affect the frequencies in all solar cycles but the influence due to relic field is shielded by the higher field strength. However, during the extended minimum phase, the magnetic field generated by the solar dynamo was relatively weak and hence the effect of the relic field could be observed.
The scenario presented here is speculative in nature since the information about the interior can only be obtained through indirect measurements, e.g. frequencies of solar oscillations. The continuing efforts to measure high-precision oscillation data for a complete 22-year magnetic cycle may unveil the influence of a relic field on the variation of oscillation frequencies.
5 SUMMARY
Using uninterrupted and uniform acoustic mode oscillation frequencies from GONG, we investigated the variation of frequency shifts during the last two solar activity minima. Although the perturbations of near-surface layers generated by the changes at the tachocline are mainly responsible for the changes in frequencies, the observations during the extended minimum suggest that there might be some effect from the layers as deep as the core. Our analysis provides evidence for a double minima in oscillation frequencies during the current prolonged low activity phase. It also supports previous results obtained with GOLF and GONG data for low- and intermediate degree modes respectively, where different epochs of minimum were reported on the basis of angular degree (Salabert et al., 2009; Tripathy et al., 2010). In other words, the minima seen in oscillation frequencies vary with the depth of turning point radius of the modes. The waves reaching the inner 30% of the interior exhibit a minimum one year earlier than that from the outermost 30% which is in agreement with the surface-activity minmum. Although there is considerable evidence for the variation of oscillation frequencies in phase with the surface activity, the analysis presented in this paper hints towards a possible role of relic magnetic fields in changing the oscillation frequencies which was addressed by Gough & Thompson (1990). We also searched for a quasi-biennial signal in the GONG frequencies in order the explore the influence of a possible second dynamo in the shallower sub-surface layers. The unclear trend obtained in this analysis neither supports nor rules out the arguments made by Fletcher et al. (2010). We emphasize that this analysis has been made possible with the access to continuous high-precision oscillation data for more than a solar cycle, in particular during the prolonged unusually low activity period. These results are important to understand the origin of the modification of oscillation frequencies which have been known to vary with the phase of activity cycle for last two decades, but whose detailed physical mechanism still remains an open question.
References
- Anderson, Duvall, Jr. & Jefferies (1990) Anderson, E. R., Duvall, Jr.,T. L., & Jefferies, S. M. 1999, ApJ, 364, 699
- Antia & Basu (2010) Antia, H. M., & Basu, S. 2010, ApJ, 720, 494
- Benevolenskaya (1998) Benevolenskaya, E. E. 1998, ApJ, 509, L49
- Broomhall et al. (2009) Broomhall, A.-M., Chaplin, W. J., Elsworth, Y., Fletcher, S. T., New, R. 2009, ApJ, 700, L162
- Chaplin et al. (2007) Chaplin, W. J., Elsworth, Y., Miller, B. A., & Verner, G. A. 2007, ApJ, 659, 1760
- Christensen-Dalsgaard & Berthomieu (1991) Christensen-Dalsgaard, J., & Berthomieu, J. 1991, in Solar Interior and Atmosphere, ed. A. N. Cox, W. C. Livingston, & M. Matthews (Tucson: University of Arizona Press) p.401
- Cowling (1945) Cowling, T. G 1945, MNRAS, 105, 166
- Cranmer, Hoeksema & Kohl (2010) Cranmer S. R., Hoeksema, J. T., & Kohl, J. L. (eds.) 2010, ASP Conf. Ser. 428, SOHO-23: Understanding a Peculiar Solar Minimum (San Francisco, CA: ASP)
- Dziembowski & Goode (1989) Dziembowski, W. A., & Goode, P. R. 1989, ApJ, 347, 540
- Fletcher et al. (2010) Fletcher, S. T., Broomhall, A.-M., Salabert, D., Basu, S., Chaplin, W. J., Elsworth, Y., García, R., New, R. 2010, ApJ, 718, L19
- Gabriel et al. (1995) Gabriel, A. H. et al. 1995, Sol. Phys., 162, 61
- González Hernández et al. (2010) González Hernández, I., Howe, R., Komm, R., & Hill, F. 2010, ApJ, 713, L16
- Gough & Thompson (1990) Gough, D. O., & Thompson, M. J. 1990, MNRAS, 262, 25
- Harvey et al. (1996) Harvey, J. W., el al. 1996, Science, 272, 1284
- Hill et al. (1998) Hill, F., Anderson, E., Howe, R., Jefferies, S. M., Komm, R., & Toner, C. G., 1998, in Dynamics of Interiorof the Sun and Sun-like Stars, ed. S. G. Korezennik & A. Wilson (ESA SP-418; Noordwijk: ESA), 231
- Howe et al. (2009) Howe, R., Christensen-Dalsgaard, J., Hill, F., Komm, R., Schou, J., & Thompson, M. J. 2009, ApJ, 701, L87
- Jain, Tripathy & Bhatnagar (2001) Jain, K., Tripathy, S. C., & Bhatnagar, A. 2001, ApJ, 542, 521
- Jain, Tripathy & Hill (2009a) Jain, K., Tripathy, S. C., & Hill, F. 2009a, ApJ, 695, 1567
- Jain, Tripathy & Hill (2009b) Jain, K., Tripathy, S. C., & Hill, F. 2009b, in ASP Conf. Ser. 416, Solar-Stellar Dynamos as revealed by Helio- and Asteroseismology, ed. M. Dikpati, A. Arentoft, I. González Hernández, C. Lindsey, & F. Hill (San Francisco, CA: ASP), 189
- Jain et al. (2010) Jain, K., Tripathy, S. C., Burtseva, O., González Hernández, I., Hill, F., Howe, R., Kholikov, S., Komm, R., & Leibacher, J. 2010, in ASP Conf. Ser. 428, SOHO-23: Understanding a Peculiar Solar Minimum, ed. S. R. Cranmer, J. T. Hoeksema, & J. Kohl (San Francisco, CA: ASP), 57
- Komm et al. (1999) Komm, R. W., Gu, Y., Hill, F., Stark, P. B.; Fodor, I. 1999 ApJ, 519, 407
- Mursula, Usoskin & Kovaltsov (2001) Mursula, K, Usoskin, I. G, & Kovaltsov, G. A. 2001, Sol. Phys., 198, 51
- Phillips (2008a) Phillips, T. 2008a, NASA Science News, http://science.nasa.gov/science-news/science-at-nasa/2008/10jan_solarcycle24/
- Phillips (2008b) Phillips, T. 2008b, NASA Science News, http://science.nasa.gov/science-news/science-at-nasa/2008/28mar_oldcycle/
- Salabert et al. (2009) Salabert, D., García, R. A., Pallé, P. L., & Jiménez-Reyes, S. 2009, A&A, 504, L1
- Tripathy et al. (2010) Tripathy, S. C., Jain, K., Hill, F., & Leibacher, J. W. 2010, ApJ, 711, L84
| Period | Unsmoothed | Smoothed | ||||||||||||||
|---|---|---|---|---|---|---|---|---|---|---|---|---|---|---|---|---|
| Sunspot Number | Radio Flux | Sunspot Number | Radio Flux | |||||||||||||
| All Dataaa1995 May 7 – 2009 October 31 | 0.97 | 0.97 | 0.0 | 0.98 | 0.98 | 0.0 | 0.98 | 0.97 | 0.0 | 0.99 | 0.99 | 0.0 | ||||
| bb1995 May 7 – 1997 December 15 | 0.85 | 0.82 | 210-13 | 0.88 | 0.86 | 310-16 | 0.89 | 0.87 | 110-15 | 0.91 | 0.90 | 310-21 | ||||
| cc2005 December 28 – 2009 October 31 | 0.86 | 0.79 | 110-17 | 0.89 | 0.84 | 110-21 | 0.96 | 0.92 | 710-31 | 0.97 | 0.89 | 210-26 | ||||