Holey topological thermoelectrics
Abstract
We study the thermoelectric properties of three-dimensional topological insulators with many holes (or pores) in the bulk. We show that at high density of these holes the thermoelectric figure of merit can be large due to the contribution of the conducting surfaces and the suppressed phonon thermal conductivity. The maximum efficiency can be tuned by an induced gap in the surface states dispersion through tunneling or external magnetic fields. The large values of , much higher than unity for reasonable parameters, make this system a strong candidate for applications in heat management of nanodevices, especially at low temperatures.
Efficient heat management in nanodevices and energy conversion from wasted heat have been some of the key driving motivations for the search of new thermoelectric materials Snyder and Toberer (2008); Tritt (1999); Hicks and Dresselhaus (1993); Mukerjee and Moore (2007); Markussen et al. (2009); Takahashi and Murakami (2010); Ghaemi et al. (2010); Tretiakov et al. (2010); Lyeo et al. (2004); Venkatasubramanian et al. (2001); Zhang et al. (2010); Teweldebrhan et al. (2010, 2010); Dubi and Di Ventra (2011). Their efficiency rests on the ability of a material to have a low thermal conductivity and high thermopower and electric conductivity. The large thermopower requires steep dependence of the electronic density of states on energy, which can be achieved by having the chemical potential close to the bottom of a band. The relatively high conductivity demands the gap to be low. These combined requirements point to semiconductors with heavy elements as the best candidates for the thermoelectric materials.
A typical band gap for an efficient thermoelectric device at room temperature should be of the order of few hundred meV. Such a low gap can appear in the materials either accidentally or due to a large enough spin-orbit coupling that leads to the inversion of the band structure, thus providing a band-gap of the order of the spin-orbit coupling energy. This latter class of materials, besides being highlighted by their high thermoelectric efficiency, has been identified as having an insulating bulk and topologically protected conducting surfaces with Dirac-like band structure Qi and Zhang (2010); Fu et al. (2007); Hsieh et al. (2008); Chen et al. (2009); hence their name, topological insulators (TI).
The bulk thermoelectric properties of this family of semiconductors have been extensively studied both theoretically Takahashi and Murakami (2010); Ghaemi et al. (2010); Tretiakov et al. (2010) and experimentally Venkatasubramanian et al. (2001); Zhang et al. (2010); Teweldebrhan et al. (2010, 2010). The rather high thermoelectric efficiency found in these materials is the property of the band structure and the heavy atomic masses, and is unrelated to the contribution of the protected surface states — the main focus of this paper. As with most thermoelectric materials, the main stumbling block for increasing the thermoelectric efficiency is the high phonon thermal conductivity. There have been many attempts to decrease it while leaving the electric conductivity intact Poudel et al. (2008); Tang et al. (2010), e.g., by introducing disorder in the material that suppresses phonon transport (phononic glass). The bulk electronic states are however often affected by this disorder as well and it is very difficult to reduce thermal conductivity without also reducing thermopower and electric conductivity Snyder and Toberer (2008).
Here we propose a new approach to increase thermoelectric efficiency by combining the novel properties of the TI materials, i.e., their protected surface states, with methods to reduce thermal conductivity that can enhance the contribution to the conductivity and thermopower from these topological surface states by increasing the surface to volume ratio.
The thermopower efficiency is characterized by the dimensionless thermoelectric figure of merit , where , , , and are the electric conductivity, thermopower, thermal conductivity, and temperature, respectively. This quantity corresponds to the ratio of the output power to the rate of the heat power consumption under an applied temperature gradient.
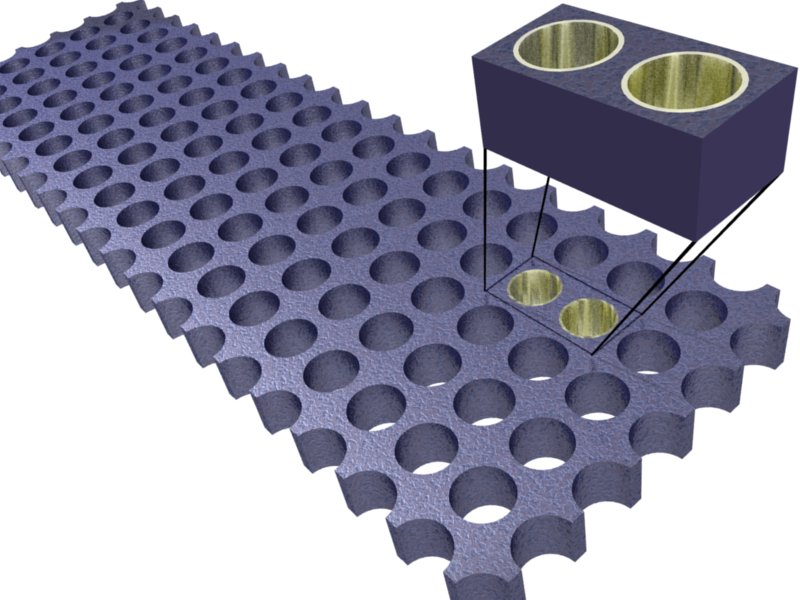
The high surface to bulk ratio can be achieved by nanostructuring 3D topological insulators with many holes in the transport direction. The surface of each hole behaves as a 2D conductor. The effect of the holes is threefold: 1) to suppress phonon thermal conductivity – the strongest limiting factor for , 2) to increase conductivity due to a high contribution of conducting surface, and 3) to allow for the surface states to tunnel and create a smaller subgap to increase further. A sketch of the sample made of a 3D topological insulator with a high density of holes is depicted in Fig. 1. Even at high density of these holes, the topologically protected surface states remain robust. It has been shown that these states survive in the films as thin as of three or more quintuple layers Park et al. (2010).
Reducing thermal conductivity caused by the increased phonon scattering off grain boundaries and defects has been experimentally confirmed recently. For example, in BiSbTe bulk alloys higher has been observed in experiments with nanocrystalline bulk samples made by pressing nanopowders at high temperatures Poudel et al. (2008). Furthermore, high density of periodic nanoscale holes in silicon thin films has been shown to reduce the thermal conductivity by two orders of magnitude Tang et al. (2010).
The unique feature of the topological insulators is that, although they have a bulk energy gap of , they also have ungaped surface states. These propagating states are confined to the close proximity of the surfaces. Their existence is protected by the topology of the bulk band structure. These states have cone-like 2D Dirac spectrum, , where is the constant Dirac electron velocity 111We consider to be energy independent in a wide range of energies. Application of a magnetic field or hybridization of these states due to close proximity of two surfaces can induced a controllable Dirac subgap Linder et al. (2009); Lu et al. (2010). Then the spectrum takes the form . Generally this subgap is much smaller than the bulk gap, . For 3D TIs is roughly from eV (for ) to eV (for ).
To study the transport properties of these materials we use linear response theory Ashcroft and Mermin (1976); Marder (1976). The electric () and thermal () currents are given by linear combinations of the chemical potential and temperature gradients: and , where is the electron charge. Using Onsager relations, one can find from these equations the electrical conductivity , thermopower , and electronic thermal conductivity . The figure of merit, , can then be represented in terms of these linear coefficients as
| (1) |
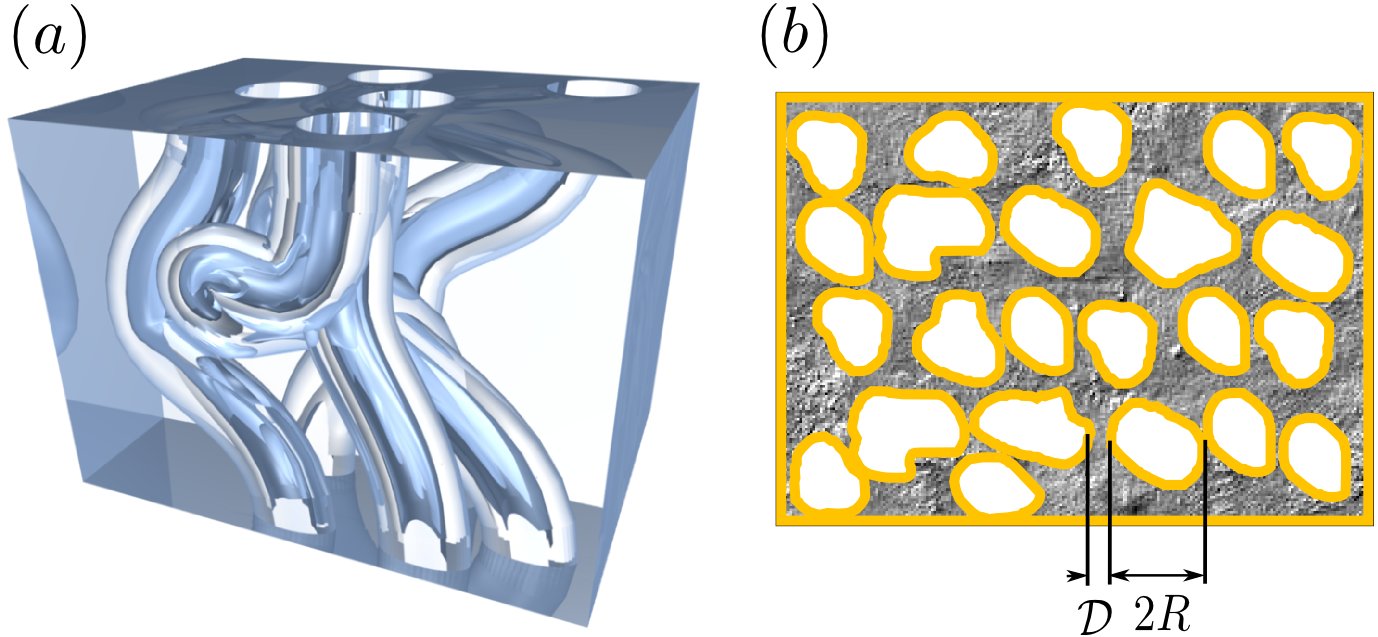
Here is the phonon contribution to the thermal conductivity in the bulk (phonon contribution to the thermal conductivity for the surface TI states is much smaller than that in the bulk). In Eq. (1) it is assumed that the transport coefficients have bulk and surface contributions , where is the factor related to surface/bulk ratio (porosity) and has dimension of length. The parameter characterizes the average distance between the pores (holes) of the average radius , see Fig. 2 (b).
It follows from Eq. (1) that at small , the contribution to mostly comes from 2D surface states and in this limit is given by
| (2) |
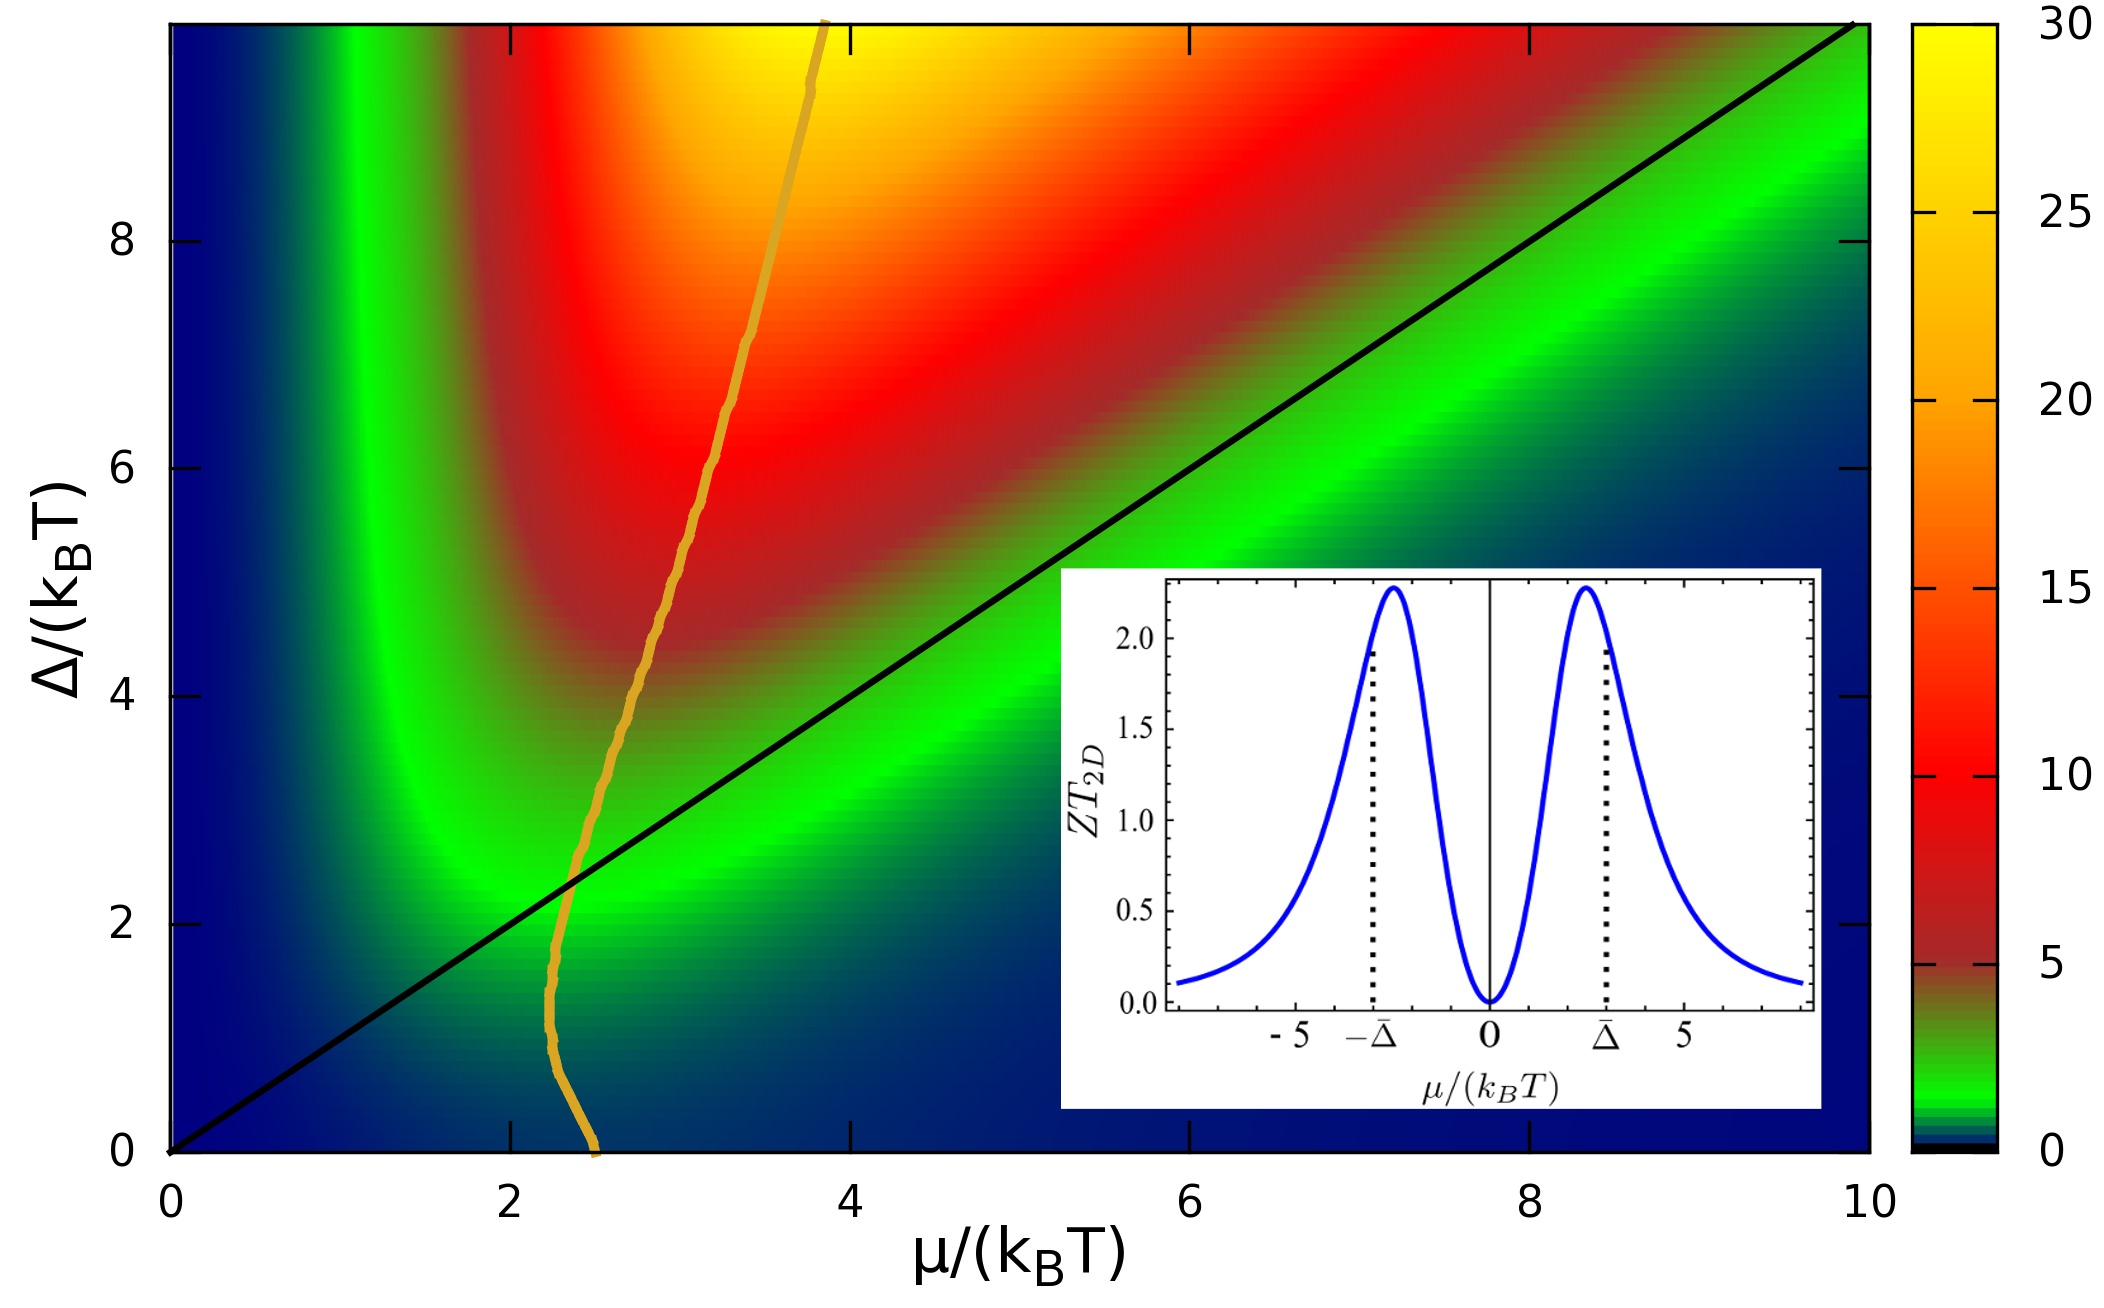
is shown in the inset of Fig. 3 for as a function of the chemical potential. The color plot of as a function of both the induced subgap and chemical potential is shown in Fig. 3. For a fixed induced gap we plot the location of the maximum achievable by tuning the chemical potential (golden line in Fig. 3). The very high values of in reality are not reachable since any small contribution from the phonon thermal conductivity will reduce .
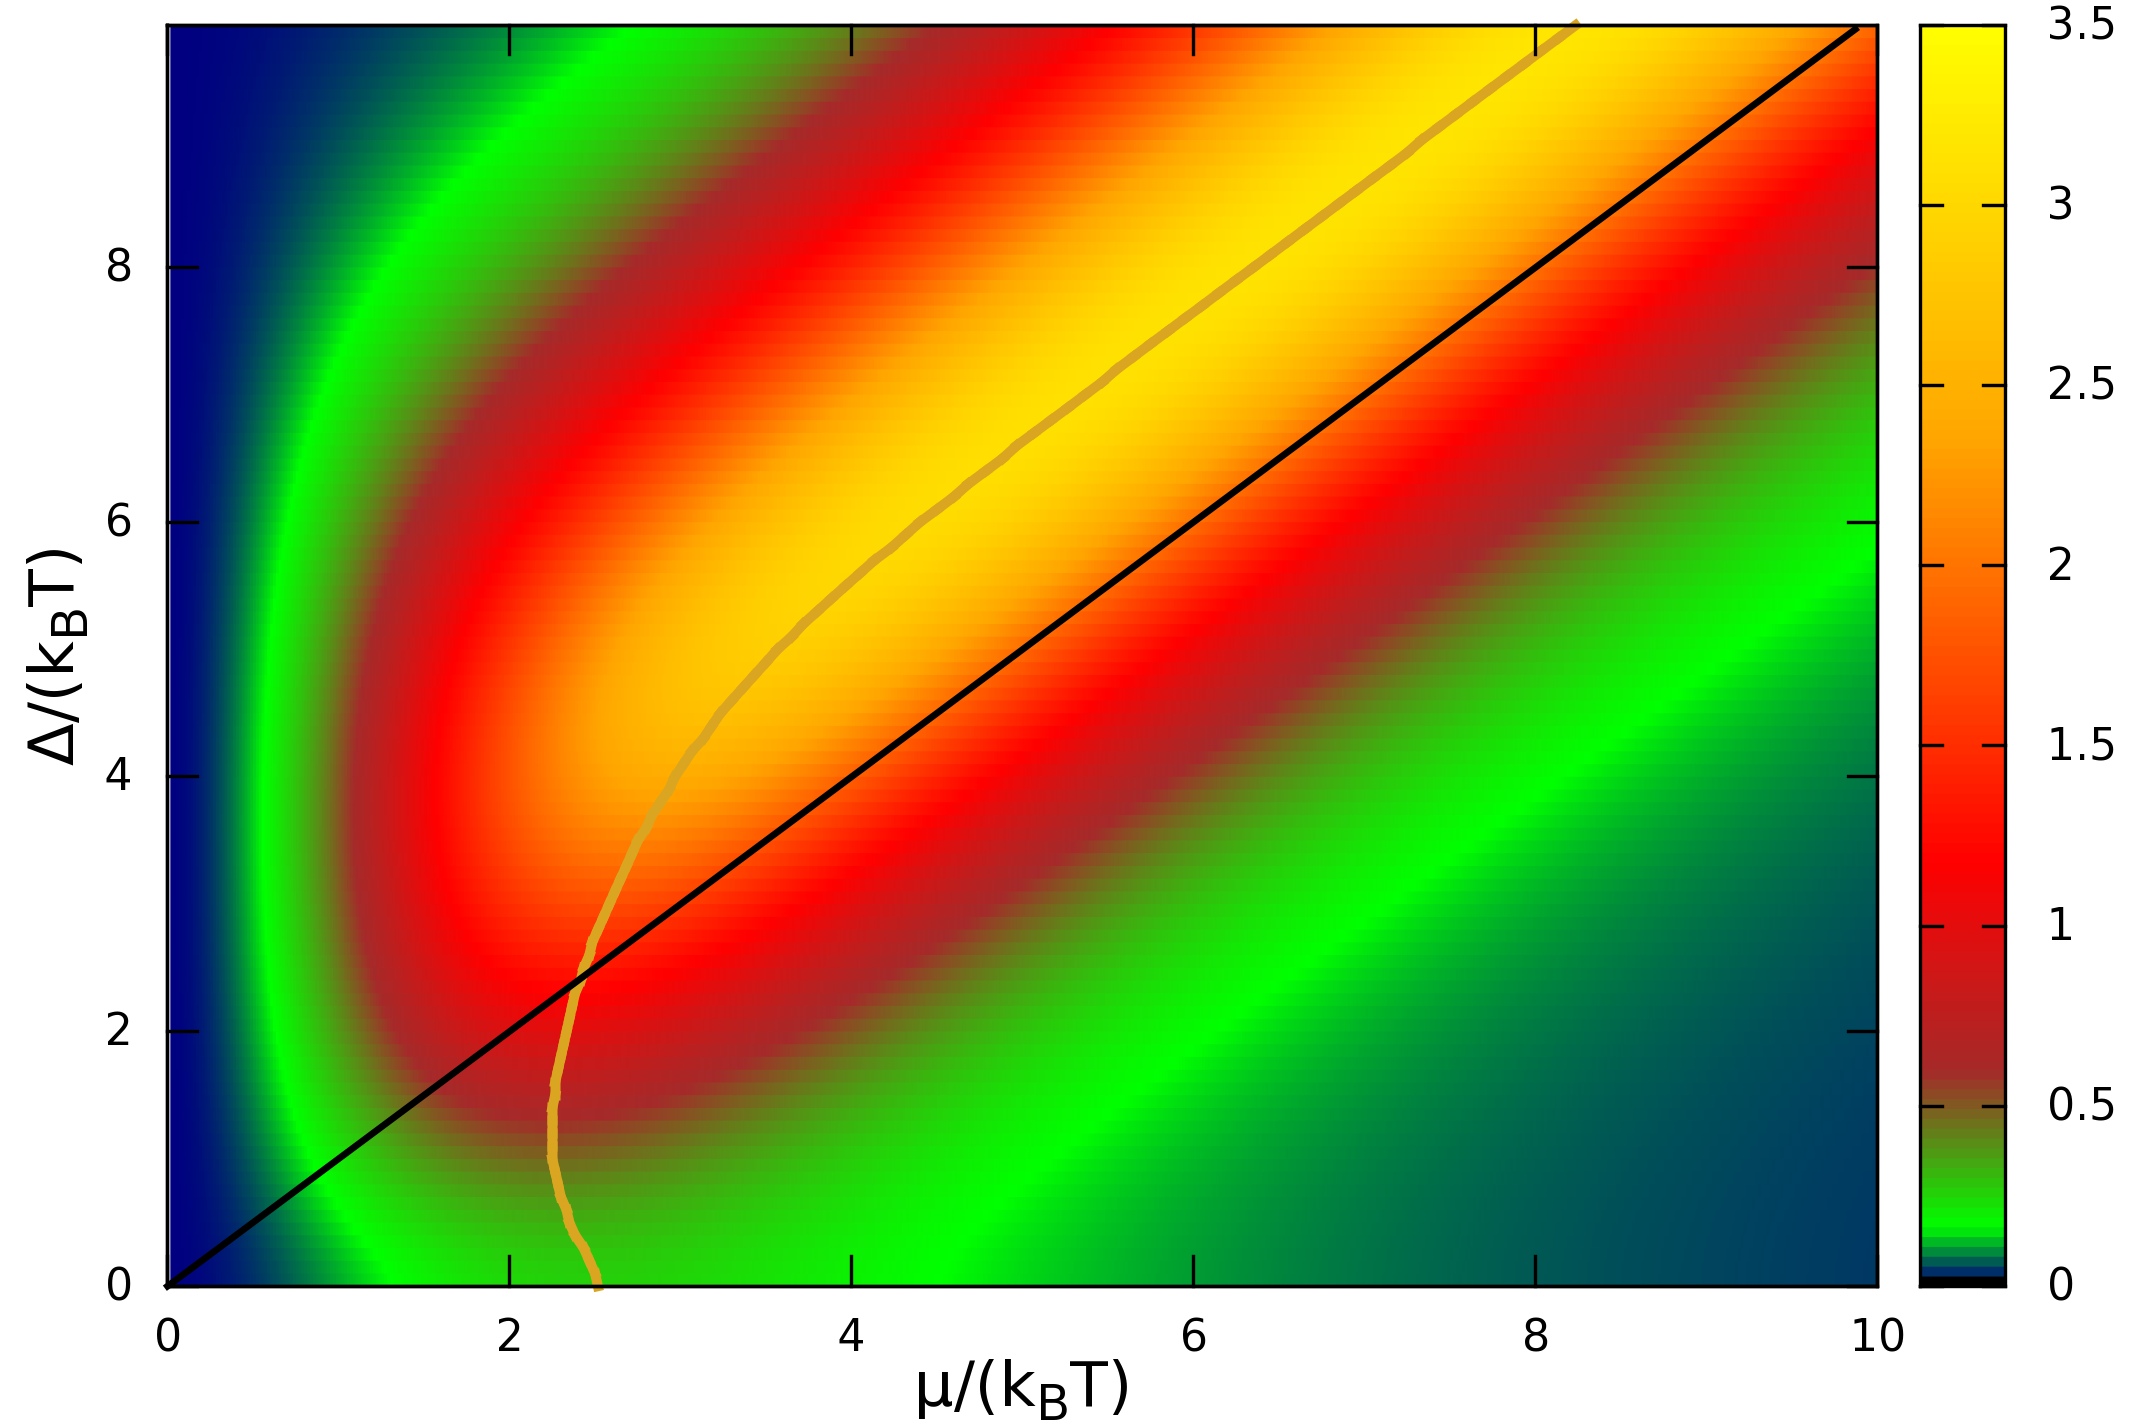
The phononic contribution to the thermal conductivity for the holey sample can be characterized by the dimensionless parameter . Here the phonon thermal conductivity can be estimated to be (as for Bi2Te3) and the average distance between the holes reaching nm. Taking the relaxation time s, at room temperatures we estimate for these rather conservative values of parameters. In Fig. 4 we show as a function of the induced subgap and chemical potential for the phononic bulk contribution characterized by the dimensionless parameter . Although reduced considerably from its pure 2D value, remains substantially larger than any value so far achieved in these materials and can be tuned significantly by changing the chemical potential, e. g., by gating the system.
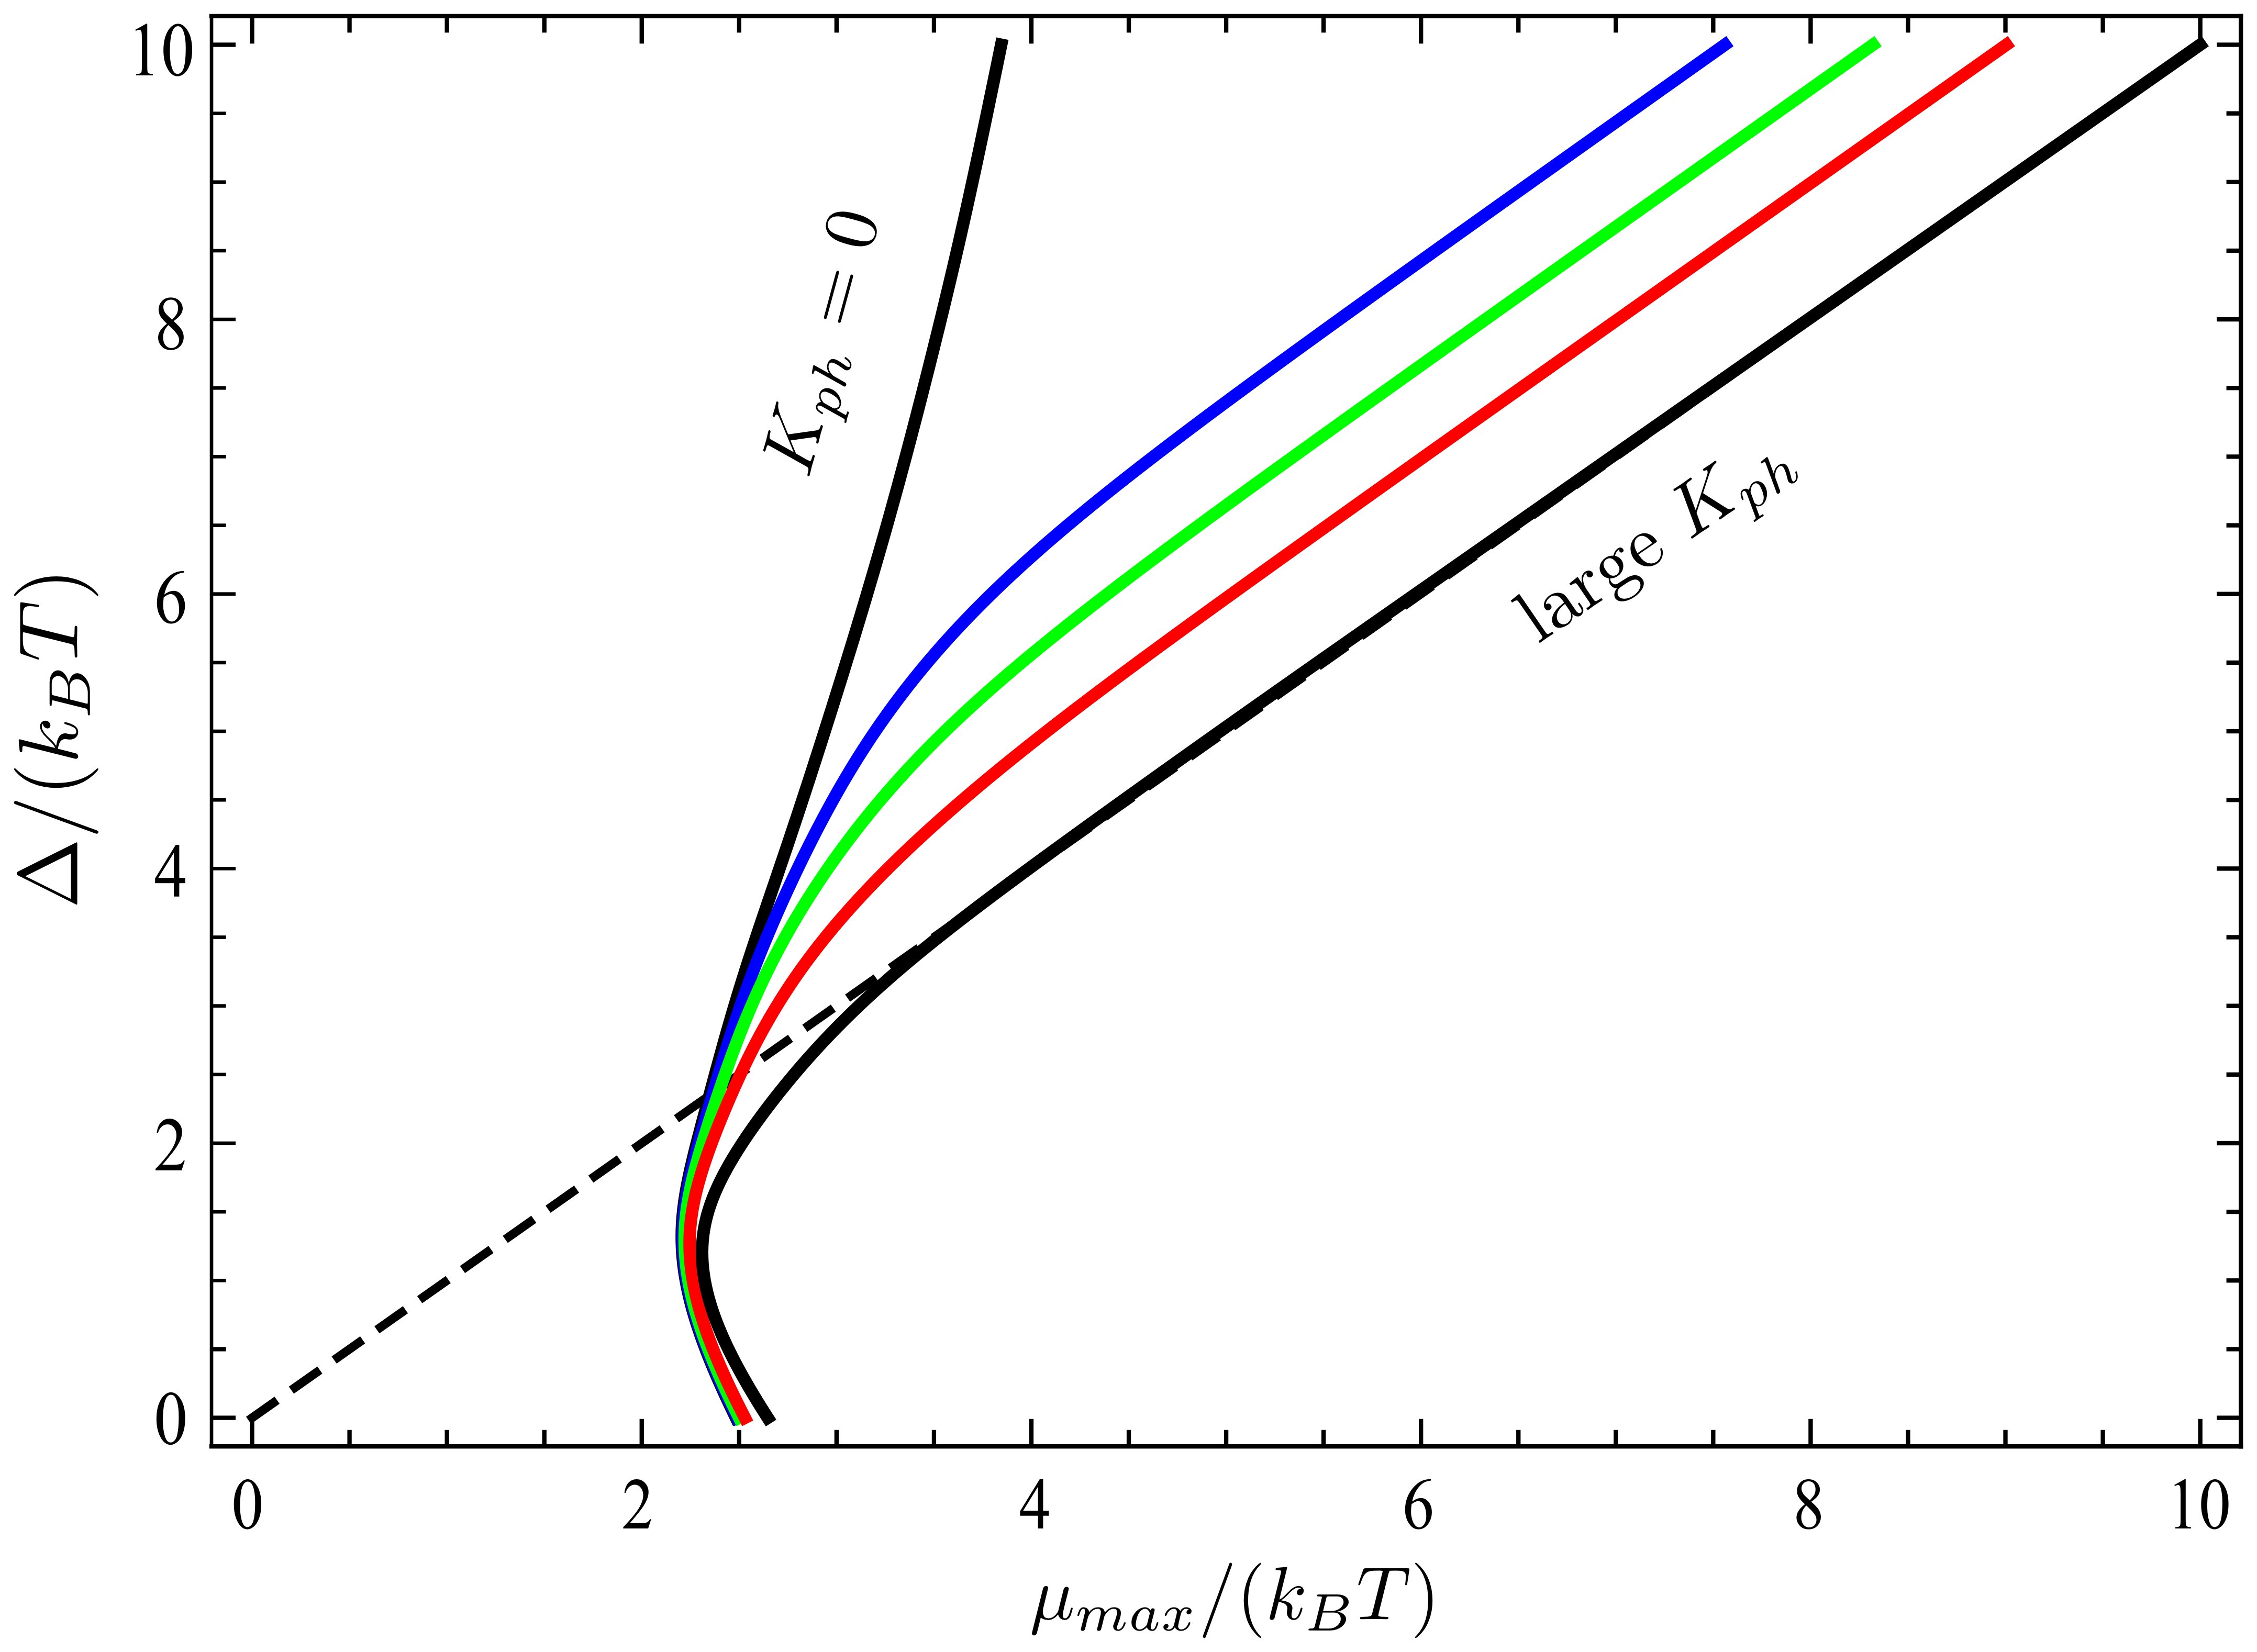
We also investigate the relation between the induced subgap and the chemical potential to obtain the maximum value of for different phononic bulk contributions. This result is shown in Fig. 5. For small phonon thermal conductivity (small ) the is maximal when the chemical potential is placed within the subgap, . In the limit of large the maximum is reached when the chemical potential and the gap match. This can be seen in Fig. 5, where the line corresponding to almost coincides with the dashed line for rather large .
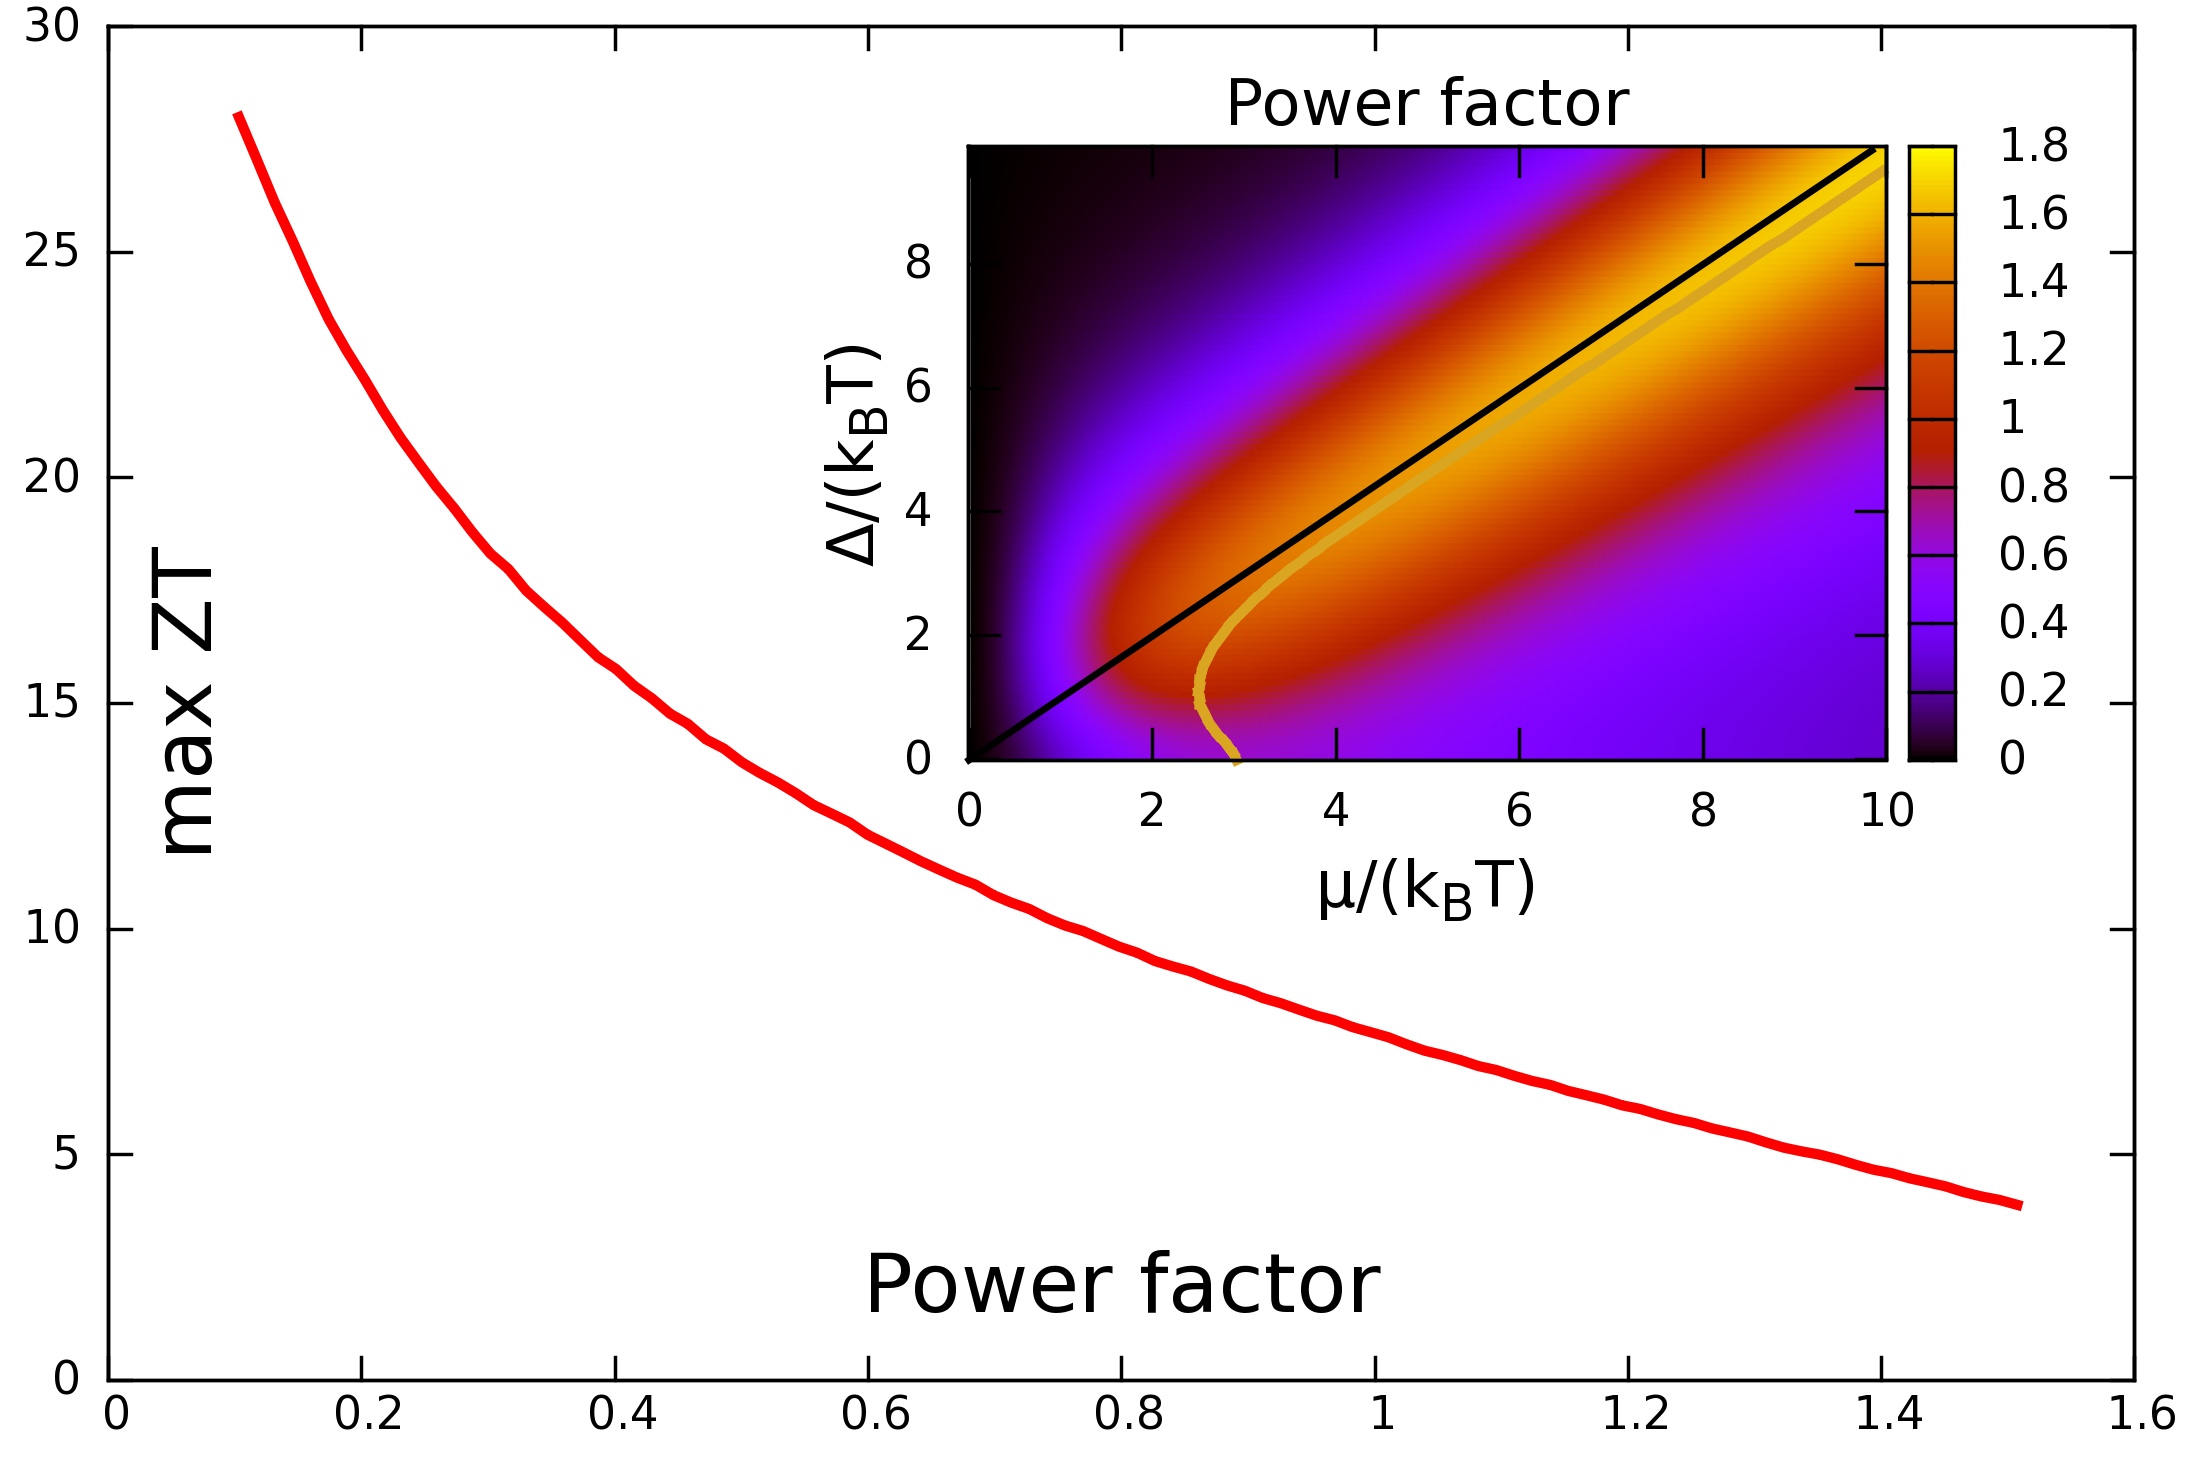
Finally, we point out that the large values of obtained in the absence of phonon thermal conductivity shown in Fig. 3 is not the entire story. As at large and these thermoelectrics are indeed very efficient but not effective – the power factor , describing how much power one can produce, is small in this limit. This is shown in Fig. 6 as a plot of the maximal as a function of the power factor. The dimensionless power output as a function of the induced subgap and chemical potential is shown in the inset of Fig. 6.
Within these materials, there are extensive competing mechanisms that contribute to the thermal transport and thermoelectric efficiency. In order to distinguish that a particular increase of is associated with the topological protected states, we propose a simple measurement of the transport coefficients with and without a magnetic field applied, parallel to the transport direction, to increase the induced gap of the surface states in the energy spectrum. The effect of the magnetic field will be more pronounced when the temperature is smaller than the induced gap. For fields of Tesla a gap of the order of several meV is expected in materials such as Bi2Se3 Zyuzin and Burkov (2011); Analytis et al. (2010).
It is important to note that our consideration is not limited to periodic holey structures. It is also applicable to porous materials with random size and location of the holes (pores) as shown in Fig. 2(a). In this case some of the surface states can be situated too close to each other so that the back-scattering in them will be increased, meanwhile the phonon part of thermal conductivity will be reduced due to stronger trapping of phonons in chaotic structures. Therefore, in porous materials can be comparable to those with the periodically placed holes.
Methods
To estimate the surface contribution of TI to the transport coefficients we assume the bands to be Dirac-like with a subgap and use Boltzmann equation in the relaxation time approximation,
| (3) |
Here the sum is over the upper and lower bands, , and with being the Fermi distribution function. Then taking relaxation time to be independent of energy, we find
| (4) |
where is Planck constant, , and .
To estimate the bulk contribution to we assume the bands to be parabolic and find in the relaxation time approximation for the conduction band,
| (5) |
where is the density of states. When the chemical potential is far below the bottom of the conduction band, , the contribution from the bulk to the transport coefficients is exponentially suppressed, , and can be safely neglected foo . The same applies for the valence band contribution when the chemical potential is far away from the band edge.
Acknowledgments
We thank M. Bakker, J. Heremans, C. Jaworski, J. E. Moore, O. Mryasov, and D. Pesin for insightful discussions. This work was supported by NSF under Grant No. DMR-0547875, Grant No. 0757992, NSF-MRSEC DMR-0820414, ONR-N000141110780, SWAN, and by the Welch Foundation (A-1678).
References
- Snyder and Toberer (2008) G. J. Snyder and E. S. Toberer, Nat. Mater., 7, 105 (2008).
- Tritt (1999) T. M. Tritt, Science, 283, 804 (1999).
- Hicks and Dresselhaus (1993) L. D. Hicks and M. S. Dresselhaus, Phys. Rev. B, 47, 12727 (1993).
- Mukerjee and Moore (2007) S. Mukerjee and J. E. Moore, Appl. Phys. Lett., 90, 112107 (2007).
- Markussen et al. (2009) T. Markussen, A.-P. Jauho, and M. Brandbyge, Phys. Rev. Lett., 103, 055502 (2009).
- Takahashi and Murakami (2010) R. Takahashi and S. Murakami, Phys. Rev. B, 81, 161302 (2010).
- Ghaemi et al. (2010) P. Ghaemi, R. S. K. Mong, and J. E. Moore, Phys. Rev. Lett., 105, 166603 (2010).
- Tretiakov et al. (2010) O. A. Tretiakov, A. Abanov, S. Murakami, and J. Sinova, Appl. Phys. Lett., 97, 073108 (2010).
- Lyeo et al. (2004) H.-K. Lyeo, A. A. Khajetoorians, L. Shi, K. P. Pipe, R. J. Ram, A. Shakouri, and C. K. Shih, Science, 303, 816 (2004).
- Venkatasubramanian et al. (2001) R. Venkatasubramanian, E. Siivola, T. Colpitts, and B. O’Quinn, Nature, 413, 597 (2001).
- Zhang et al. (2010) Y. Zhang, C. L. Hapenciuc, E. E. Castillo, T. Borca-Tasciuc, R. J. Mehta, C. Karthik, and G. Ramanath, Appl. Phys. Lett., 96, 062107 (2010).
- Teweldebrhan et al. (2010) D. Teweldebrhan, V. Goyal, M. Rahman, and A. A. Balandin, Appl. Phys. Lett., 96, 053107 (2010a).
- Teweldebrhan et al. (2010) D. Teweldebrhan, V. Goyal, and A. A. Balandin, Nano Lett., 10, 1209 (2010b).
- Dubi and Di Ventra (2011) Y. Dubi and M. Di Ventra, Rev. Mod. Phys., 83, 131 (2011).
- Qi and Zhang (2010) X.-L. Qi and S.-C. Zhang, Physics Today, 63, 33 (2010).
- Fu et al. (2007) L. Fu, C. L. Kane, and E. J. Mele, Phys. Rev. Lett., 98, 106803 (2007).
- Hsieh et al. (2008) D. Hsieh, D. Qian, L. Wray, Y. Xia, Y. S. Hor, R. J. Cava, and M. Z. Hasan, Nature, 452, 970 (2008).
- Chen et al. (2009) Y. L. Chen, J. G. Analytis, J.-H. Chu, Z. K. Liu, S.-K. Mo, X. L. Qi, H. J. Zhang, D. H. Lu, X. Dai, Z. Fang, S. C. Zhang, I. R. Fisher, Z. Hussain, and Z.-X. Shen, Science, 325, 178 (2009).
- Poudel et al. (2008) B. Poudel, Q. Hao, Y. Ma, Y. Lan, A. Minnich, B. Yu, X. Yan, D. Wang, A. Muto, D. Vashaee, X. Chen, J. Liu, M. S. Dresselhaus, G. Chen, and Z. Ren, Science, 320, 634 (2008).
- Tang et al. (2010) J. Tang, H.-T. Wang, D. H. Lee, M. Fardy, Z. Huo, T. P. Russell, and P. Yang, Nano Lett., 10, 4279 (2010).
- Park et al. (2010) K. Park, J. J. Heremans, V. W. Scarola, and D. Minic, Phys. Rev. Lett., 105, 186801 (2010).
- (22) We consider to be energy independent in a wide range of energies.
- Linder et al. (2009) J. Linder, T. Yokoyama, and A. Sudbø, Phys. Rev. B, 80, 205401 (2009).
- Lu et al. (2010) H.-Z. Lu, W.-Y. Shan, W. Yao, Q. Niu, and S.-Q. Shen, Phys. Rev. B, 81, 115407 (2010).
- Ashcroft and Mermin (1976) N. W. Ashcroft and N. D. Mermin, Solid State Physics (Sauders College Publishing, Fort Worth, 1976).
- Marder (1976) M. P. Marder, Condensed Matter Physics (John Wiley & Sons, Inc., New York, 1976).
- Zyuzin and Burkov (2011) A. A. Zyuzin and A. A. Burkov, Phys. Rev. B, 83, 195413 (2011).
- Analytis et al. (2010) J. G. Analytis, R. D. McDonald, S. C. Riggs, J. Chu, G. S. Boebinger, and I. R. Fisher, Nat. Phys., 6, 960 (2010).
- (29) We note that taking into account the fact that the extended and localized states in the bulk are separated by the mobility edge which is measured from the bottom of the band changes to in these estimates and only makes the inequalities to be even stronger.