Soft time lags in the X-ray emission of Mrk 1040
Abstract
Temporal analysis of X-ray binaries and Active Galactic Nuclei have shown that hard X-rays react to variation of soft ones after a time delay. The opposite trend, or soft lag, has only been seen in a few rare Quasi-periodic Oscillations in X-ray binaries and recently for the AGN, 1H 0707-495, on short timescales of secs. Here, we report analysis of a XMM-Newton observation of Mrk 1040, which reveals that on the dominant variability timescale of secs, the source seems to exhibit soft lags. If the lags are frequency independent, they could be due to reverberation effects of a relativistically blurred reflection component responding to a varying continuum. Alternatively, they could be due to Comptonization delays in the case when high energy photons impinge back on the soft photon source. Both models can be verified and their parameters tightly constrained, because they will need to predict the photon spectrum, the r.m.s variability and time lag as a function of energy. A successful application of either model will provide unprecedented information on the radiative process, geometry and more importantly the size of the system, which in turn may provide stringent test of strong general relativistic effects.
Subject headings:
X-rays:galaxies - Galaxies:Seyfert - Galaxies:individual:Mrk 10401. Introduction
Active Galactic Nuclei (AGN) are known to show large amplitude variability in X-rays. The variability broadly correlates with the black hole mass (e.g. O’Neill et al., 2005), but perhaps a more unifying result is that the break in the power spectrum depends on the black hole mass and luminosity in a similar way for both AGN and Galactic black hole systems, providing a fundamental plane of these measured quantities (McHardy et al., 2006).
Study of the variability as a function of energy, especially time lags between different energy bands, has provided insight into the nature of the variability, the radiative processes and geometry of these black hole systems. For Galactic black hole systems (e.g. Cyg X-1) the lags are found to be proportional to the logarithm of the energy bin and more importantly they depend on the frequency of the variability (Nowak et al., 1999). Similarly, all AGN with well measured time lag spectra show that the variations in the hard band lag behind those in the soft band and the size of the hard lag decreases with Fourier frequency (Papadakis et al., 2001; Vaughan et al., 2003; McHardy et al., 2004; Arévalo et al., 2006; Markowitz et al., 2007; Arévalo et al., 2008). The energy dependent time lags in Mrk 110 were found to be proportional to the logarithm of the energy (Dasgupta & Rao, 2006). These observations demonstrate the similarity of the nature of X-ray variability in the two different mass scales - X-ray binaries and AGN. The frequency dependence of the time lags cannot be reconciled with a model where they are produced by multiple Compton scattering. Instead, cylindrical inward propagation of fluctuations in the disk (Lyubarskii, 1997), can more naturally explain the dependence. The model requires non-localized origin of the hard and soft photons which may be achieved either by a transition disk region (Misra, 2000) or spectral hardening in the inner regions (Kotov et al., 2001; Arévalo et al., 2006).
These time lags reported are hard i.e. the hard X-rays react after a delay to soft ones. For Galactic X-ray binaries (including Neutron stars), the opposite trend of a soft lag has only been reported for kHz Quasi-periodic Oscillations (Vaughan et al., 1998; Kaaret et al., 1999) and for alternate harmonics of a low frequency QPO in the black hole system GRS 1915+105 (Cui, 1999) and seemingly never for the broad band continuum variability. Recently, Fabian et al. (2009) report a soft lag in the AGN 1H 0707-495, between - and - keV bands on short timescales of secs. However, the dominant variability on longer timescales exhibits typical hard lags. Interestingly, the source spectrum can be modeled with a complex reflection component (with both Iron K and Iron L emission lines) and the soft lag could be due to reverberation effects between the continuum and Iron L line (Fabian et al., 2009). In general, the temporal analysis so far undertaken for AGN and Galactic black holes, reveal that for the dominant variability, the hard photons lag the soft.
ASCA observation of Mrk 1040 reveals a rather typical variable AGN (O’Neill et al., 2005; Turner et al., 1999) with its spectrum showing Iron line emission and perhaps warm absorber signatures (Reynolds et al., 1995). Here we report analysis of a XMM-Newton observation and the surprising result is that in the dominant variability timescale of secs, the source seems to exhibit soft lags.
2. Observation, Analysis & Results
XMM-Newton observed Mrk 1040 on 13 February, 2009 for the duration of 90.9 ksec (observation ID 0554990101). We processed and filtered the EPIC-pn data in a standard way using the Science Analysis Software (SAS) version 10.0 and using the recent calibration files. We examined the full field lightcurve above for flaring particle background which were identified and excluded. We used a continuous exposure of for temporal analysis. For spectral analysis we used the same length ofdata as taken in temporal study. We extracted source and background spectra from a source-centered circular region of radius and an off-source region, respectively, and using single and double events with FLAG=0. We also extracted lightcurves using the above criteria and additionally using quadruple events. Response matrices and auxiliary files were generated using the RMFGEN and ARFGEN tools. The EPIC-pn spectrum was grouped using the SAS task specgroup.
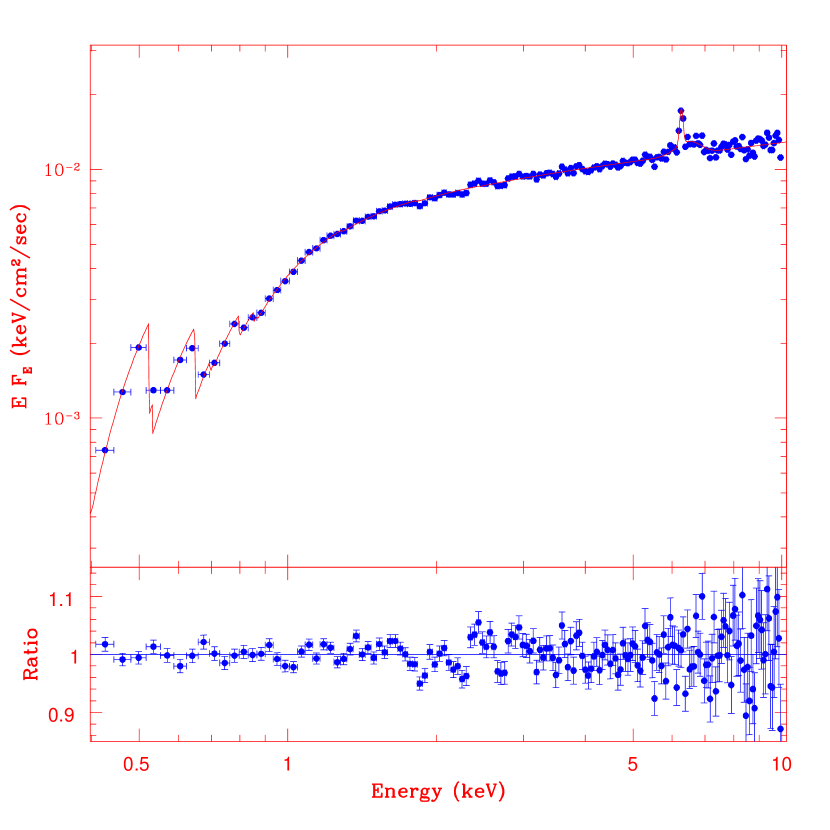
As is the case for many AGN, the time-averaged X-ray spectrum of Mrk 1040 as observed by XMM-Newton is complex. There is intrinsic neutral absorption, a soft excess feature, multiple Iron line emissions, plus edges and absorption features, probably due to a warm absorber. The complex Iron line features indicate the possibility of a complex blurred reflection component. Moreover, as shown below, the source exhibited significant secular spectral evolution during the observation and hence steady state models may not be appropriate to describe the time-averaged spectrum. Our motivation here is not to fit the spectrum in detail, but to get a first order approximation which describes its overall shape.
We model the spectrum using an intrinsically absorbed dual Comptonization model. One Comptonization component to describe the soft excess and the other for the hard X-ray continuum. To this basic model we include some prominent line emission and edges. The Galactic absorption towards the direction of Mrk 1040 is cm-2 and the data requires an additional intrinsic neutral absorption of cm-2. The soft excess is described by a Comptonized component represented by the XSPEC model “nthcomp” (Zdziarski et al., 1996; Życki et al., 1999) with spectral index and electron temperature keV. A second Comptonization model for the hard X-ray emission, is represented by the XSPEC convolution model “Simpl” (Steiner et al., 2009) acting on the first Comptonization model “nthcomp”. Thus, in this description, the first Comptonization component which gives rise to the soft excess, is the origin of the seed photons for the second Comptonization component giving the hard X-ray continuum. The high energy spectral index is and the fraction of soft excess photons getting scattered is . The Iron line emission feature is modeled as a narrow Gaussian at keV and a broad one centered at keV with a width of keV. Two prominent edges at and keV with optical depth and respectively have been included. For a distance of Mpc, the observed and unabsorbed luminosities are and ergs/s respectively. The model is formally unacceptable with a . This is evident in Figure 1 where the unfolded spectrum and the ratio of the data to model is shown. There are systematic variations in the ratio plot at several energies which may be due to the presence of complex emission/ absorption or blurred reflection features and/or spectral variability during the observation. However, as can be seen in Figure 1 the model is a good first order approximation of the data at a few percentage level. The essence of this spectral analysis is that with a high energy spectral index of , moderate intrinsic absorption and soft excess, the spectrum of Mrk 1040 is typical of AGNs of its class.
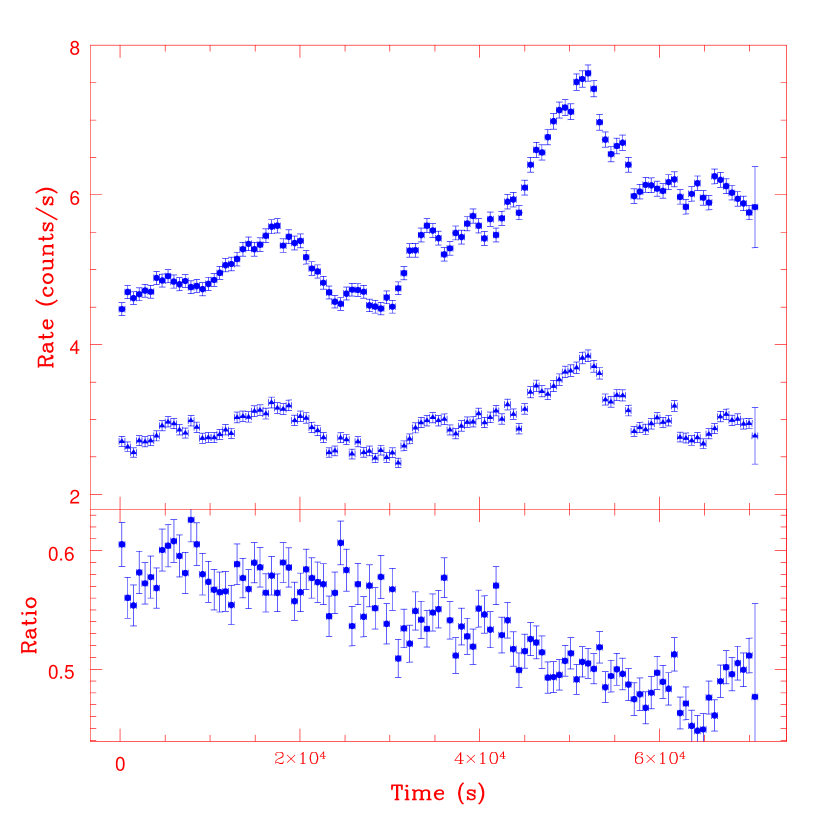
The top panel of Figure 2 shows the background subtracted X-ray sec binned lightcurves of Mrk 1040 in soft, - keV (circles) and hard, - keV (triangles) energy bands. There is clear strong correlated variability in the two bands on sec timescales. The bottom panel shows that the ratio of the hard to soft count rates (i.e. the hardness ratio) significantly decreases from to during the course of the observation, indicating spectral evolution of the source on long ( sec) timescales. It is interesting to note that the variation in the hardness ratio is clearly uncorrelated with the variability of the lightcurves. This means that the primary variability of the source in sec timescales is not associated with significant spectral variation and hence its origin cannot be due to changes in the absorption medium which would effect primarily the soft band.
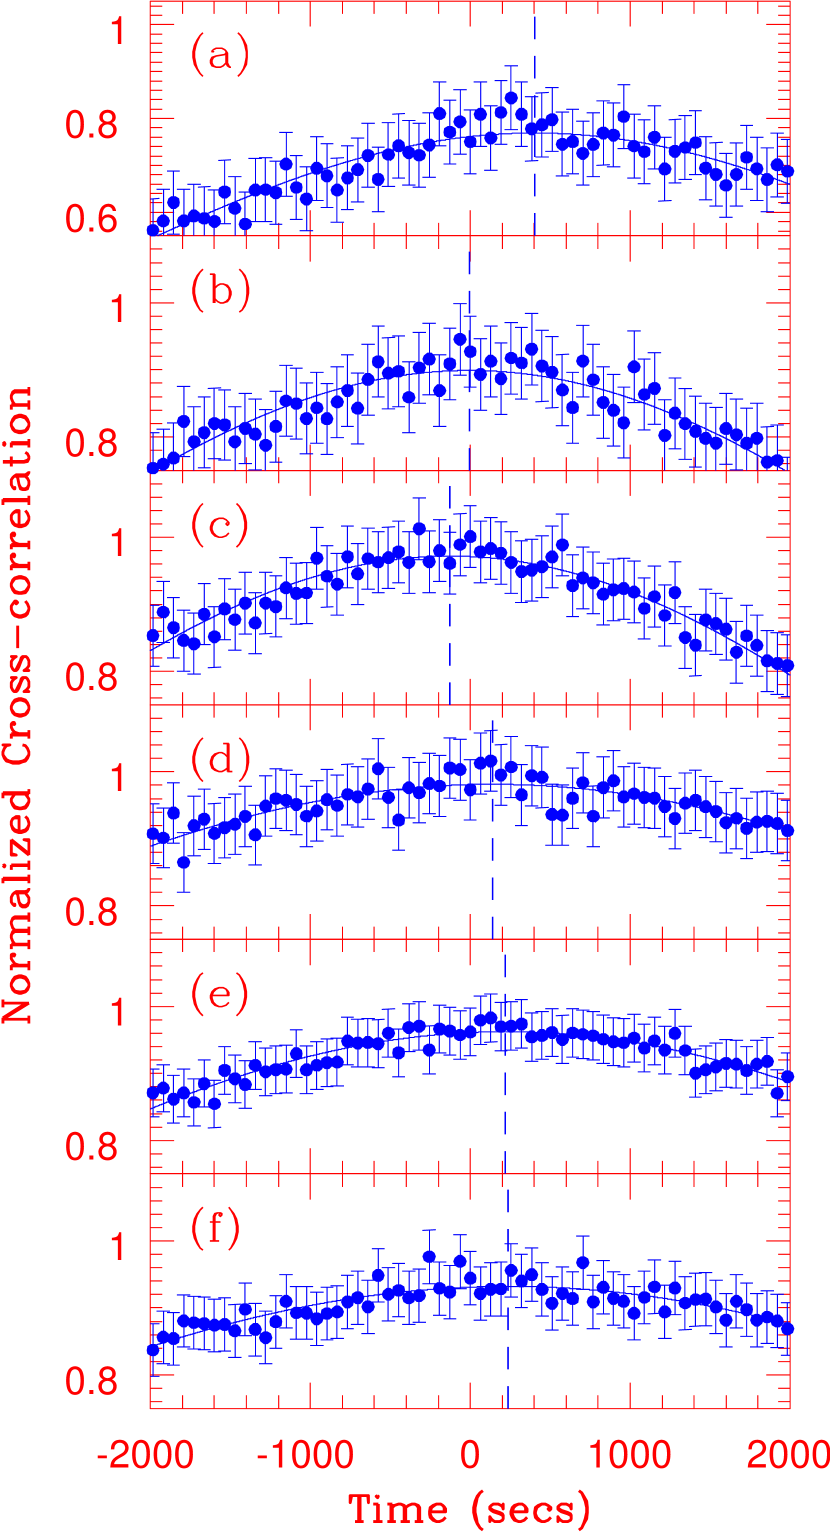
Lightcurves binned at secs were generated for seven energy bands corresponding to -, -, -, -, -, - and - keV. Cross-correlation analysis was undertaken between the reference band - keV and others. The XRONOS task “crosscor” was used for the analysis. The functions were normalized by dividing by the square root of the product of the excess variances of the two series (i.e. with “crosscor” flag “norm = 2”). The entire lightcurve was taken as a single segment and the analysis was undertaken in the “slow” mode (i.e. not in fast Fourier transform mode). In such a case, the task computes errors on the cross-correlation by propagating the measurement errors of each time bin. Dividing the light-curve into five or more segments, gave negative variance for some segments, rendering the analysis unfeasible. The cross-correlations in the delay time range of to secs are plotted in Figure 3. The lightcurves are well correlated with the cross-correlation function peaking at values . In this delay range, we fit the functions with a Gaussian and obtain the best fit centroid. The best fit Gaussians are plotted in the figure (solid lines) and their centroid values are marked with a horizontal dashed line which is taken as the time-delay between the lightcurves.
We estimate the significance of the measured time-delays through simulations. The intrinsic power spectrum of the source is an approximate power-law with index . Based on this power spectral shape and using the method proposed by Timmer & Koenig (1995), we simulate 200 pairs of lightcurves having the same measured time-delay as the observed pair. Measurement errors were added to each lightcurve and the pairs were then subjected to an identical analysis, where the cross-correlation function was fitted by a Gaussian function. The root mean square deviation of the centroids of the best fit Gaussian functions, was then taken to be the 1-sigma error on the time-delay.
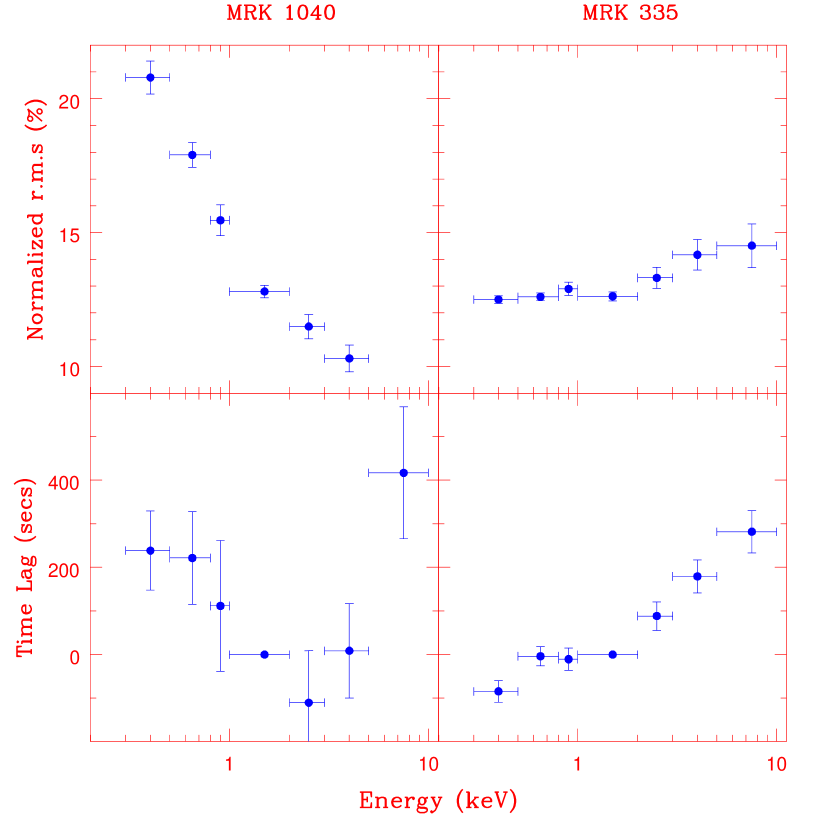
The first column of Figure 4 shows the r.m.s and the time lag for Mrk 1040 are plotted as function of energy bin. Below keV, the time lag decreases with energy which means that the variation in the soft photons occur after the corresponding variation in the hard ones i.e. there is a soft time lag. For energies keV, the time lag increases with energy as in the regular case of hard lags. To validate the analysis technique and to make a direct comparison with other sources, the right column of Figure 4 show the r.m.s and time lag for Mrk 335, computed using an identical analysis of its similar length XMM-Newton observation. Although the r.m.s varies differently with energy, the time lag for Mrk 335 increases with energy (i.e. hard lags). This is consistent with the more detailed analysis, including frequency dependence, of this source (Arévalo et al., 2008).
3. Discussion
Figure 4 shows that the r.m.s decreases with energy for Mrk 1040, while it is nearly constant for Mrk 335. This may indicate that the variability in Mrk 1040 is due to variations in the absorbing medium. Moreover, if the absorbing medium (e.g. warm absorber) reacts to a change in the hard X-ray continuum with a time delay, this could naturally explain the soft lags observed in the source. However, as seen in Figure 2, the hardness ratio variation is on longer timescale and uncorrelated with the intensity variation. Thus, such a model cannot explain the soft lags observed.
Frequency dependent time lags in X-ray binaries and AGN can be explained in terms of fluctuations propagating from the outer regions of the disk to the inner (Lyubarskii, 1997). To reconcile soft lags, either the waves have to propagate outwards or the hard photons have to arise from outer regions, both of which seem rather physically unrealistic.
In the most straight forward interpretation, Comptonization naturally predicts a time lag between energy bands to be , where is the size of the region and is the ratio of the energies. While the energy dependence is consistent with what is observed in black hole binaries and AGN, the Comptonization interpretation is often ruled out because it is difficult to reconcile with the observed frequency dependence of the lags. However, it is important to note that Comptonization lag must exist and should manifest at high enough frequencies when the wave propagation lag is small. Thus at high frequencies the lag should saturate to the Comptonization lag values. While, this saturation has not been detected, the observed time lags already impose a stringent upper limit on the size of the Comptonizing region, for AGNs. For Ark 564, the time lag variation of sec (Arévalo et al., 2006) requires that cm or for at black hole.
It is not known whether the lags in Mrk 1040 are frequency dependent and hence a Comptonization origin may still be viable. Soft lags due to Comptonization is indeed possible, as invoked to explain the soft lags observed for kHz QPO in X-ray binaries (Lee et al., 2001). A fluctuation in the electron temperature will lead to variations in the hard X-rays after a delay. A fraction of these hard X-rays may impinge back on the input photon producing region and hence affect the soft photons. This will lead to a detectable soft lag. Alternatively, the soft lag could be due to reverberation of a complex gravitationally blurred reflection component to variations of the continuum, as proposed for 1H 0707-495 (Fabian et al., 2009). It is interesting to note that if like for 1H 0707-49, the continuum in Mrk 1040 only dominates in the - keV band, the time lag variation with energy observed, may be naturally explained. The temporal and spectral signatures of both these models can be quantified, although, especially for the reflection scenario, the complex and non-intuitive effect of light bending needs to be taken into account. Both models can be tested and their parameters tightly constrained, because they will need to self-consistently explain the lag and r.m.s versus energy as well as the photon spectrum. Successful application of either model will provide rich dividends in terms of constraining the radiative processes, geometry and more importantly the size of the system and provide opportunity to test strong General Relativistic effects. Note however, that for both scenarios, the time lag should not be frequency dependent.
References
- Arévalo et al. (2008) Arévalo, P., McHardy, I. M., & Summons, D. P. 2008, MNRAS, 388, 211
- Arévalo et al. (2006) Arévalo, P., Papadakis, I. E., Uttley, P., McHardy, I. M., & Brinkmann, W. 2006, MNRAS, 372, 401
- Cui (1999) Cui, W. 1999, ApJ, 524, L59
- Dasgupta & Rao (2006) Dasgupta, S., & Rao, A. R. 2006, ApJ, 651, L13
- Fabian et al. (2009) Fabian, A. C., et al. 2009, Nature, 459, 540
- Kaaret et al. (1999) Kaaret, P., Piraino, S., Ford, E. C., & Santangelo, A. 1999, ApJ, 514, L31
- Kotov et al. (2001) Kotov, O., Churazov, E., & Gilfanov, M. 2001, MNRAS, 327, 799
- Lee et al. (2001) Lee, H. C., Misra, R., & Taam, R. E. 2001, ApJ, 549, L229
- Lyubarskii (1997) Lyubarskii, Y. E. 1997, MNRAS, 292, 679
- Markowitz et al. (2007) Markowitz, A., Papadakis, I., Arévalo, P., Turner, T. J., Miller, L., & Reeves, J. N. 2007, ApJ, 656, 116
- McHardy et al. (2006) McHardy, I. M., Koerding, E., Knigge, C., Uttley, P., & Fender, R. P. 2006, Nature, 444, 730
- McHardy et al. (2004) McHardy, I. M., Papadakis, I. E., Uttley, P., Page, M. J., & Mason, K. O. 2004, MNRAS, 348, 783
- Misra (2000) Misra, R. 2000, ApJ, 529, L95
- Nowak et al. (1999) Nowak, M. A., Vaughan, B. A., Wilms, J., Dove, J. B., & Begelman, M. C. 1999, ApJ, 510, 874
- O’Neill et al. (2005) O’Neill, P. M., Nandra, K., Papadakis, I. E., & Turner, T. J. 2005, MNRAS, 358, 1405
- Papadakis et al. (2001) Papadakis, I. E., Nandra, K., & Kazanas, D. 2001, ApJ, 554, L133
- Reynolds et al. (1995) Reynolds, C. S., Fabian, A. C., & Inoue, H. 1995, MNRAS, 276, 1311
- Steiner et al. (2009) Steiner, J. F., Narayan, R., McClintock, J. E., & Ebisawa, K. 2009, PASP, 121, 1279
- Timmer & Koenig (1995) Timmer, J., & Koenig, M. 1995, A&A, 300, 707
- Turner et al. (1999) Turner, T. J., George, I. M., Nandra, K., & Turcan, D. 1999, ApJ, 524, 667
- Vaughan et al. (1998) Vaughan, B. A., et al. 1998, ApJ, 509, L145
- Vaughan et al. (2003) Vaughan, S., Fabian, A. C., & Nandra, K. 2003, MNRAS, 339, 1237
- Zdziarski et al. (1996) Zdziarski, A. A., Johnson, W. N., & Magdziarz, P. 1996, MNRAS, 283, 193
- Życki et al. (1999) Życki, P. T., Done, C., & Smith, D. A. 1999, MNRAS, 309, 561