KEPLER EXOPLANET CANDIDATE HOST STARS ARE PREFERENTIALLY METAL RICH
Abstract
We find that Kepler exoplanet candidate (EC) host stars are preferentially metal-rich, including the low-mass stellar hosts of small-radius ECs. The last observation confirms a tentative hint that there is a correlation between the metallicity of low-mass stars and the presence of low-mass and small-radius exoplanets. In particular, we compare the — color-color distribution of Kepler EC host stars with a control sample of dwarf stars selected from the stars observed during Q1 and Q2 of the Kepler mission but with no detected planets. We find that at characteristic of solar-type stars, the average color of stars that host giant ECs is 4- redder than the average color of the stars in the control sample. At the same time, the average color of solar-type stars that host small-radius ECs is indistinguishable from the average color of the stars in the control sample. In addition, we find that at indicative of late K dwarfs, the average color of stars that host small-radius ECs is 4- redder than the average color of the stars in the control sample. These offsets are unlikely to be caused by differential reddening, age differences between the two populations, or the presence of giant stars in the control sample. Stellar models suggest that the first color offset is due to a 0.2 dex enhancement in [Fe/H] of the giant EC host population at , while Sloan photometry of M 67 and NGC 6791 suggests that the second color offset is due to a similar [Fe/H] enhancement of the small-radius EC host population at . These correlations are a natural consequence of the core-accretion model of planet formation.
Subject headings:
planets and satellites: detection — planets and satellites: formation — protoplanetary disks — stars: abundances1. Introduction
The groundbreaking early results of NASA’s Kepler mission (Borucki et al., 2010a; Koch et al., 2010a; Jenkins et al., 2010a; Caldwell et al., 2010; Bryson et al., 2010; Batalha et al., 2010a, b; Haas et al., 2010; Jenkins et al., 2010b) have spectacularly added to our understanding of the frequency and properties of planets in the Galaxy (Borucki et al., 2011a, b; Ford et al., 2011; Lissauer et al., 2011b; Moorhead et al., 2011; Howard et al., 2011; Latham et al., 2011). Eight planetary systems discovered by Kepler have already been confirmed by radial velocity or transit timing: four hot Jupiters (Koch et al., 2010b; Dunham et al., 2010; Latham et al., 2010; Jenkins et al., 2010c); two Saturn-mass planets and a super-Earth in the Kepler-9 system (Holman et al., 2010); a Neptune-mass planet Kepler-4b (Borucki et al., 2010b); Kepler-10b, the smallest exoplanet yet known (Batalha et al., 2011); and the closely-aligned six transiting planet system Kepler-11 (Lissauer et al., 2011a).
The properties of the exoplanet candidate (EC) population discovered by Kepler will provide strong constraints on models of planet formation, especially for low-mass stars and small planets. It is well established that metal-rich solar-type stars are more likely to host giant planets than more metal-poor solar-type stars (e.g., Santos et al., 2004; Fischer & Valenti, 2005). Likewise, metal-rich low-mass stars also seem more likely to host giant planets (e.g., Johnson & Apps, 2009). Meanwhile, preliminary results indicate that near solar metallicity there is not much of a correlation between solar-type host star metallicity and the likelihood of hosting Neptune-mass planets (e.g., Udry et al., 2006; Sousa et al., 2008; Bouchy et al., 2009). There are also trends in host stellar mass, as higher mass stars are more likely to host giant planets than lower mass stars (e.g., Johnson et al., 2007, 2010; Borucki et al., 2011b).
In Schlaufman & Laughlin (2010), we tentatively noted a hint that M dwarfs that host low-mass planets are more likely to be metal rich than expected based on random sampling from the field M dwarf population. We explained this correlation in the context of the core-accretion model of planet formation (e.g., Pollack et al., 1996; Ida & Lin, 2004; Laughlin et al., 2004; Ida & Lin, 2005; Hubickyj et al., 2005; Mordasini et al., 2009a, b). In particular, we argued that a more metal-rich protoplanetary disk will almost certainly have a higher surface density of solids. That increased solid surface density may enable the rapid formation of the several Earth-mass embryo necessary to form the core of an ice giant and accrete gas from the protoplanetary disk before the gaseous disk is dissipated. That correlation might also indicate a lower limit on the amount of solid material necessary to form planets.
In this paper, we determine whether Kepler EC host stars are more metal rich than stars with no detected planets. To that end, we use a metallicity-sensitive color-color plot to examine the optical and infrared properties of the sample of Kepler EC host stars relative to a control sample of dwarf stars observed by Kepler but that were not observed to host transiting planets. We describe our analysis procedures in Section 2, we discuss the results and implications of our analysis in Section 3, and we summarize our findings in Section 4.
2. Analysis
We are interested in using the available photometric data for stars in the Kepler field to determine if there is an offset in metallicity between the Kepler EC host population and the population of stars observed by Kepler but with no detected planets. In particular, we compare the mean color of Kepler EC hosts with the mean color of stars observed by Kepler but with no detected planets at constant color. Ivezić et al. (2008) explored the potential of SDSS photometry to produce accurate photometric metallicities for metal-poor stars in the halo of the Milky Way. Unfortunately, the accuracy of those methods depends crucially on the availability of precise SDSS -band photometry. Nevertheless, even when -band data is lacking, ,, and photometry can still provide very useful photometric metallicities (e.g., An et al., 2009b).
Our problem is made easier because we are only interested in the relative (not absolute) metallicities of the two populations. At the same time, unlike Ivezić et al. (2008) and An et al. (2009b), we have the added benefit of 2MASS photometry in the Kepler field and apparent magnitude range. As a result, we can use infrared colors (e.g., ) as a proxy for effective temperature . The Kepler Input Catalog (KIC - Batalha et al., 2010b; Brown et al., 2011) provides reasonably accurate estimates of , so we can ensure that giant stars do not contaminate our control sample of stars with no detected planets. Stars with have main sequence lifetimes much longer than 10 Gyr, and because age has little effect on the colors of low-mass stars on the main sequence, age differences between the two populations (if they exist) are unlikely to affect our analysis. Since we compare dwarf stars with similar and , the only stellar parameter that can vary between the Kepler EC hosts and the control sample is [Fe/H]. As metallicity is the only stellar parameter that can vary, the best explanation for systematically red colors in the EC host population relative to the control sample is that the EC host population is enriched in metals.
2.1. Color Offsets
For each of the 997 stellar hosts of the 1,235 Kepler exoplanet candidates announced in Borucki et al. (2011b), we obtain all available broadband photometry (including 2MASS from Skrutskie et al., 2006) and reddening data from the KIC. Simultaneously, we obtain equivalent photometry and reddening data from the same sources for a random sample of 10,000 dwarf stars from the stars observed during Q1 and Q2 of the Kepler mission with no candidate planets and KIC-based . This control sample is subject to the same selection effects that were applied in the Kepler field to produce a list of stars to search for transiting planets. Consequently, differences in the characteristics of the stars in the control sample and the stars that host ECs are not related to the selection effects applied in the Kepler field to identify a sample of stars suitable for transit observations.
Metal-rich stars typically have redder optical colors than solar metallicity stars, as the forest of iron lines in the atmospheres of metal-rich stars preferentially absorb blue photons. At the same time, there are other factors that affect the color of a star, most notably reddening due to the interstellar medium, its age, and its evolutionary state (e.g., dwarf or giant).
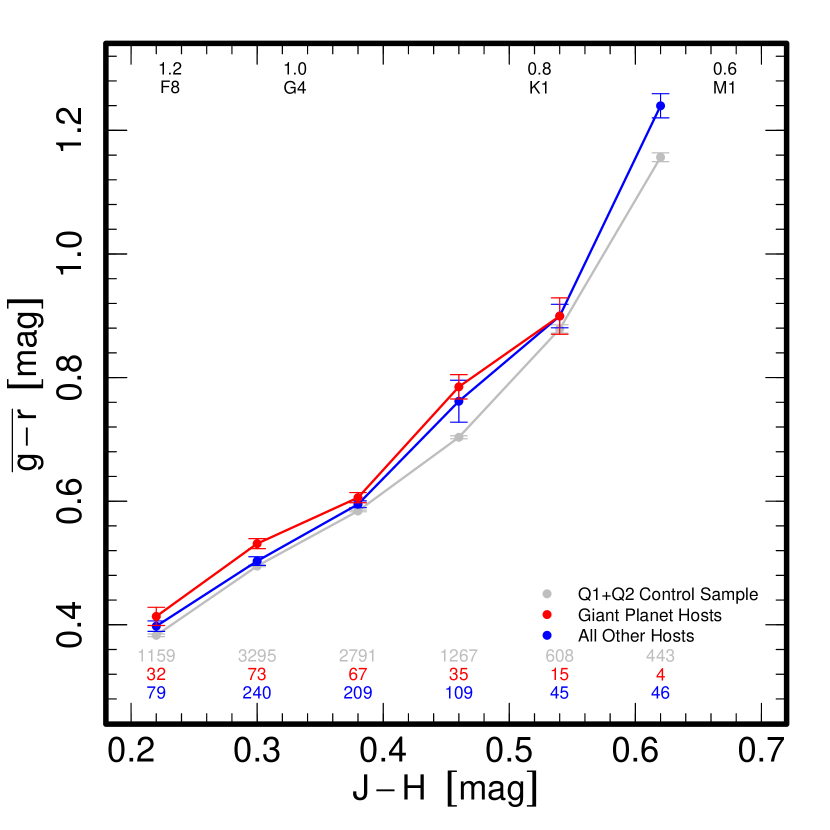
In Figure 1, we plot a — color-color plot for the control sample and the EC host sample. We subdivide the EC host sample into two sub-samples: those stars that host at least one giant EC (e.g., ) and those stars that host no giant ECs. We use Padova isochrones (Marigo et al., 2008; Girardi et al., 2010) for a 2 Gyr stellar population at [Fe/H] = -0.1 and 0.1 to determine the effect of metallicity on the stellar locus in a — color-color plot. The yellow arrows show the effect of increasing [Fe/H] by 0.2 dex on at constant . Note though that the yellow arrows do not connect stars of constant mass, as a 0.2 dex [Fe/H] enriched star will be about 5% more massive than a solar metallicity star at constant color. We do not use the Padova isochrone redward of , as the theoretical stellar models and atmospheres become unreliable after that point (e.g., An et al., 2009a). Consequently, we use the M 67 fiducial sequence from An et al. (2008) to illustrate the morphology of a solar metallicity population at red color. Age can also affect the color of main sequence star, though near age has little effect on the main sequence. Giant stars have slightly bluer colors than dwarf stars at constant , so the presence of giant stars in the control sample could in principle produce a color offset between the Kepler EC host population and the control sample. Fortunately, KIC-based estimates are accurate enough to ensure that giant stars are at most a few percent of our control sample (Basri et al., 2011; Brown et al., 2011).
Two trends are immediately apparent in Figure 1. First, at typical of late K dwarfs, giant ECs become very rare relative to smaller ECs. We interpret this as evidence in support of the correlation between host stellar mass and likelihood of hosting a giant planet (e.g., Johnson et al., 2007, 2010; Borucki et al., 2011b). Second, at dominated by late K dwarfs, ECs are preferentially found around the reddest part of the stellar locus as defined by the control sample. We quantify the significance of this latter trend in Figure 2.
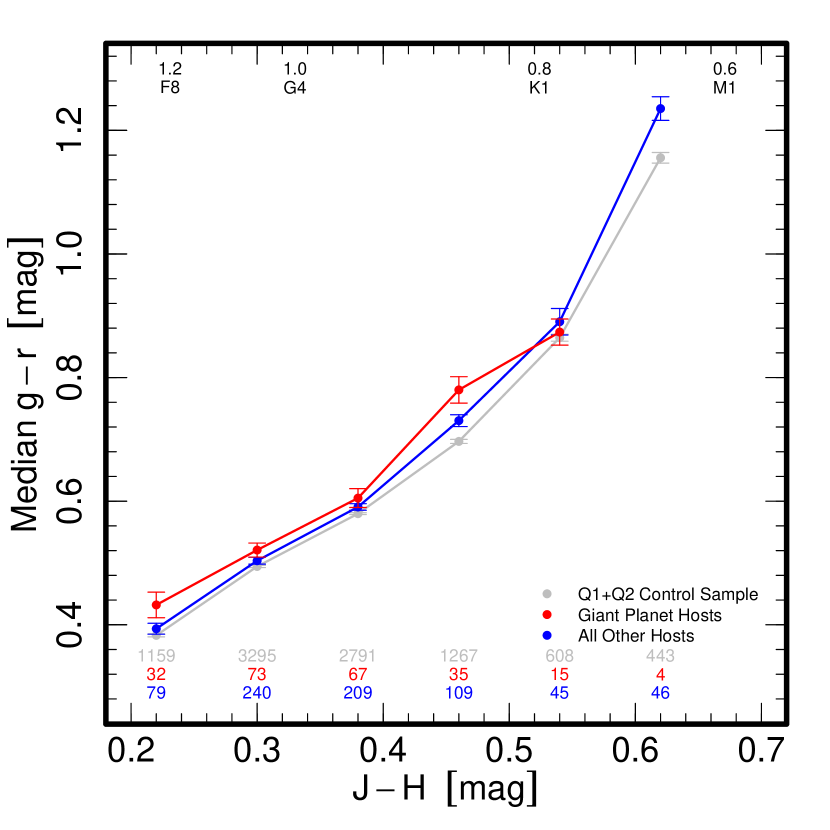
To determine the significance of the observation that low-mass stars that host ECs are on average redder in than the stellar locus as defined by the control sample, we bin both the control sample and each sub-sample of EC hosts into 0.16 mag bins in color and compute the mean and median color in that bin. We estimate the error in each mean and median by bootstrap resampling. We find that at characteristic of solar-type stars, giant EC hosts have preferentially red colors at the 4- level relative to the control sample. On the other hand, at that same color, the hosts of small ECs are indistinguishable from the control sample. In addition, at the stars that host small ECs are 4- redder in than the control sample. We summarize the results of our calculations in Table 1.
2.2. Possible Reasons for Color Offsets
We argue that the significant color offsets apparent in Figure 2 and Table 1 are the result of the enriched metallicity of the EC host sample. Indeed, it reassuring that we identify the hosts of giant ECs as significantly red in at constant , as it is well established that the stellar hosts of giant planets are preferentially metal rich (e.g., Santos et al., 2004; Fischer & Valenti, 2005). Other possible explanations for the observed offset are selection effects, differential reddening, systematic age differences between EC hosts and the control sample, and the presence of giant stars in the control sample but not the EC host sample.
2.2.1 Selection Effects
The depth of a transit is proportional to , so it is easier to identify the signal of transiting planet around a small star. On the main sequence, both age and metallicity can affect the radius of a star. According to the Padova isochrones for a 2 Gyr population (Marigo et al., 2008; Girardi et al., 2010), at a star with [Fe/H] = 0.1 is about 5% larger than a star with [Fe/H] and the same color. At , a star with [Fe/H] = 0.1 is about 7% larger than a star with [Fe/H] and the same color. According to the Padova isochrones, at a 5 Gyr old star is about 6% larger than a 2 Gyr old star at the same color. At , a 10 Gyr old star is about 2% larger than a 2 Gyr old star at the same color. Consequently, if there were no correlation between host metallicity and probability of hosting a planet or possible tidal destruction of aged exoplanet systems, transit surveys would be more likely to identify transiting planets around young, metal-poor stars. As we show in Section 2.2.3, age on the main sequence has very little effect on the color of a star at constant , so these effects are not likely to produce the color offsets we observe.
The color offset at constant color that we observe between the Kepler EC host sample and the control sample is only meaningful if the two samples were subject to the same selection effects. As we argued in Section 2.1, both samples were selected according to the same Kepler target selection algorithm. To verify that the two samples are similar, we plot in Figure 3 six color-color plots and two color-magnitude diagrams (similar to Covey et al., 2007). In all cases, the control sample outlines the distribution of both the sample of giant EC hosts and the sample of small-radius EC hosts. The EC hosts that are outliers in each panel may be unequal mass binary star systems or systems with poorly-estimated reddening. The Kepler IDs (KOI Numbers) of a few of our most extreme color outliers are: 1161345 (984), 2446113 (379), 5356593 (644), 8162789 (521), 10470206 (335), 10514430 (263), and 11465813 (771).
In short, the age or metallicity of the host star of an exoplanet does not significantly affect the probability of detecting a transiting planet, and our control sample is a reasonable control sample for our measurement of relative color offsets. We therefore conclude that selection effects are unlikely to produce the color offsets we observe in Figure 2 and Table 1.
2.2.2 Differential Reddening
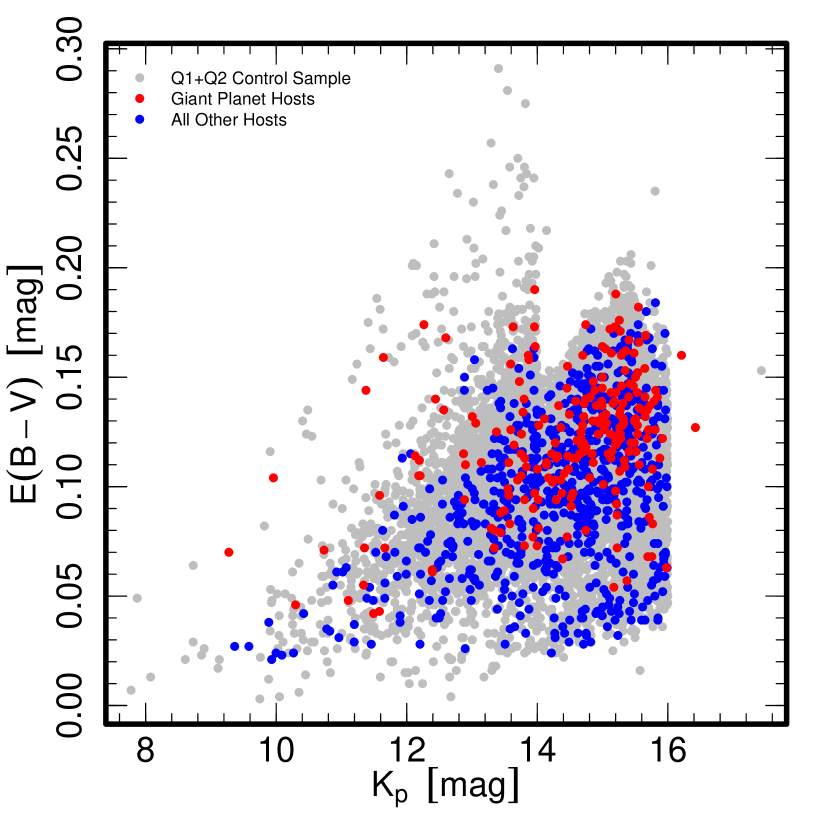
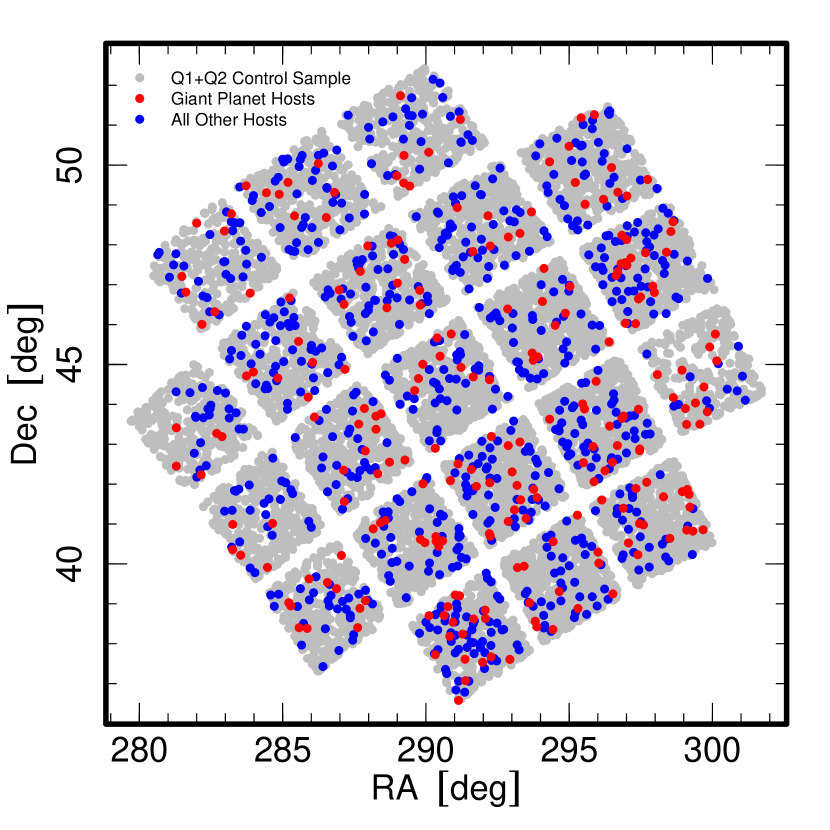
Reddening due to the interstellar medium can affect the observed color of a star. In our differential analysis, this will only affect our result if the reddening of the control sample is systematically different than the reddening of the Kepler EC host sample. Fortunately, Figure 4 indicates that control sample is subject to the same reddening distribution as the EC host sample. Like the EC host sample, the control sample is also spread more or less uniformly over the Kepler field, so any angular dependence on reddening is unlikely to produce a significant color offset between the control sample and the EC host sample. We therefore conclude that differential reddening between the control sample and the Kepler EC host sample is unlikely to produce the color offsets we observe in Figure 2 and Table 1.
2.2.3 Systematic Age Differences
As stars age on the main sequence, their colors can evolve. According to the Padova isochrones, at a 5 Gyr old star is about 0.1% redder in than a 2 Gyr old star at the same color. At , a 10 Gyr old star is about 0.5% bluer in than a 2 Gyr old star at the same color. Clearly, colors of stars do not evolve significantly on the main sequence.
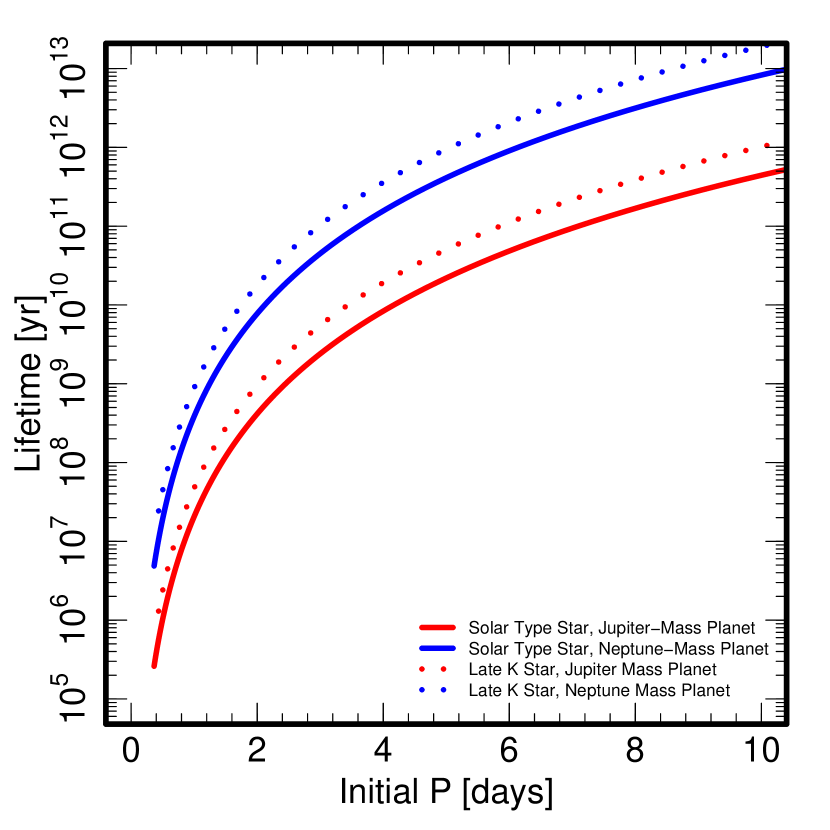
Tidal evolution in exoplanet systems can destroy close-in planets (e.g., Gu et al., 2003; Mardling & Lin, 2004). Transit surveys are strongly biased towards close-in systems, so it is possible that transit surveys may be biased towards young stars, as tidal evolution may have already destroyed planets that once orbited older stars. Assuming that planets arrive in the close proximity of their host star on nearly circular orbits and that the timescale for eccentricity damping is very short, then the timescale for tidal disruption is approximately (e.g., Ibgui & Burrows, 2009; Schlaufman et al., 2010)
| (1) |
where is the initial semimajor axis of the planet before tidal evolution, is the specific dissipation function of the host star, is Newton’s gravitational constant, is the mass of the planet, and is the radius of the host star. If tidal evolution efficiently destroys planets in the Kepler sample, then the hosts of Kepler ECs may be preferentially younger than stars in the control sample. The median period of giant ECs is 13 days, while the median period of small-radius ECs is 10 days. As we plot in Figure 5, the timescale for tidal disruption of such systems is in excess of 100 Gyr. At the same time, as we showed above, age has little effect on the color of a main sequence star at constant . We therefore conclude that systematic age differences between the control sample and the Kepler EC host sample or tidal evolution in EC systems are unlikely to produce the color offsets we observe in Figure 2 and Table 1.
2.2.4 Presence of Giant Stars
Giant stars have stellar radii , and because transit depth is proportional to , the transit of a planet with radius in front of a giant star with is about 10,000 times harder to detect than the transit of the same planet in front of a dwarf star with radius . As a result, Kepler is unlikely to identify transiting planets around giant stars, so the sample of Kepler EC hosts is very likely free of giant stars.
While we only used stars with KIC-based in our control sample, it is possible that a few percent of the stars in our control sample are giant stars (Basri et al., 2011; Brown et al., 2011). Giant stars have slightly bluer colors at constant color than dwarf stars, so the presence of a significant number of giant stars in our control sample could explain the 0.08 mag color offset we observe at between the sample of Kepler EC hosts and our control sample.
To investigate the affect of significant giant star contamination in our control sample, we obtain all available broadband photometry (including 2MASS from Skrutskie et al., 2006) and reddening data from the KIC for a sample of stars observed by Kepler during Q1 and Q2 with KIC-based . The stars in this sample are likely giant stars. Recall that the 10,000 stars in our control sample have KIC-based , so we can add stars from the sample of likely giant stars to our original control sample of likely dwarf stars to create giant star contaminated versions of our our control sample. In particular, we create four versions of the giant star contaminated control sample with differing levels of contamination: 30%, 10%, 5%, and 3% contimination. To determine the color offsets expected at constant color between a sample of 997 dwarf stars (the number of Kepler EC hosts), we create a sample of 997 dwarf stars by randomly selecting 997 stars from the original, not-intentionally contaminated control sample. As before, we compute the mean color in bins of constant color for each of the five samples described above. We plot the result of this calculation in Figure 6.
We find that between 10% and 30% of the stars in our control sample of stars with KIC-based would need to be giants to reproduce the 0.08 mag offset in at we observe between the hosts of Kepler EC and our original not-intentionally contaminated control sample. The level of contamination is at least a factor of a few larger than the level of contamination found in the KIC by Basri et al. (2011) and Brown et al. (2011). Moreover, Figure 6 indicates that a giant star contaminated control sample would have redder color at than control sample of dwarf stars (very much like the likely hosts of Kepler ECs). We do not observe this effect in Figure 2. Indeed, the hosts of Kepler ECs are redder than the control sample at . At the same time, the presence of giant stars has no effect on the color of our sample at . For that reason, the presence of giant stars in our control sample cannot explain the significant color offsets we observe between the hosts of giant Kepler ECs and our original control sample. We therefore conclude that contamination of our control sample by giant stars is unlikely to produce the color offsets we observe in Figure 2 and Table 1.
2.3. Metallicity Offsets from Color Offsets
We use two methods to transform the color offsets we observe in Figure 2 and Table 1 into approximate metallicity offsets. First, we use dereddened fiducial sequences for the open clusters M 67 ([Fe/H] and age Gyr) and NGC 6791 ([Fe/H] = and age Gyr) in the Sloan photometric system from An et al. (2008) plotted in Figure 7. In this case, the fiducial sequences show that at constant , the metal-enriched NGC 6791 fiducial sequence is mag redder in than the solar metallicity M 67 fiducial sequence. Though these two clusters have different ages, the stars with have main-sequence lifetimes much longer than 10 Gyr and therefore should still be on the main sequence in both clusters. Consequently, the mag offset in between the two fiducial sequences is likely a result of the dex offset in [Fe/H] between the two clusters. Accordingly, at constant it seems that results in .
To transform the colors of the points in Figure 2 and Table 1 into , we use a 2 Gyr solar metallicity Padova isochrone. To more precisely estimate the average offset between the M 67 and NGC 6791 fiducial sequences, we calculate the difference between the fiducial sequences at three points ( = 5.9, 6.4, and 6.8 corresponding to = 0.46, 0.54, and 0.62) and average the result. In this way, we find that in the interval , an offset of 0.1 dex in metallicity results in an offset of 0.035 mag in . This method is only applicable to stars with , so in Table 1 we only give the metallicity offsets indicated by this method for the three reddest bins in our analysis.
In order to transform a color offset into a metallicity offset for more massive stars, we use Padova isochrones. In particular, we use two Gyr isochrones for two metallicities ([Fe/H] = -0.1 and 0.1) to determine the change in color at constant attributable to a 0.2 dex increase in metallicity. We use the two isochrones to determine the offset in at constant that can be attributed to metallicity, then use that offset to convert the observed offsets in Table 1 into metallicity offsets (extrapolating if necessary).
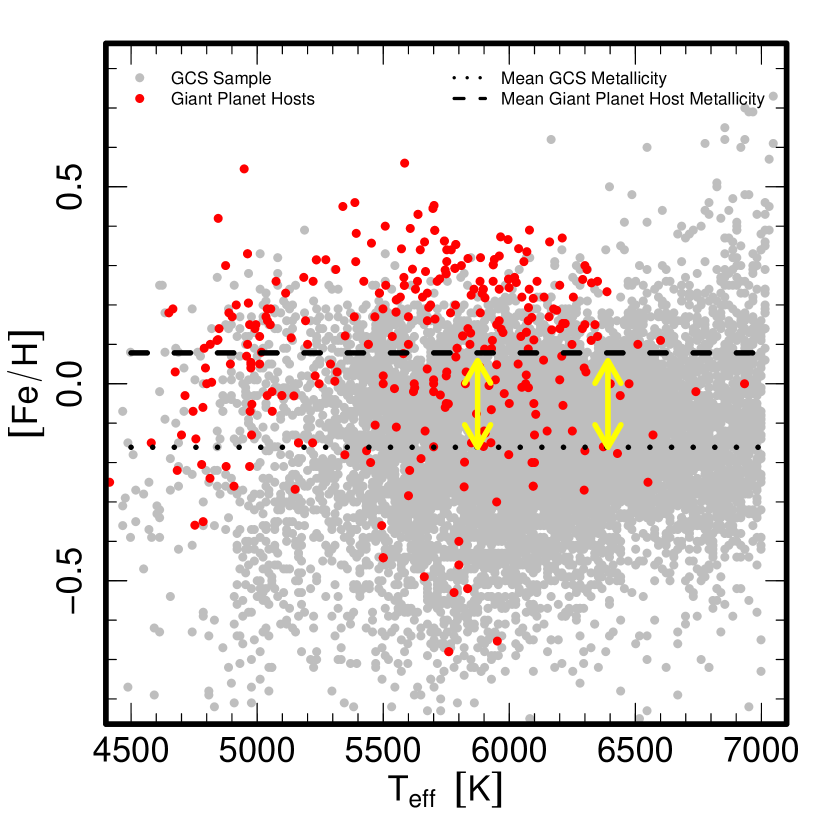
Interestingly, even in the presence of possible systematics in our analysis (e.g., differential reddening, age differences, or the possible presence of giant stars in the control sample), it is reassuring that we recover the fact that solar-type stars that host giant planets are metal enriched relative to the field population. In Figure 8, we plot and metallicity for both a volume-limited sample of stars ( 20 pc) from the Geneva-Copenhagen Survey (GCS - Holmberg et al., 2007, 2009) and confirmed giant planet hosts (e.g., Wright et al., 2011). The horizontal lines give the average metallicities of the two populations. The vertical arrows are at the corresponding to = 0.22 and 0.30. The arrows are anchored at the mean metallicity of the GCS sample, and their length corresponds to the metallicity offset we need to explain the differences in color we observe in the giant planet bins at those colors reported in Table 1. Reassuringly, the metallicity offsets we compute based on color offsets are in quantitative agreement with previous observations of metal-enhancement in giant planet hosts. In other words, our analysis is quantitatively correct in the regime where it is possible to compare with previous results. That is suggestive that our result for the low-mass stars that host small-radius Kepler ECs is also reliable.
3. Discussion
We identified three properties of the Kepler ECs in Section 2:
-
1.
The population of solar-type stars that host giant ECs is 4- redder by 0.04 mag in at constant than a control sample of stars observed by Kepler but with no detected planets.
-
2.
The population of solar-type stars that host small ECs is similar in at constant to a control sample of stars observed by Kepler but with no detected planets.
-
3.
The population of low-mass stars that host small ECs is 4- redder by 0.08 mag in at constant than a control sample of stars observed by Kepler but with no detected planets.
The first observation is consistent with the known correlation between solar-type host star metallicity and likelihood of hosting a giant planet (e.g., Santos et al., 2004; Fischer & Valenti, 2005). The second observation supports the tentative assertion that for solar-type stars in the solar neighborhood, metallicity is only weakly correlated with the likelihood of hosting a low-mass planet (e.g., Udry et al., 2006; Sousa et al., 2008; Bouchy et al., 2009). If the color offset is the result of a 0.2 dex enhancement in [Fe/H] of the low-mass hosts of small-radius Kepler ECs, then the third observation supports the tentative assertion put forth in Schlaufman & Laughlin (2010) that M dwarfs that host low-mass planets are more likely to be metal rich than expected based on random sampling of the field M dwarf population.
The observation that there is a correlation between host star metallicity and the presence of low-mass planets around low-mass stars is expected in the core-accretion model of planet formation. In that scenario, the cores of Neptune-mass planets (and possibly super-Earths) form and grow to several Earth masses before their parent protoplanetary disk is fully dissipated. To first order, the mass of a protoplanetary disk scales as and the fraction of the disk in solid material scales as . The total amount of solids in a disk able to form the core of a Neptune-mass planet is then . The protoplanetary disk in which the solar system formed likely had a solid mass (e.g., Lissauer, 1993). If the probability of forming a planet is proportional to the total amount of solids in its parent protoplanetary disk, a late K dwarf with would need to have a metallicity of [Fe/H] to have the same chance of forming a planetary system as a solar metallicity solar-type star. As a result, it may only be the metal-rich late K dwarfs that have protoplanetary disks with enough solid mass to form the several Earth-mass core of an ice giant or super-Earth. Though comparing stars at constant color forces us to compare stars of slightly different masses, the magnitude of this effect on the planet formation process is likely an order of magnitude smaller than the effect of a 0.2 dex enhancement in [Fe/H].
The correlation between the red optical color of late K dwarfs and probability of hosting a small EC indicates that Kepler might boost its yield of planets by shading their late K dwarf sample to redder optical colors. In particular, focusing on stars in the range above the line
| (2) |
might produce a larger sample of small ECs than a search that does not use red color in its target selection.
4. Conclusion
We find that at , low-mass stellar hosts of small-radius Kepler ECs are 4- redder in than a control sample of stars with the same color but with no detected planets. This result is unlikely to be an artifact of reddening, age differences between the two populations, or the presence of giant stars in the control sample. Stellar models and fiducial sequences in the Sloan photometric system of the Galactic open clusters M 67 and NGC 6791 indicate that a 0.2 dex enrichment in [Fe/H] of the EC host population can produce the offset. We suggest that small planets are preferentially found around metal-rich low-mass stars (confirming the tentative correlation advocated in Schlaufman & Laughlin, 2010). We also confirm that giant Kepler ECs are preferentially found around metal-rich solar-type stars and that the presence of small Kepler ECs orbiting solar-type stars does not seem to be strongly correlated with host metallicity.
References
- An et al. (2008) An, D., et al. 2008, ApJS, 179, 326
- An et al. (2009a) An, D., et al. 2009a, ApJ, 700, 523
- An et al. (2009b) An, D., et al. 2009b, ApJ, 707, L64
- Basri et al. (2011) Basri, G., et al. 2011, AJ, 141, 20
- Batalha et al. (2010a) Batalha, N. M., et al. 2010a, ApJ, 713, L103
- Batalha et al. (2010b) Batalha, N. M., et al. 2010b, ApJ, 713, L109
- Batalha et al. (2011) Batalha, N. M., et al. 2011, ApJ, 729, 27
- Borucki et al. (2010a) Borucki, W. J., et al. 2010a, Science, 327, 977
- Borucki et al. (2010b) Borucki, W. J., et al. 2010b, ApJ, 713, L126
- Borucki et al. (2011a) Borucki, W. J., et al. 2011a, ApJ, 728, 117
- Borucki et al. (2011b) Borucki, W. J., et al. 2011b, arXiv:1102.0541
- Bouchy et al. (2009) Bouchy, F., et al. 2009, A&A, 496, 527
- Brown et al. (2011) Brown, T. M., Latham, D. W., Everett, M. E., & Esquerdo, G. A. 2011, arXiv:1102.0342
- Bryson et al. (2010) Bryson, S. T., et al. 2010, ApJ, 713, L97
- Caldwell et al. (2010) Caldwell, D. A., et al. 2010, ApJ, 713, L92
- Covey et al. (2007) Covey, K. R., et al. 2007, AJ, 134, 2398
- Dunham et al. (2010) Dunham, E. W., et al. 2010, ApJ, 713, L136
- Fischer & Valenti (2005) Fischer, D. A., & Valenti, J. 2005, ApJ, 622, 1102
- Ford et al. (2011) Ford, E. B., et al. 2011, arXiv:1102.0544
- Girardi et al. (2010) Girardi, L., et al. 2010, ApJ, 724, 1030
- Gu et al. (2003) Gu, P.-G., Lin, D. N. C., & Bodenheimer, P. H. 2003, ApJ, 588, 509
- Haas et al. (2010) Haas, M. R., et al. 2010, ApJ, 713, L115
- Holman et al. (2010) Holman, M. J., et al. 2010, Science, 330, 51
- Holmberg et al. (2007) Holmberg, J., Nordström, B., & Andersen, J. 2007, A&A, 475, 519
- Holmberg et al. (2009) Holmberg, J., Nordström, B., & Andersen, J. 2009, A&A, 501, 941
- Howard et al. (2011) Howard, A. W., et al. 2011, arXiv:1103.2541
- Hubickyj et al. (2005) Hubickyj, O., Bodenheimer, P., & Lissauer, J. J. 2005, Icarus, 179, 415
- Ibgui & Burrows (2009) Ibgui, L., & Burrows, A. 2009, ApJ, 700, 1921
- Ida & Lin (2004) Ida, S., & Lin, D. N. C. 2004, ApJ, 616, 567
- Ida & Lin (2005) Ida, S., & Lin, D. N. C. 2005, ApJ, 626, 1045
- Ivezić et al. (2008) Ivezić, Ž., et al. 2008, ApJ, 684, 287
- Jenkins et al. (2010a) Jenkins, J. M., et al. 2010a, ApJ, 713, L87
- Jenkins et al. (2010b) Jenkins, J. M., et al. 2010b, ApJ, 713, L120
- Jenkins et al. (2010c) Jenkins, J. M., et al. 2010c, ApJ, 724, 1108
- Johnson & Apps (2009) Johnson, J. A., & Apps, K. 2009, ApJ, 699, 933
- Johnson et al. (2010) Johnson, J. A., Aller, K. M., Howard, A. W., & Crepp, J. R. 2010, PASP, 122, 905
- Johnson et al. (2007) Johnson, J. A., Butler, R. P., Marcy, G. W., Fischer, D. A., Vogt, S. S., Wright, J. T., & Peek, K. M. G. 2007, ApJ, 670, 833
- Koch et al. (2010a) Koch, D. G., et al. 2010a, ApJ, 713, L79
- Koch et al. (2010b) Koch, D. G., et al. 2010b, ApJ, 713, L131
- Latham et al. (2010) Latham, D. W., et al. 2010, ApJ, 713, L140
- Latham et al. (2011) Latham, D. W., et al. 2011, ApJ, 732, L24
- Laughlin et al. (2004) Laughlin, G., Bodenheimer, P., & Adams, F. C. 2004, ApJ, 612, L73
- Lissauer (1993) Lissauer, J. J. 1993, ARA&A, 31, 129
- Lissauer et al. (2011a) Lissauer, J. J., et al. 2011a, Nature, 470, 53
- Lissauer et al. (2011b) Lissauer, J. J., et al. 2011b, arXiv:1102.0543
- Mardling & Lin (2004) Mardling, R. A., & Lin, D. N. C. 2004, ApJ, 614, 955
- Marigo et al. (2008) Marigo, P., Girardi, L., Bressan, A., Groenewegen, M. A. T., Silva, L., & Granato, G. L. 2008, A&A, 482, 883
- Moorhead et al. (2011) Moorhead, A. V., et al. 2011, arXiv:1102.0547
- Mordasini et al. (2009a) Mordasini, C., Alibert, Y., & Benz, W. 2009, A&A, 501, 1139
- Mordasini et al. (2009b) Mordasini, C., Alibert, Y., Benz, W., & Naef, D. 2009, A&A, 501, 1161
- Pollack et al. (1996) Pollack, J. B., Hubickyj, O., Bodenheimer, P., Lissauer, J. J., Podolak, M., & Greenzweig, Y. 1996, Icarus, 124, 62
- Santos et al. (2004) Santos, N. C., Israelian, G., & Mayor, M. 2004, A&A, 415, 1153
- Schlaufman & Laughlin (2010) Schlaufman, K. C., & Laughlin, G. 2010, A&A, 519, A105
- Schlaufman et al. (2010) Schlaufman, K. C., Lin, D. N. C., & Ida, S. 2010, ApJ, 724, L53
- Skrutskie et al. (2006) Skrutskie, M. F., et al. 2006, AJ, 131, 1163
- Sousa et al. (2008) Sousa, S. G., et al. 2008, A&A, 487, 373
- Udry et al. (2006) Udry, S., et al. 2006, A&A, 447, 361
- Wright et al. (2011) Wright, J. T., et al. 2011, PASP, 123, 412


| Significance | [Fe/H] aaMetallicity offset based on M 67 and NGC 6791 fiducial sequences from An et al. (2008). They are only applicable for stars with . | [Fe/H] bbMetallicity offset based on Padova isochrones (Marigo et al., 2008; Girardi et al., 2010). They are only applicable for stars with . | Significance | [Fe/H] aaMetallicity offset based on M 67 and NGC 6791 fiducial sequences from An et al. (2008). They are only applicable for stars with . | [Fe/H] bbMetallicity offset based on Padova isochrones (Marigo et al., 2008; Girardi et al., 2010). They are only applicable for stars with . | ||||
|---|---|---|---|---|---|---|---|---|---|
| (mag) | () | (mag) | () | (dex) | (dex) | (mag) | () | (dex) | (dex) |
| 0.22 | 1.23 | 0.01 | 1.70 | 0.11 | 0.03 | 2.06 | 0.22 | ||
| 0.30 | 1.05 | 0.01 | 1.14 | 0.05 | 0.04 | 4.44 | 0.22 | ||
| 0.38 | 0.93 | 0.01 | 1.91 | 0.07 | 0.02 | 2.59 | 0.14 | ||
| 0.46 | 0.85 | 0.06 | 1.72 | 0.17 | 0.39 | 0.08 | 4.11 | 0.23 | 0.54 |
| 0.54 | 0.78 | 0.02 | 1.03 | 0.06 | 0.09 | 0.02 | 0.69 | 0.06 | 0.09 |
| 0.62 | 0.73 | 0.08 | 4.00 | 0.24 |
Note. — Columns three through six correspond to the stellar hosts of EC systems with no giant ECs, while columns seven through ten correspond to the stellar hosts of EC systems with at least one giant EC.