Is the young star cluster NGC 376 dissolving in the field of the SMC? 11affiliation: Based on observations with the NASA/ESA Hubble Space Telescope, obtained at the Space Telescope Science Institute, which is operated by AURA, Inc., under NASA contract NAS5–26555. These observations are associated with program 10248.
Abstract
We use deep images acquired with the Advanced Camera for Surveys (ACS) on board of the Hubble Space Telescope (HST) in the filters F555W and F814W to characterize the properties of NGC 376, a young star cluster located in the wing of the Small Magellanic Cloud (SMC). Using isochrone fitting we derive for NGC 376 an age of Myr, in good agreement with previous studies. The high spatial resolution ACS data allow us to determine the center of gravity of the cluster and to construct extended surface brightness and radial density profiles. Neither of these profiles can be fitted with a theoretical model, suggesting that the cluster is not in virial equilibrium. Considering the young age of the cluster, we speculate that the distortion of the radial profiles may be the result of the rapid gas dispersal that follows the initial phase of star formation. The cluster shows clear evidence of dynamical mass segregation. From the properties of the radial profiles and the present day mass function (PDMF) we conclude that NGC 376 appears to have already lost nearly 90% of its initial stellar mass, probably as a consequence of the sudden gas dispersal that follows the early phase of star formation (SF).
1 Introduction
Star clusters are expected to form over a wide spectrum of masses that is later modified by the selective destruction of low-mass clusters (Fall & Rees, 1977; Gnedin & Ostriker, 1997; Vesperini, 1997, 1998). As summarized in Fall & Zhang (2001), star clusters are in general weakly bound and can be easily disrupted by a variety of mechanisms that operate on different time scales. On short () and intermediate () time scales, stellar evolution removes mass from star clusters by a combination of stellar winds, supernovae and other ejecta. On longer time scales () dynamical processes such as internal two-body relaxation, gravitational shocks, and dynamical friction become the main causes of mass loss. Mass loss through stellar evolution, in particular, seems to play a key role in shaping the mass function of the star cluster systems, from the initial power-law, that characterizes the mass function of the star forming regions, to the bell-shaped mass function of the globular clusters (e.g. Vesperini, 1998; Vesperini & Zepf, 2003).
It is now believed that the fast disappearance of extremely young ( Myr) clusters, often known as “infant mortality” (Lada & Lada, 2003), is due to the rapid gas dispersal caused by stellar winds (e.g. Whitworth, 1979), low-mass stars outflows (Matzner & McKee, 2000), and early-type star supernova explosions (Eggleston, 2006). The gas expulsion decreases the binding energy of the initial stellar system and, as a consequence, stars may suddenly have velocities that are higher than the local escape velocity (Tutukov, 1978; Hills, 1980; Goodwin, 1987). The probability that a star cluster will survive the gas dispersal phase depends largely on the efficiency of SF, a property that is still poorly quantified (Elmegreen, 2007; Price & Bate, 2009). Recently, Smith et al. (2011) have studied the effects of gas expulsion on sub-structured clusters formed under non-equilibrium initial conditions. They find that the initial spatial and kinematic distributions of the stars are far more important for cluster survival than the SF efficiency. They suggest that variations in cluster initial conditions, rather than SF efficiencies, determine whether clusters survive gas expulsion or not. In view of these findings, in depth observational studies of the characteristics of young resolved star clusters are clearly needed. Measurements such as their PDMF, the presence of mass segregation, the stellar concentration and density distribution can provide much needed constraints for understanding the evolution and longevity of star cluster systems.
Because of its close proximity (60.6 Kpc; Hilditch et al., 2005), the SMC is uniquely suited for detailed investigations of the stellar content of regions of SF and young star clusters. With HST it is possible to spatially resolve the densest star clusters and perform a quantitative and accurate census of the stellar content down to the sub-solar mass regime (e.g. Sabbi et al., 2008). As part of a project devoted to studying the properties of young and massive star clusters in the SMC (P.I. A. Nota, GO-10248), in this paper we present an in-depth study of the stellar content of the, so far, poorly investigated star cluster NGC 376 () based on HST imaging. NGC 376 is one of the brightest, richest, and youngest (from 16 Myr, Chiosi et al. 2006, to 25 Myr, Piatti et al. 2007) clusters in the eastern extension of the SMC toward the LMC, known also as the SMC wing. Previous studies suggest that the surface brightness profile of NGC 376 departs from a standard EFF model (Elson et al., 1987) and that it may be merging with another cluster (Carvalho et al., 2008).
The paper is organized as follows: in Section 2 we present the observations and the analysis of the data, while Section 3 is dedicated to the description of the color-magnitude diagram (CMD) and of the stellar populations found in the region. In Section 4 we discuss the structural parameters of NGC 376 as derived from the surface brightness and the stellar density profiles. In Section 5 we derive the age of the cluster from isochrone fitting. We present the luminosity function (LF) and the PDMF in Section 6. The results are discussed in Section 7.
2 OBSERVATIONS AND DATA REDUCTION
2.1 The data
We used the HST/ACS Wide Field Channel (WFC) to acquire deep images of NGC 376. The data were obtained in September 2004 as a part of a program devoted to study the characteristics of the youngest star clusters in the SMC (GO-10248; P.I. A. Nota). We acquired four 450 sec long exposures (total integration time 1800 sec) in the F555W filter (V), and four 490 sec long exposures (total integration time=1960 sec) in the F814W filter (I – see Sirianni et al., 2005, for a description of the ACS filters). Both F555W and F814W images were acquired following a four pointing dither pattern designed to better remove hot pixels and fill the gap between the two ACS/WFC CCDs. Dithering also allowed us to better sample the point-spread function (PSF) and, by averaging the flat-field errors and smoothing over the spatial variation of the detector response, to improve the photometric accuracy. To recover the photometric information for the brightest, and otherwise saturated, stars, we acquired two short exposures (3.0 sec) in both filters. A summary of the observations is given in Table 1.
| Image Name | Date & Time of Observation | R.A. | Dec. | Filter | Exposure Time |
|---|---|---|---|---|---|
| J92F08LZQ | 12/09/04 13:52:45 | F555W | 3.0 | ||
| J92F08M0Q | 12/09/04 13:55:06 | F555W | 450.0 | ||
| J92F08M2Q | 12/09/04 14:05:12 | F555W | 450.0 | ||
| J92F08M4Q | 12/09/04 14:15:18 | F555W | 450.0 | ||
| J92F08M6Q | 12/09/04 14:25:24 | F555W | 450.0 | ||
| J92F08M9Q | 12/09/04 14:41:01 | F555W | 3.0 | ||
| J92F08MBQ | 12/09/04 14:49:52 | F814W | 3.0 | ||
| J92F08MCQ | 12/09/04 14:52:13 | F814W | 490.0 | ||
| J92F08MEQ | 12/09/04 15:29:33 | F814W | 490.0 | ||
| J92F08MGQ | 12/09/04 15:40:19 | F814W | 490.0 | ||
| J92F08MIQ | 12/09/04 15:51:05 | F814W | 490.0 | ||
| J92F08MLQ | 12/09/04 16:07:22 | F814W | 3.0 |
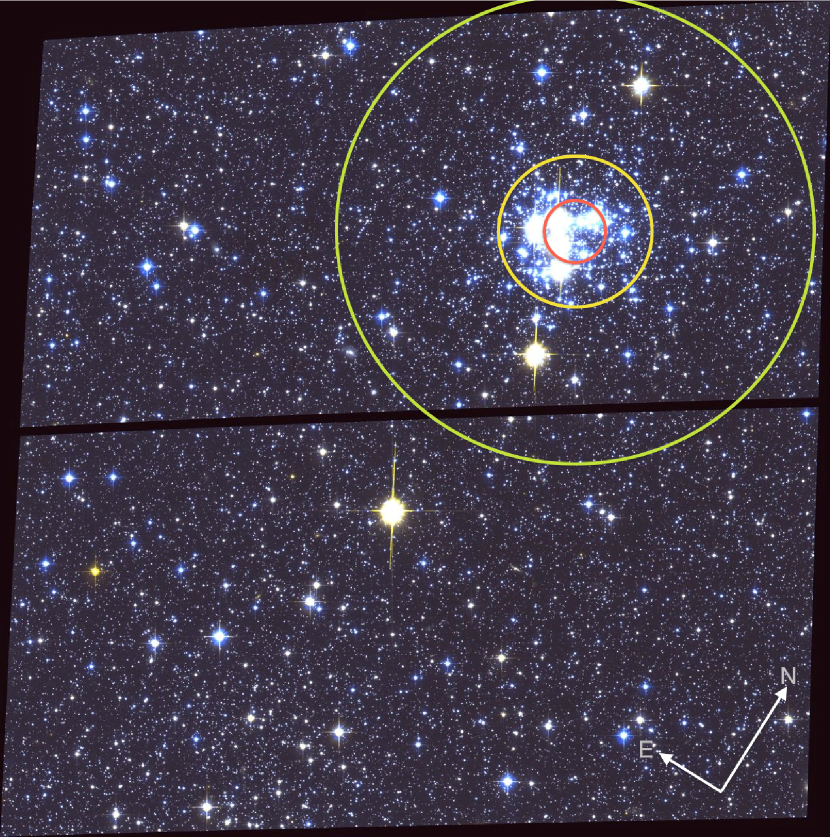
All the images were acquired with a gain of , and the entire data set was processed through the standard Space Telescope Science Institute ACS calibration pipeline CALACS to subtract super-bias, and super-dark, and to apply the flat-field correction. Our ACS/WFC images cover an area of and have a pixel scale of . Assuming a distance modulus (corresponding to , Hilditch et al., 2005) the ACS/WFC field of view corresponds to a projected area of . A color composite ACS/WFC image of NGC 376 is shown in Figure 1.
2.2 Photometric Reduction
The photometric analysis was carried out directly on the pipeline-corrected images with extension _flt, using the program img2xym_WFC.09X10 (Anderson & King, 2006), that was specifically designed to perform photometric analysis of the under-sampled ACS/WFC data. A library of empirical PSFs, that takes into account the PSF spatial variation due to the telescope optics and the variable charge diffusion in the CCD (Krist, 2003), is provided with the code. Temporal variations in the PSF, caused by changes in the telescope’s focus induced by spacecraft breathing, are also taken into account by fitting in each image the library PSF to the brighter () stars.
We used the routine described in Anderson et al. (2008) to further refine the photometry. The program divides all images in to regions of pixels and, region after region, simultaneously finds and fits the stars in all the exposures. For each star found, the code provides the average X and Y coordinates and F555W and F814W magnitudes, the r.m.s. of coordinates and magnitudes, as well as an estimate of the psf-fitting quality.
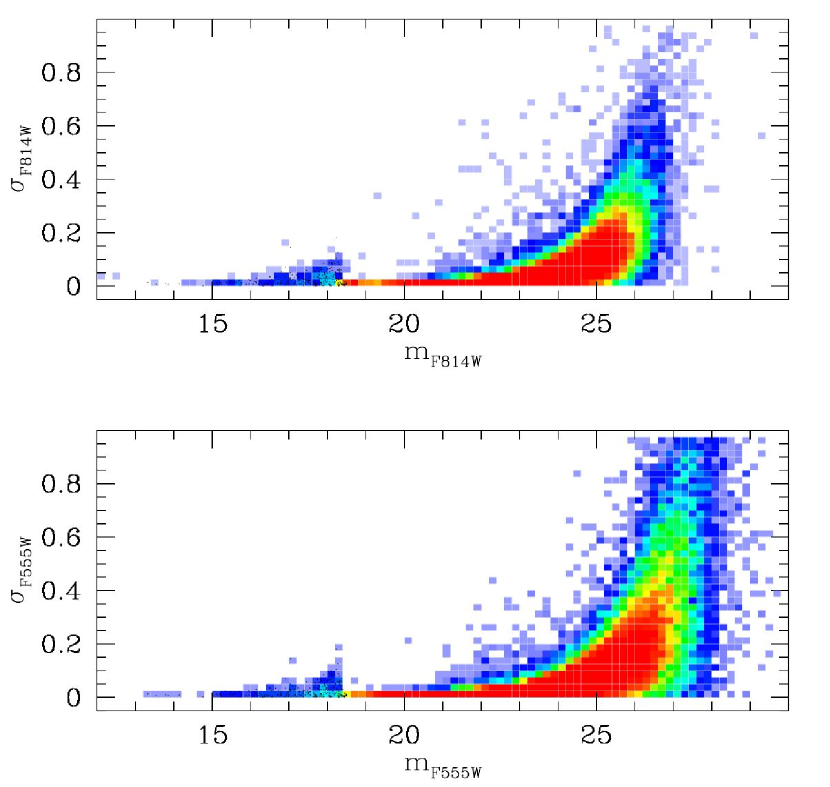
To remove as many spurious detections as possible from the final catalog, we retained only those stars that were identified in both the filters in at least three exposures with a positional error smaller than pixel. Photometric r.m.s as a function of magnitude are shown in Figure 2.
To calibrate the final catalog in the Vegamag photometric system we combined the _flt images using the multidrizzle package (Koekemoer et al., 2002) and performed aperture photometry for several isolated stars for both the F555W and F814W filters using DAOPHOT in IRAF111IRAF is distributed by the National Optical Astronomy Observatory, which is operated by AURA, Inc., under cooperative agreement with the National Science Foundation.. These stars were calibrated into the Vegamag photometric system following the recipe by Sirianni et al. (2005) and then used to calibrate the photometric catalog.
2.3 Artificial Star Tests: Photometric Errors and Completeness
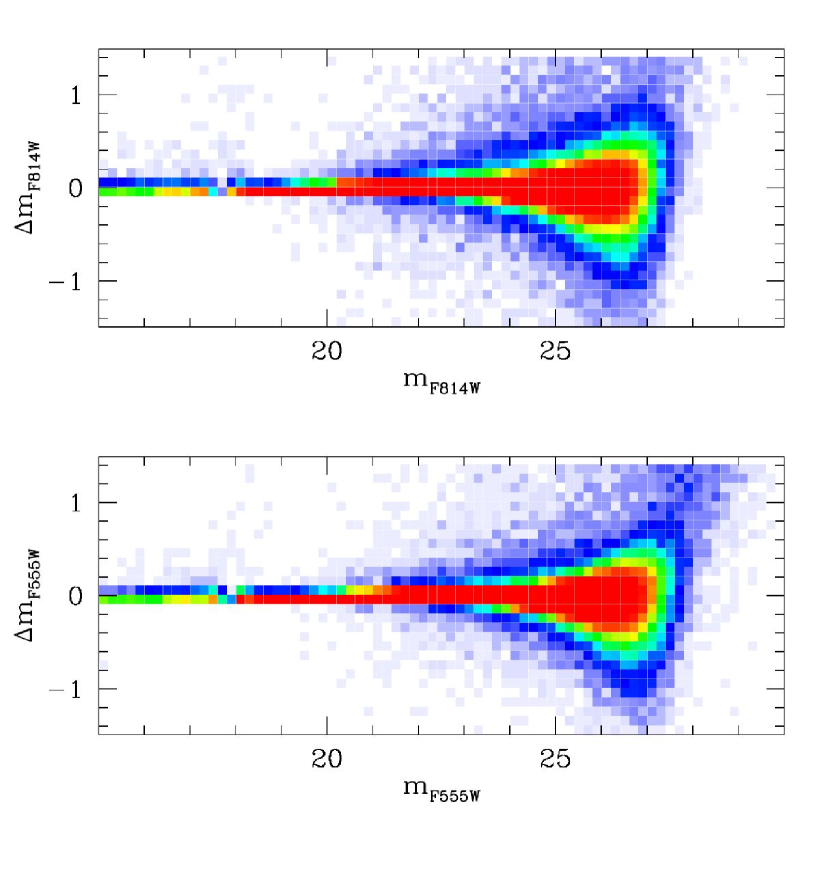
Artificial star tests are a standard procedure used to quantify the completeness of a photometric catalog, as well as to test the impact of crowding on the photometric accuracy. The tests are performed by inserting stars with known flux and position in the data set, and then repeating the photometric analysis using the same procedure applied to the real data. The difference between the input and output magnitude of the recovered artificial stars (Figure 3) provides an estimate of the photometric accuracy, while the photometric completeness, as a function of magnitude, is derived from the fraction of recovered artificial stars with respect to the simulated ones. Figure 4 shows the variation of the completeness factor () as a function of the distance from the center of NGC 376.
The same routines used in Section 2.2 to refine the photometry, can also perform artificial star tests. The program divides each image in to regions of pixels, and adds an artificial star in a region at a time. As during the photometric analysis, the program finds and fits all the sources in the region simultaneously in all the frames (Anderson et al., 2008). This approach avoids the problem that artificial stars interfere with each other, artificially increasing the crowding of the image, and thus altering the inferred completeness. In total we simulated more than 1,000,000 stars in each of the F555W and F814W exposures.
We considered an artificial star as recovered if:
-
•
The input and output fluxes agree to within 0.75 mag;
-
•
The input and output positions agree to within 1 pixel;
-
•
The star is found in at least three F555W and three F814W exposures, with a positional error pixel.
We find that the completeness of our sample varies as a function of the distance from the cluster (Figure 4). For example within the innermost from NGC 376 the sample is 50% complete to , between 5 and the same completeness is at , and it goes down to between 10 and . At and the sample is complete over the entire field.

3 COLOR-MAGNITUDE DIAGRAMS
The CMD versus of all the stars that passed our selection criteria is shown in Figure 5. At a distance of 60.6 kpc (Hilditch et al., 2005) and assuming a metallicity Z=0.001 (Carrera et al., 2008; Parisi et al., 2010), Padua isochrones (Bertelli et al., 2008, 2009) predict that the 13 Gyr main sequence turn-off (MSTO) is at . Our photometry therefore reaches magnitudes below the expected oldest MSTO. Padua isochrones (Bertelli et al., 2008, 2009) for Y=0.24 and different ages and metallicities are superimposed on the CMD of Figure 5 for reference. To plot the isochrones we assumed a distance modulus of , the Galactic extinction law, a reddening of and .
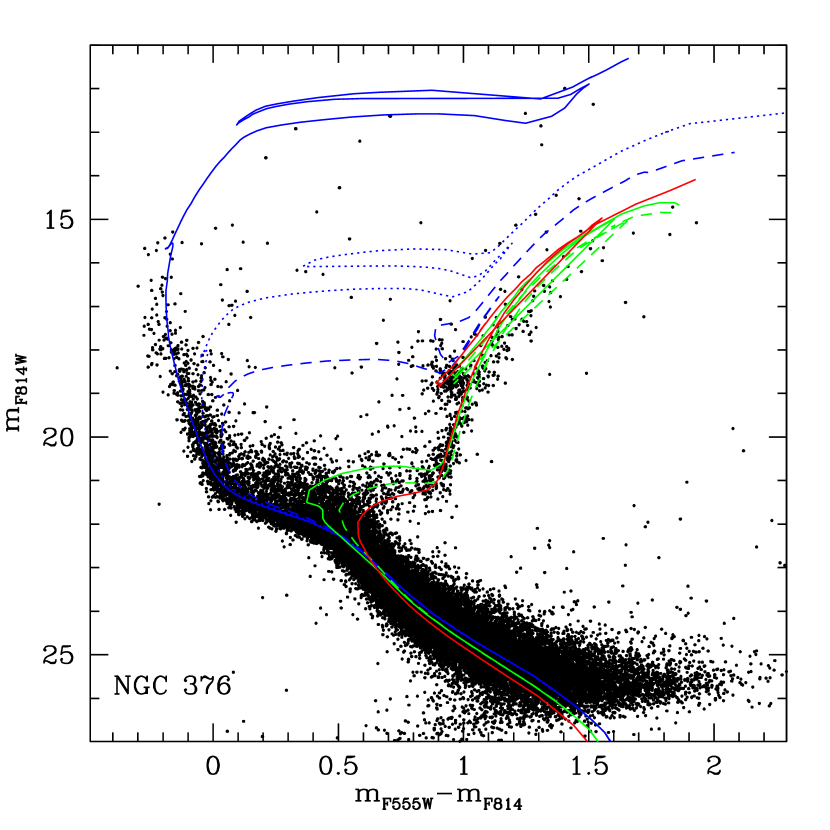
An inspection by eye of Figure 5 shows that, as found in several other SMC stellar fields (i.e. Sirianni et al., 2002; McCumber & Garnett, 2005; Nota et al., 2006; Sabbi et al., 2007; Chiosi & Vallenari, 2007; Carlson et al., 2007; Nol et al., 2007; Sabbi et al., 2009), stellar populations of different ages coexist in the area.
Old stars: A stellar population older than can be easily distinguished in the CMD. Evolutionary phases associated with this population are:
-
•
The well defined lower main sequence (MS), which extends from down to ;
-
•
The broad () subgiant branch (SGB), visible in the color range . Comparison with the isochrones suggests that the majority of the stars in this evolutionary phase are old;
-
•
The bright red giant branch (RGB), with the brightest star at and . The relatively small number of RGB stars does not allow us to establish if the brightest stars of the RGB correspond or not to the RGB-tip;
-
•
The red clump (RC), at .
Asymptotic giant branch (AGB) stars are likely present in the CMD, but it is difficult to separate them from RGB stars.
Young and intermediate-age stars: The bright () and blue () well-populated upper MS indicates that in this region the SMC was still forming stars less than ago. Young low mass stars are likely present in the lower MS, however they cannot be distinguished from the older () MS. This finding is also supported by the presence of stars, above the RC, in the magnitude range and color range which likely corresponds to the lower end of the blue edge of the blue loop and thus are younger than .
Between and there is a secondary sequence of objects that are likely Be stars. Their presence in the CMD suggests that this region was still forming stars ago (Keller et al., 2000). This is also confirmed by the few red super giant stars (RSGs) brighter than and redder than .
In two other SMC star clusters (namely NGC 346 and NGC 602, Nota et al., 2006; Sabbi et al., 2007; Carlson et al., 2007; Cignoni et al., 2009, 2011) a similar observational set-up allowed us to find rich populations of pre-main sequence stars on the right side of the lower MS. The absence of pre-main sequence stars in Figure 5 suggests that in this region of the SMC very few stars, if any, were formed in the last .
Finally we do not find any clear evidence of horizontal branch (HB) stars in the CMD of Figure 5, which are considered unequivocal indicators of a metal poor stellar population, older than , however the presence of an old-metal poor population in the SMC is confirmed by the finding of several RR-Lyrae over the entire SMC (e.g. Sosynski et al., 2002). The paucity of HB stars has been confirmed by other photometric studies of the SMC (i.e. Nol et al., 2007; Sabbi et al., 2009), and this apparent dichotomy between the presence of RR-Lyrae and the absence of extended HB has been interpreted by several authors (i.e. Chiosi & Vallenari, 2007; Nol et al., 2010) as an indication that the SMC formed very few stars in the first 2-3 Gyr .
4 NGC 376 STRUCTURAL PARAMETERS
Once formed, the evolution of a star cluster is affected by a continuous mass loss caused by gas expulsion, low-mass star evaporation and stellar evolution. Surface brightness and stellar density profiles are commonly used to probe the dynamical status of a star cluster. The first step in building a radial profile is to determine the center of the stellar population. Since stellar luminosities are not always proportional to stellar masses, the center of luminosity () can differ significantly from the center of gravity () of a cluster.
In the F555W image the is at . We exploited the high spatial resolution of our photometric catalog to determine also the of NGC 376. To find the we iteratively averaged the stellar X and Y coordinates (Montegriffo et al., 1995). In order to take into account effects due to crowding and incompleteness, we computed the using three different magnitude thresholds (, 23, and 24). Finally to test the impact of the SMC field on our measurement, we derived the both using all the stars, and using only stars bluer than . Our final best estimate of the NGC 376 is .
4.1 The surface brightness profile
NGC 376 has been recently observed in the V band with the ESO Danish 1.54 m telescope, in La Silla (Carvalho et al., 2008). The derived surface brightness profile shows a central peak, and an external “bump” that cannot be reproduced with a standard EFF model (Elson et al., 1987). Carvalho et al. (2008) interpreted these anomalies as the result of a recent, or even still ongoing, merger with another star cluster.
To measure the surface brightness profile of NGC 376 (Figure 6) we divided our catalog into equally spaced annuli centered on the . Because of the cluster location in the upper right corner of the image (Figure 1) only the annuli in the range are fully imaged, while at larger radii only a portion of each annulus falls in our field of view. For this reason we divided each annulus into 12 sectors, and for each annulus we considered only those sectors that fully lie in our field of view.
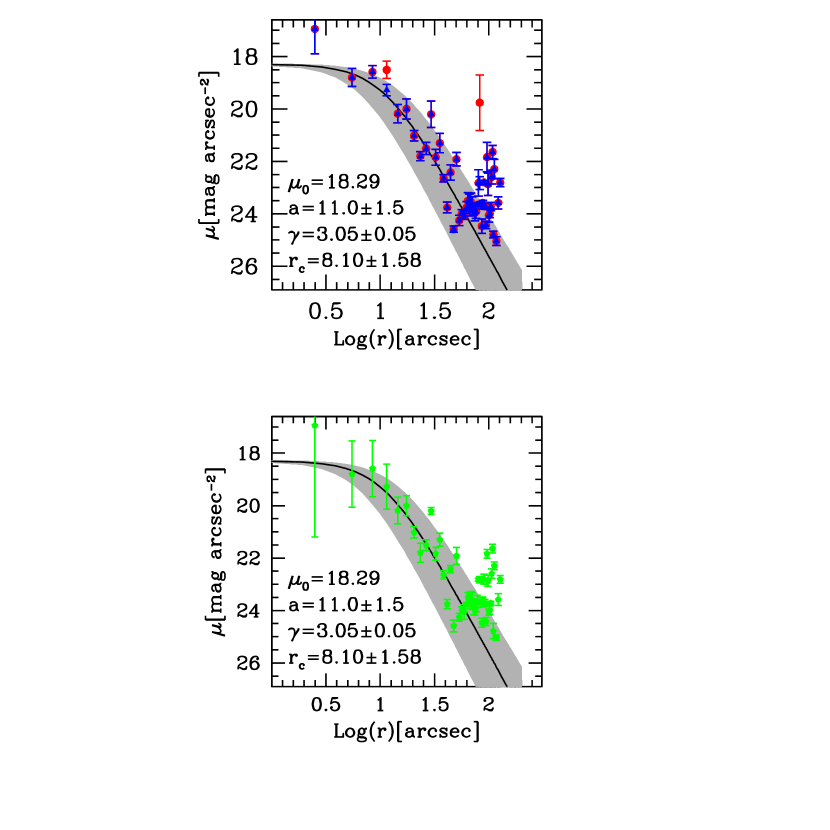
Figure 4 shows that for stars brighter than our catalog is more than 60% complete at each distance from the cluster center. We, therefore, used only stars brighter than this threshold to measure the surface brightness profile. Figure 4 shows also that, because of the increasing crowding, the completeness correction changes as a function of the distance from NGC 376. To apply the right correction to each point of the profile, in each annulus we divided the stars of each sector into bins of magnitude, and to each magnitude bin we applied the completeness factor as measured at that distance from the cluster center.
We used the recipe from Sirianni et al. (2005) to convert the F555W magnitudes into fluxes. The brightness of each sector was obtained by summing the flux of all the stars brighter than . The flux of each annulus was obtained from the average of its sectors.
The well defined RGB and SGB in Figure 5 indicate that a considerable number of stars in our catalog belong to the field of the SMC. To statistically remove the contribution of the SMC from the surface brightness profile, we measured the average surface brightness in SF10, a field in the wing of the SMC () that was observed in January 2006 with a similar observational strategy with the ACS/WFC in the F555W and F814W filters (GO-10396, P.I. J.S. Gallagher), as part of a project devoted to studying the star formation history (SFH) of the field of the SMC (Sabbi et al., 2009) as well as to characterizing the properties of intermediate and old star clusters (Glatt et al., 2008a, b).
The surface brightness profile of NGC 376, after the subtraction of the stars SMC field, is shown in the top panel of Figure 6 (red dots). To fit this profile we used an EFF model expressed in magnitude per surface area, rather than luminosity, using the formula
where is the central surface brightness (corresponding to in the original formula presented in Elson et al., 1987), is the slope of the power-law, and is a dimensionless parameter that is related to the core radius of the King profile by arcsec). The surface brightness profile is quite irregular, and shows an evident central peak that cannot be reproduced by our best fit. In agreement with the findings of Carvalho et al. (2008), beyond there is a bump in the counts that exceeds the EFF profile.
To verify that the irregularities found in the surface brightness profile are not caused by few bright foreground stars nor by local variations in the field of the SMC we repeated the analysis by first selecting only the stars fainter than (blue triangles in the top panel of Figure 6), and then by measuring the average surface brightness at a distance larger than from NGC 376 (Figure 6 – bottom panel).
4.2 The stellar density profile
Surface density profiles are dominated by the light from the brightest stars, but low mass stars play a dominat role in the dynamics of a star cluster. To better constrain NGC 376 dynamics, and taking advantage of the high spatial resolution of the ACS data, we also analyzed the stellar density profile of the cluster. Following our adopted procedure for the surface brightness profile, the stellar density profile was obtained by dividing our sample in equally spaced annuli centered, in this case, on the . Each annulus was divided into 12 sectors to take into account the fact that, at a distance larger than , part of the annuli fall outside the image. In our analysis we considered only those sectors that fully lie in our field of view. In each sector we divided the stars brighter than into bins of magnitude and then we applied the completeness factor , as measured at that distance from the cluster center, to each magnitude bin. We obtained the stellar density of each sector by dividing the number of stars by the area of the sector. The average stellar density of the sectors in an annulus was used as the stellar density of that annulus. To estimate the density in the field of SMC we used both the average stellar density of SF10 (Figure 7 – Top Panel) and the average stellar density at a distance larger than from the cluster (Figure 7 – Bottom Panel). The radial density profile of NGC 376, after the subtraction of the SMC background, is shown in Figure 7.
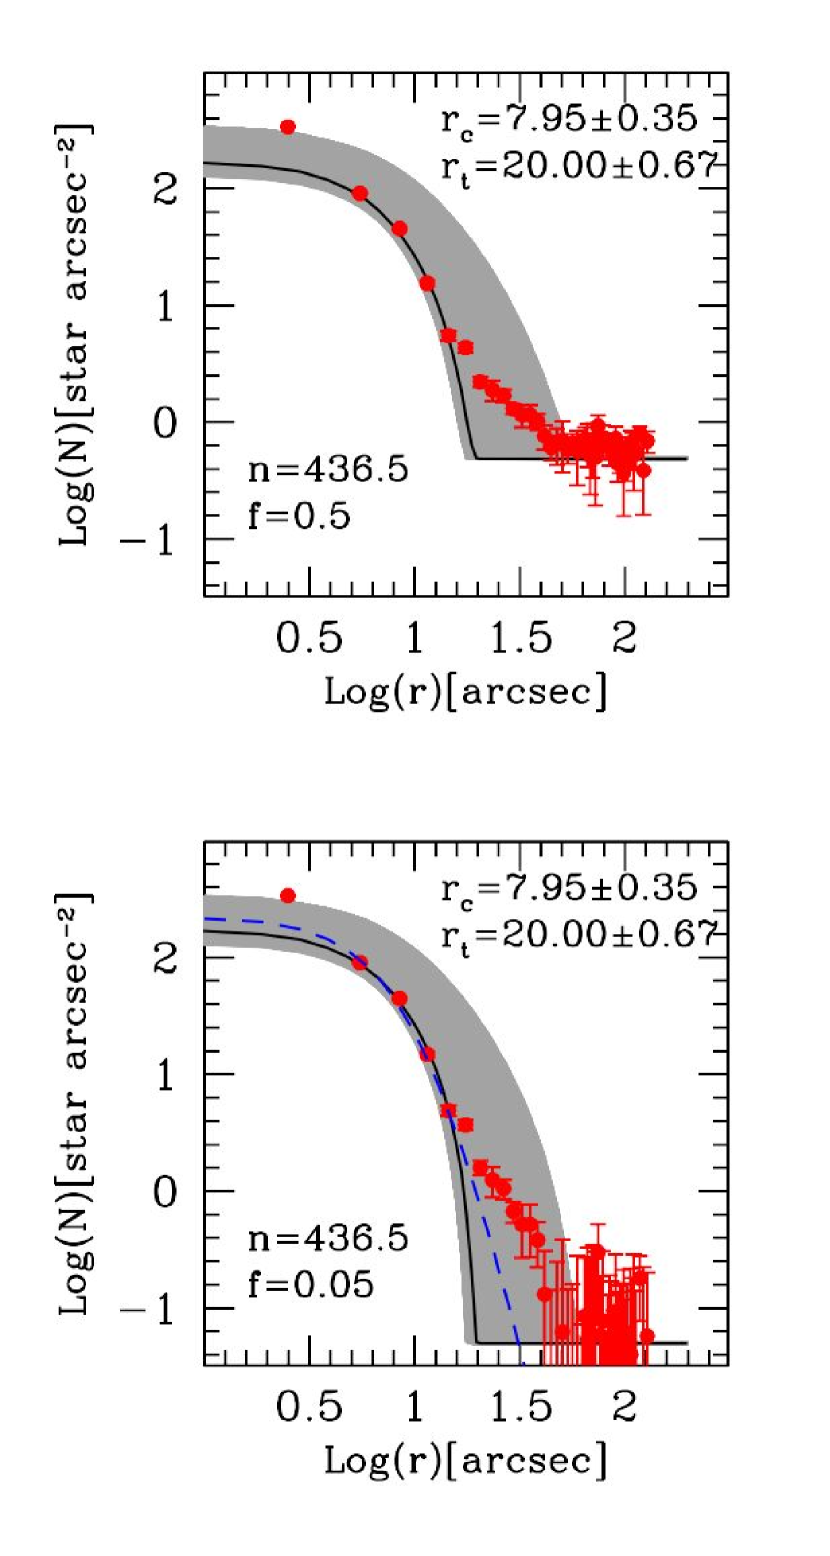
King models (King, 1966) can be used to infer the dynamical status of a star cluster. King profiles are usually described by a core radius , that corresponds to the distance from the center where the projected stellar density falls to 0.5013, and a tidal radius , that indicates where the potential well of the cluster equals zero. The ratio of the two radii ( to ) defines the concentration of the star cluster ( and it can be used to establish if a stellar system is in virial equilibrium or not (Meylan & Heggie, 1997):
-
•
Models with between 0.75 and 1.75 fit relaxed star clusters very well.
-
•
Models with fit core collapsed globular clusters.
-
•
Stellar systems described by a King model with are not in virial equilibrium.
The King model that best fits our data () provides a quite low concentration (), suggesting that the cluster is not in virial equilibrium. To facilitate a more direct comparison between the EFF and King models, in Figure 7 (Bottom Panel) we plotted also the best fit EFF model, derived in Section 4.1. This comparison shows that a single King (or EFF) model cannot fit the entire stellar density profile. Similar to what we found for the surface brightness, our best fit underestimates the stellar density in the innermost , and cannot reproduce the tail of counts that continues well beyond (up to ) the tidal radius () estimated from the best fit of the stellar density profile.
Dynamical simulations (Kupper et al., 2010) using the velocity dispersion profile show that the number of potential escapers from the star cluster increases and, sometimes even dominates the surface density profile, for radii larger than half the Jacobi radius (often approximated to the of the King model). In this context the comparison between the surface brightness and the stellar density profiles seems to suggest that a considerable fraction of the stars that were formed in NGC 376 are not gravitationally bound to the cluster any more.
5 THE AGE
Figure 8 -panel (A) shows the CMD of all the stars brighter than found within the NGC 376 tidal radius. The most evident feature in the CMD is the tight blue () MS, likely populated by NGC 376 stars. However the presence of SGB and RGB stars redder than indicates that even inside the cluster the contribution of stars belonging to the field of the SMC is not negligible. To characterize the field of the SMC around NGC 376 we selected stars brighter than that are at a distance from the of the cluster. This selection allowed us to avoid the population of “potential escapers” that likely dominates between (Figure 7). The CMD of the field, normalized to the area covered by NGC 376, is shown in Figure 8 - panel (B), while the CMD of NGC 376 after the subtraction of the SMC field is shown in Figure 8 - panel (C).

We used Padua isochrones (Bertelli et al., 2008, 2009) computed for Y=0.24 and various Z to infer the age of NGC 376 from the vs. CMD. To reproduce the tight MS of NGC 376 we started from the literature values for distance, reddening and metallicity, and then we varied one parameter at the time. The effects of these changes are shown Figure 9.
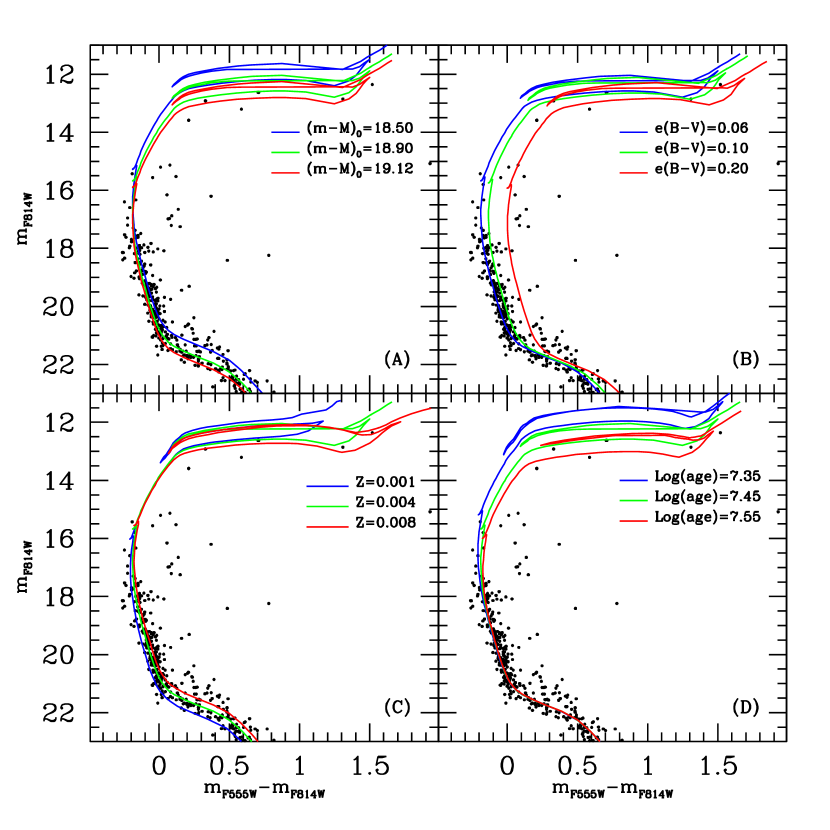
We chose for the distance modulus of the SMC the value derived by Hilditch et al. (2005) from the analysis of more than 50 eclipsing OB star binary systems . The binaries are scattered over the whole galaxy, and therefore are likely representative of the galaxy mean distance. It has to be noted that several authors (e.g. Mathewson et al., 1988; Hatzidimitriou et al., 1993; Crowl, et al., 2001; Lah, et al., 2005; Glatt et al., 2008a) found that the depth of the SMC can be up to 20 kpc. In the sample of clusters analyzed by Glatt et al. (2008a), for example, the closest object has a distance modulus , while the distance modulus of the farthest system is . Panel (A) of Figure 9 shows that among this range of values our data are well fitted by the average distance modulus . Similarly panel (B) of Figure 9 shows that the average SMC reddening value E(B-V)=0.08 (Zaritky et al., 2002) matches our data well. We also considered isochrones for three different metallicity values (Z=0.001, Z=0.004 and Z=0.008 – Panel (C) of Figure 9) and found that a metallicity of 1/5 solar is the most adequate to reproduce both the colors and magnitudes of NGC 376 MS stars from down to . In summary, assuming a distance modulus , a reddening and a metallicity Z0.004, Padua isochrones indicate that NGC 376 has an age of Myr (Figure 9 – panel (D)), in good agreement with the results by Piatti et al. (2007) and with the finding that NGC 376 is hosting several Be stars.
6 PRESENT DAY LUMINOSITY AND MASS FUNCTIONS
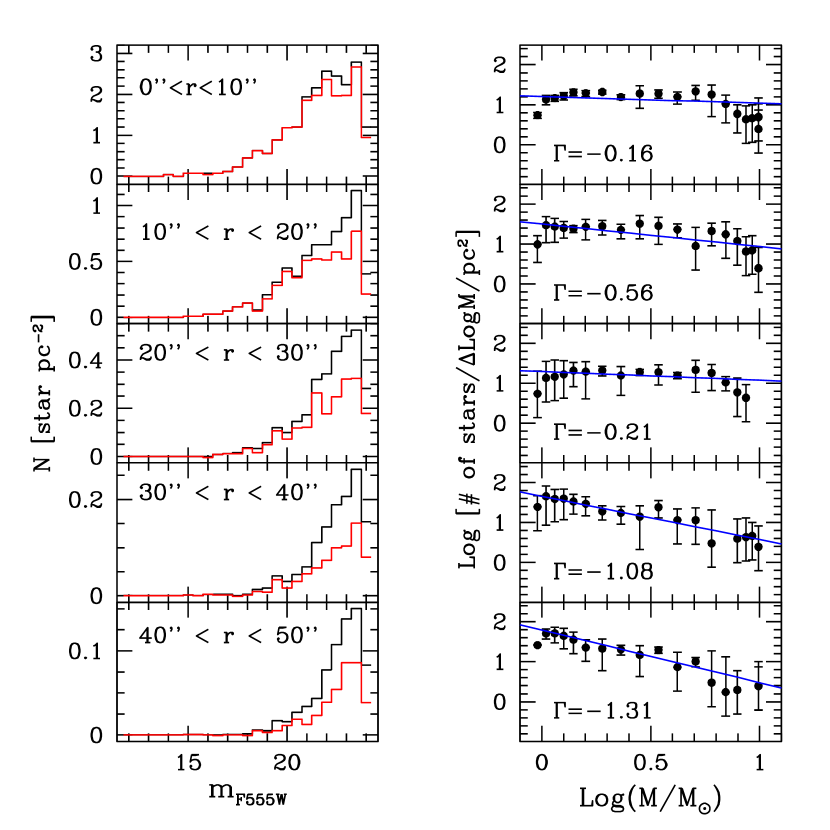
We now examine the stellar PDMF of NGC 376 and derive the total mass of the cluster. We used a procedure analogous to that described in Section 4 to measure the LF of NGC 376 down to and to apply a correction for completeness as a function of the distance from the cluster. To remove the contribution of the SMC stars from the LF we used the LF of the stars found at a distance larger than . The catalog was corrected for completeness and normalized for the area. The LFs in the F555W band as a function of the distance from NGC 376 are shown in Figure 10 (left column) before (black histogram) and after (red histogram) the subtraction of the SMC background.
To convert the observed LFs in to PDMFs we used the mass–luminosity (ML) relation derived from the 28 Myr old, Z=0.004, Y=0.24 Padua isochrone (Bertelli et al., 2008, 2009). Among the available parametrizations, we chose the one proposed by Scalo (1986), in which the MF is characterized by the logarithmic derivative , where is the MF and is its slope. In this parametrization, the slope of the solar neighborhood initial mass function derived by Salpeter (1955) is .
We calculated the derivative of the ML relation in the mass range between 1–10 M⊙ using a spline interpolation. The PDMFs derived in this way for different radii are shown in Figure 10 (right column). The derived slopes are affected by several uncertainties, such as the assumptions on distance, amount of extinction, and age as well as residual contamination from the field. A major source of uncertainty for NGC 376 likely comes from the unresolved binary systems. In a dynamically mass segregated cluster, the most massive binaries should be confined in the center with respect to lighter systems, further steepening the distribution. Sagar & Richtler (1991) estimated that if each star in the mass range 2–14 M⊙ has one companion, the average IMF slope derived for five young clusters in the LMC would significantly steepen. More detailed modeling by Weidner, Kroupa & Maschberger (2009), however, suggests that binaries have little effect on the measured slope of the MF.
A weighted least-mean square fit of the data indicates that the PDMF remains flat () over the entire cluster extent, and it becomes close to the value found by Salpeter only in the cluster’s tail. As for other young star clusters (de Grijs et al., 2002; Sirianni et al., 2002; Stolte et al., 2002; Gouliermis et al., 2004; Sabbi et al., 2008) the steepening of the PDMF with distance from the center is caused by a lack of massive stars rather than an excess of low-mass stars in the outskirts. The paucity of massive stars in the halo of a star cluster is normally interpreted as a signature of mass segregation. Some of the known mass-segregated clusters are so young that mass-segregation has to be primordial (Hillenbrand, 1997; Hillenbrand & Hartmann, 1998; Sabbi et al., 2008). This does not seam to be the case for NGC 376: from the PDMF and the King profile we find that the stellar mass within the tidal radius is , and, considering also the stars in the cluster’s tail (), we find a total mass . It thus appears that only of the present day cluster mass is within the tidal radius. We can substitute the cluster virial radius with the half mass radius (), in which case (considering only the stars within the tidal radius) the dynamical time scale () necessary for NGC 376 to reach dynamical equilibrium is yr , and, if we consider the mass within from the , it rises to yr , pointing toward a dynamical origin for the mass segregation observed in NGC 376. The PDMF also suggests that even within the tidal radius stars are weekly bound since at the tidal radius (which at the distance of the SMC correspond to pc) the escape velocity is . These findings suggest that the NGC 376 is likely evaporating into the field of the SMC. The properties of NGC 376 derived in this paper are summarized in Table 2.
| NGC 376 core radius from King’s model | |
|---|---|
| NGC 376 tidal radius from King’s model | |
| NGC 376 core radius from EFF model | |
| PDMF slope within from the center | |
| PDMF slope between 40 and | |
| NGC 376 total mass | |
| Total mass within | |
| NGC 376 dynamical time | |
| NGC 376 escape velocity | |
| Assumed distance modulus |
7 DISCUSSION AND CONCLUSIONS
We analyzed deep ACS/WFC images of the young star cluster NGC 376 in the filters F555W and F814W, as part of a project devoted to study the formation and evolution of young star clusters in the SMC (P.I. A. Nota; GO–10248). Using Padua isochrones (Bertelli et al., 2008, 2009) we found that NGC 376 is Myr old, in agreement with the previous study by Piatti et al. (2007).
Previous analysis of the cluster surface brightness profile (Carvalho et al., 2008) showed that it is quite irregular, with a spike in the center and an extended bump in the outer regions. We took advantage of the high spatial resolution of our dataset to repeat the analysis of the surface brightness profile and to measure, for the first time, the cluster stellar density distribution down to , which, at the distance of the SMC, for a 28 Myr old stellar population of Z=0.004 metallicity, corresponds to . We used an EFF model (Elson et al., 1987) to fit the surface brightness and a King model (King, 1966) to reproduce the stellar density profile. In both the cases, the best fits underestimate the central peak. Furthermore the stellar density profile shows a tail () that extends well beyond the tidal radius () derived from the best fit King model. Our analysis indicates that NGC 376 has a low concentration (), typical of clusters that are not in virial equilibrium (Meylan & Heggie, 1997).
The anomalous surface brightness profile of NGC 376 was interpreted by Carvalho et al. (2008) as the result of a recent, or even a still ongoing, merger. However, no obvious interacting candidate, such as another star cluster was found in the vicinity of NGC 376, and the tight MS of NGC 376 suggests that all its stars were formed in a relatively short interval of time. Similarly we did not find any know giant molecular cloud (GMC) within , which at the distance of the SMC corresponds to a projected distance of (Mizuno et al., 2001). These circumstances seem to point towards a different source of heating. Bastian & Goodwin (2006) reported that, in some nearby starburst dwarf galaxies, super star clusters younger than 60 Myr show a significant deviation from King and EFF profiles. From the comparison between the observed luminosity profiles and dynamical simulations, Goodwin & Bastian (2006) proposed that these clusters are far from virial equilibrium, because of the likely expulsion of the residual gas after the process of SF. We therefore suggest, as an alternative to the merger hypothesis, that NGC 376 was perturbed by the rapid expulsion of gas that followed the initial phase of SF. Because of the drop in the initial binding energy of NGC 376, a large fraction of stars now have velocities higher than the escape velocity and are no longer gravitationally bound to the cluster.
We studied how the PDMF varies as a function of the distance from the center of NGC 376. We found that the PDMF remains flat () over the entire cluster, and it becomes close to the value derived by Salpeter (1955) for the IMF in the solar neighborhood only in the clusters’s tail beyond the tidal radius. If we assume that the stars found in the tail of stellar density profile between and belong to NGC 376, then almost 90% of total stellar mass of the cluster is likely not bound to the cluster.
Several authors (Zhang & Fall, 1999; Chandar et al., 2006; de Grijs & Anders, 2006; de Grijs & Goodwin, 2008; Gieles & Bastian, 2008; Chandar et al., 2010a, b) have recently analyzed the properties of the young clusters (less than few Myr) in both the Magellanic Clouds with the aim of understanding the disruption mechanisms of star clusters and how long they can survive. However, different groups derived contradicting conclusions, even when using the same data, with some favoring the infant mortality scenario (Carpenter, 2000; Lada & Lada, 2003; Whitmore et al., 2007), that predicts that more than of the clusters will be disrupted in a short, nearly mass independent interval of time (e.g. Chandar et al., 2006, 2010b), and others favoring a less efficient disrupting mechanism (e.g. de Grijs & Anders, 2006; de Grijs & Goodwin, 2008).
From the King profile of NGC 376 and its PDMF we estimate that the escape velocity from the cluster at the tidal radius is , suggesting that even within the tidal radius the stars are probably weakly bound, and that the cluster is likely evaporating. However, additional information on the kinematics of NGC 376 is necessary to confirm the fate of NGC 376. The fact that a cluster as massive as can lose of its mass in less then seems to favor a fast disruptive mechanism. A systematic study of the dynamical and kinematic properties of resolved clusters younger than Myr can provide independent diagnostics to probe the time-scale of cluster disruption.
References
- Anderson & King (2006) Anderson, J., & King, I.R. 2006, PSFs, Photometry and Astronomy for the ACS/WFC (Instrum. Sci. Rep. ACS 2006-01; Baltimore, MD:STScI)
- Anderson et al. (2008) Anderson, J., et al. 2008, AJ, 135, 2055
- Bastian et al. (2005) Bastian, N., Gieles, M., Lamers, H.J.G.L.M., Scheepmaker, R.A., de Grijs, R. 2005, A&A, 431, 905
- Bastian & Goodwin (2006) Bastian, N., & Goodwin, S.P. 2006, MNRAS, 369, L9
- Bastian et al (2006) Bastian, N., Saglia, R.P., Goudfrooij, P., Kissler-Patig, M., Maraston, C., Schweizer, F., Zoccali, M. 2006, A&A, 448, 881
- Bastian et al. (2009) Bastian, N., Gieles, M., Ercolano, B, Guthermuth, R. 2009, MNRAS, 392, 868
- Bertelli et al. (2008) Bertelli, G., Girardi, L., Marigo, P., Nasi, E. 2008, A&A, 484, 815
- Bertelli et al. (2009) Bertelli, G., Nasi, E., Girardi, L., Marigo, P. 2009, A&A, 508, 355
- Carlson et al. (2007) Carlson, L.R., Sabbi, E., Sirianni, M., Hora, J.L., Nota, A., Meixner, M., Gallagher, J.S., Oey, M.S., Pasquali, A., Smith, L.J., Tosi, M., Walterbos, R. 2007, ApJ, 665, L109
- Carpenter (2000) Carpenter, J.M. 2000, AJ, 120, 3139
- Carrera et al. (2008) Carrera, R., Gallart, C., Aparicio, A., Costa, E., Méndez, R.A., & Nol, N.E.D. 2008, AJ, 136, 1039
- Carvalho et al. (2008) Carvalho, L., Saurin, T.A., Bica, E., Bonatto, C., Schmidt, A.A. 2008, A&A, 485, 71
- Chandar et al. (2006) Chandar, R., Fall, S.M., & Whitmore, B.C. 2006, ApJ, 650, L111
- Chandar et al. (2010a) Chandar, R., Fall, M.S., Whitmore, B.C. 2010a, AJ, 139, 545
- Chandar et al. (2010b) Chandar, R., Fall, S.M., Whitmore, B.C. 2010b, ApJ, 711, 1263
- Chiosi et al. (2006) Chiosi, E., Vallenari, A., Held, E.V., Rizzi, L., Moretti, A. 2006, A&A, 452, 179
- Chiosi & Vallenari (2007) Chiosi, E., Vallenari, A. 2007, A&A, 466, 165
- Cignoni et al. (2011) Cignoni, M., Tosi, M., Sabbi, E., Nota, A., Gallagher, J.S. 2011, AJ, 141, 31
- Cignoni et al. (2009) Cignoni, M., et al. 2009, AJ, 137, 3668
- Crowl, et al. (2001) Crowl, H.H., Sarajedini, A., Piatti, A.E., Geisler, D., Bica, E., Clarià, J.J., & Santos, J.F.C, Jr. 2001, AJ, 122, 220
- de Grijs et al. (2002) de Grijs, R., Gilmore, G.F., Johnson, R.A., Mackey, A.D. 2002, MNRAS, 33, 245
- de Grijs & Anders (2006) de Grijs, R., & Anders, P. 2006, MNRAS, 366, 295
- de Grijs & Goodwin (2008) de Grijs, R., & Goodwin, S.P. 2008, MNRAS, 383, 1000
- Eggleston (2006) Eggleton P. 2006, “Evolutionary Processes in Binary and Multiple Stars”. Cambridge Astrophys. No. 40. Cambridge, UK: Cambridge Univ. Press
- Elmegreen (2007) Elmegreen, B.G. 2007, ApJ, 668, 1064
- Elson et al. (1987) Elson, R.A.W., Fall, S.M., & Freeman, K. 1987, ApJ, 323, 54
- Fagotto et al. (1994) Fagotto, F., Bressan, A., Bertelli, G., Chiosi, C. 1994, A&AS, 104, 365
- Fall & Rees (1977) Fall, S.M., & Rees, M.J. 1977, 1977, MNRAS, 181, 37
- Fall & Zhang (2001) Fall, S.M., & Zhang, Q. 2001, ApJ, 561, 751
- Fall et al. (2009) Fall, S.M., Chandar, R., Whitmore, B.C. 2009, ApJ, 704,453
- Gieles & Bastian (2008) Gieles, M., & Bastian, N. 2008, A&A, 482, 165
- Gieles et al. (2010) Gieles, K., Sana, H., Portegiese Zwart, S.F. 2010, MNRAS, 402, 1750
- Glatt et al. (2008b) Glatt, K., Gallagher, J. S., III,glatt Grebel, E.K., Nota, A., Sabbi, E., Sirianni, M., Clementini, G., Tosi, M., Harbeck, D., Koch, A., Cracraft, M. 2008, AJ, 135, 1106
- Glatt et al. (2008a) Glatt, K., et al. 2008, AJ, 136, 1703
- Gnedin & Ostriker (1997) Gnedin, O.Y., & Ostriker, J.P. 1997, ApJ, 474, 223
- Goodwin (1987) Goodwin, S.P. 1987, MNRAS, 286, 669
- Goodwin & Bastian (2006) Goodwin, S.P., & Bastian, N. 2006, MNRAS, 373, 752
- Gouliermis et al. (2004) Gouliermis, D., Keller, S.C., Kontizas, M., Kontizas, E., Bellas-Velidis, I. 2004, A&A, 416, 137
- Hatzidimitriou et al. (1993) Hatzidimitriou, D., Cannon, R. D., & Hawkins, M. R. S. 1993, MNRAS, 261, 873
- Hilditch et al. (2005) Hilditch, R.W., Howarth, I.D., Harries, T.J. 2005, MNRAS, 357, 304
- Hillenbrand (1997) Hillenbrand, L.A. 1997, AJ, 114, 198
- Hillenbrand & Hartmann (1998) Hillenbrand, L.A. & Hartmann, L.W. 1998, ApJ, 492, 540
- Hills (1980) Hills, J.G. 1980, ApJ, 235,986
- Keller et al. (2000) Keller, S.C., Bessell, M.S., Da Costa, G.S. 2000, AJ, 119, 1748
- King (1966) King, I.R. 1966, AJ, 71, 276
- Koekemoer et al. (2002) Koekemoer, A.M., Fruchter, A.S., Hook, R., Hack, W. 2002, in Hubble after the Installation of the ACS and the NICMOS Cooling System, ed. S. Arribas, A. Koekemoer, & B. Whitmore (Baltimore: STScI), 337
- Krist (2003) Krist, J. 2003, ACS WFC & HRC Field-dependent PSF variations Due to Optical and Charge Diffusion Effects (ACS/ISR/ 2003-06; Baltimore, MD:STScI)
- Kupper et al. (2010) Kupper, A.H., Kruppa, P., Baumgardt, H. Heggie, D.C. 2010, MNRAS, 407, 2241
- Lada & Lada (2003) Lada, C.J, Lada, E.A. 2003, ARA&A, 41, 57
- Lah, et al. (2005) Lah, P., Kiss, L. L., & Bedding, T. R. 2005, MNRAS, 359, L42
- Mathewson et al. (1988) Mathewson, D. S., Ford, V. L., & Visvanathan, N. 1988, ApJ, 333, 617
- Matzner & McKee (2000) Matzner, C.D., McKee, C.F. 2000, ApJ, 545, 364
- McCumber & Garnett (2005) McCumber, M.P., Garnett, D.R. 2005, AJ, 514, 96
- Meylan & Heggie (1997) Meylan, G. & Heggie, D.C. 1997, A&A Rev., 8, 1
- Mizuno et al. (2001) Mizuno, N., Rubio, M., Mizuno, A., Yamaguchi, R., Onishi, T., Fukui, Y. 2001, Publ. Astron. Soc. Jpn. 53, L45
- Montegriffo et al. (1995) Montegriffo, P. Ferraro, F.R., Fusi Pecci, F., Origlia, L. 1995, MNRAS, 276, 739
- Nol et al. (2007) Nol, N.E.D., Gallart, C., Costa, E., & Méndez, R.A. 2007, AJ, 133, 2037
- Nol et al. (2010) Nol, N.E.D., Aparicio, A., Gallart, C., Hidalgo, S.L., Costa, E., & Méndez, R.A. 2010, ApJ, 705, 1260
- Nota et al. (2006) Nota, A., Sirianni, M., Sabbi, E., Tosi, M., Clampin, M., Gallagher, J.S., Meixner, M., Oey, M.S., Pasquali, A., Smith, L.J., Walterbos, R., Mack, J 2006, ApJ, 640, L29
- Parisi et al. (2010) Parisi, M.C., Geisler, D., Grocholski, A.J., Sarajedini, A. 2010, AJ, 139, 1168
- Piatti et al. (2007) Piatti, A.E., Sarajedini, A., Geisler, D., Clark, D., Seguel, J. 2007, MNRAS, 377, 300
- Price & Bate (2009) Price, D.J., Bate, M.R. 2009, MNRAS, 398, 33
- Sabbi et al. (2007) Sabbi, E., Sirianni, M., Nota, A., Tosi, M., Gallagher, J., Meixner, M., Oey, M. S., Walterbos, R., Pasquali, A., Smith, L. J., Angeretti, L. 2007, AJ, 133, 44
- Sabbi et al. (2008) Sabbi, E., Sirianni, M, Nota, A., Tosi, M., Gallagher, J.S., Smith L.J., Angeretti, L., Meixner., M., Oey, M.S., Walterbos, R., Pasquali, A. 2008, AJ, 135, 173
- Sabbi et al. (2009) Sabbi, E., et al. 2009, ApJ, 703, 721
- Sagar & Richtler (1991) Sagar, R., & Richtler, T. 1991, A&A, 250, 324
- Salpeter (1955) Salpeter, E.E. 1955, ApJ, 121, 161
- Scalo (1986) Scalo, J. M. 1986, Fund. Cosmic Phys., 11, 1
- Simon et al. (2007) Simon, J.D., Bolatto, A.D., Whitney, B.A., Robitaille, T.P., Shah, R.Y., Makovoz, D., Stanimirovic̀, S., Barbà, R.H., Rubio, M. 2007, ApJ, 669, 327
- Sirianni et al. (2002) Sirianni, M., Nota, A., De Marchi, G., Leitherer, C., Clampin, M. 2002, ApJ, 533, 203
- Sirianni et al. (2005) Sirianni, M., et al. 2005, PASP, 117,1049
- Smith et al. (2011) Smith, R., Fellhauer, M., Goodwin, S., & Assman, P. 2011, MNRAS, submitted (ArXiv:1102.5360)
- Spitzer (1969) Spitzer, L. 1969, ApJ, 127, 17
- Spitzer (1987) Spitzer, L. 1987, Dynamical Evolution of Globular Clusters, Princeton Univ. Press., Princeton, NJ
- Sosynski et al. (2002) Sosynski, I., et al. 2002, Acta Astron., 52, 369
- Stolte et al. (2002) Stolte, A., Grebel, E.K., Brandner, W., Figer, D.F. 2002, A&A, 394, 459
- Tutukov (1978) Tutukov, A.V. 1978, A&A, 70, 57
- Vesperini (1997) Vesperini, E. 1997, MNRAS, 287, 915
- Vesperini (1998) Vesperini, E. 1998, MNRAS, 299, 1019
- Vesperini & Zepf (2003) Vesperini, E., & Zepf, S.E. 2003, ApJ, 587, L97
- Weidner, Kroupa & Maschberger (2009) Weidner, C., Kroupa, P., & Maschberger, T. 2009, MNRAS, 393, 663
- Whitmore et al. (2007) Whitmore, B.C., Chandar, R., Fall, S.M. 2007, AJ, 133, 1067
- Whitworth (1979) Whitworth, A. 1979, MNRAS, 186, 59
- Zaritky et al. (2002) Zaritsky, D. Harris, J., Thompson, I.B, Grebel, E.K, Massey, P. 2002, AJ, 123, 855
- Zhang & Fall (1999) Zhang, Q. & Fall, S.M. 1999, ApJ, 527, L81