DA white dwarfs in SDSS DR7 and a search for infrared excess emission
Abstract
We present a method which uses colour-colour cuts on SDSS photometry to select white dwarfs with hydrogen rich (DA) atmospheres without the recourse to spectroscopy. This method results in a sample of DA white dwarfs that is 95% complete at an efficiency of returning a true DA white dwarf of 62%. The approach was applied to SDSS Data Release 7 for objects with and without SDSS spectroscopy. This lead to 4636 spectroscopicially confirmed DA white dwarfs with ; a increase compared to Eisenstein et al.’s 2006 sample. Including the photometric-only objects, we estimate a factor of 3 increase in DA white dwarfs. We find that the SDSS spectroscopic follow-up is complete for DA white dwarfs with K. We further cross-correlated the SDSS sample with Data Release 8 of the UKIDSS Large Area Survey. The spectral energy distributions of both subsets, with and without SDSS spectroscopy, were fitted with white dwarf models to determine the fraction of DA white dwarfs with low-mass stellar companions or dusty debris discs via the detection of excess near-infrared emission. From the spectroscopic sample we find that of white dwarfs have an excess consistent with a brown dwarf type companion, with a firm lower limit of . From the white dwarfs with photometry only, we find that are candidates for having brown dwarf companions. Similarly, both samples show that of white dwarfs are candidates for having a dusty debris disc.
keywords:
Stars: individual: white dwarfs – infrared excess1 Introduction
White dwarfs are the most common stellar remnants in the Galaxy, having descended from main sequence stars with . Of these, hydrogen rich (DA) white dwarfs make up the vast majority. Large samples of white dwarfs are particularly useful in many studies, for example constraining the luminosity function, which in turn can be used to determine the ages of many Galactic populations (e.g. Winget et al., 1987; Oswalt et al., 1996; De Gennaro et al., 2008). The low luminosity of white dwarfs also makes them ideal targets for searches of low-mass companions, such as pioneered by Probst & Oconnell (1982). The companion mass distribution is thought to drop near the low-mass end (), and the fraction of FGK stars with substellar companions estimated from radial velocity surveys is % (e.g. Marcy & Butler, 2000; Grether & Lineweaver, 2006), though Metchev & Hillenbrand (2009) suggest that substellar companions are more frequent at larger orbital separations. Because white dwarfs are the progeny of main-sequence stars with masses of up to 8 , studies of white dwarf binaries can probe the companion mass function over a wide range of (initial) host star masses. Currently, only four white dwarfs are confirmed to have (non-interacting) substellar companions (Becklin & Zuckerman 1988; Farihi & Christopher 2004; Maxted et al. 2006; Steele et al. 2009, but see Luhman et al. 2011 for a very low-mass candidate), and the fraction of white dwarfs with brown dwarf companions appears to be consistent with the low number found around FGK stars (Farihi et al., 2005; Hoard et al., 2007).
While white dwarfs are also excellent candidates for searches of Jovian planets (e.g. Ignace, 2001; Burleigh et al., 2002), no planet has yet been unambiguously discovered around a white dwarf (Burleigh et al. 2008; Hogan et al. 2009; Mullally et al. 2009). However, white dwarfs are known to exhibit infrared flux excesses that can not be explained by the presence of low-mass (planetary or substellar) companions (Farihi et al., 2009). The first such infrared excess was found around G 29-38 and tentatively associated with a brown dwarf companion (Zuckerman & Becklin, 1987). Using the fact that G 29-38 is a pulsating white dwarf, Graham et al. (1990) demonstrated that the observations are best explained with the presence of circumstellar dust heated by the white dwarf, and proposed the disruption of a large asteroid as the origin of the dust. Koester et al. (1997) detected metals in the photosphere of G 29-38, demonstrating that the white dwarf is accreting circumstellar material. The scenario of the tidal disruption of rocky asteroids has been refined by Jura (2003), and is now the generally accepted interpretation of the growing number of metal-polluted white dwarfs with infrared excess. Farihi et al. (2009) estimate that % of all white dwarfs with cooling ages below 0.5 Gyr should exhibit infrared excess related to the tidal disruption of asteroids. The location of the debris material within the white dwarf tidal disruption radius for a rocky asteroid has ultimately been confirmed by Gänsicke et al. (2006b) who detected Doppler-broadened Ca II emission lines from a gaseous component of the circumstellar disc in SDSSJ122859.93+104032.9, a metal-polluted white dwarf with infrared excess (Brinkworth et al., 2009).
In this paper, we use the Sloan Digital Sky Survey (SDSS) to first identify a method to select hydrogen-rich (DA) white dwarfs using photometric criteria, and then determine those with infrared flux excess in the UKIRT Infrared Deep Sky Survey (UKIDSS). Our method is sensitive to unresolved M and L-type companions and to warm debris discs. The long-term goal of this project is to increase the number of such objects available for detailed follow-up studies, and to provide a more detailed understanding of the frequency of both substellar companions to and planetary debris discs around white dwarfs.
The structure of the paper is as follows: In Sect. 2 we discuss the three surveys that are utilised in this paper; the Sloan Digital Sky Survey, the UKIRT Infrared Deep Sky Survey and the Wide-field Infrared Survey Explorer (WISE). The method for selecting DA white dwarfs from SDSS DR7 is outlined in Sect. 3 along with a discussion of the spectroscopic completeness of SDSS with respect to DA white dwarfs. The procedure for cross-matching objects from SDSS with UKIDSS is demonstrated in Sect. 4. Identifying which white dwarfs show an IR excess and the method for fitting these excesses is given in Sect. 5. Further to this, Sect. 5.4 discusses comparisons between the spectroscopic and photometric fitting methods, including how contaminants were dealt with. A summary of the overall numbers of objects at each stage of the process is given in Sect. 5.5. Some notes on interesting objects discovered in this work are given in Sect. 6. A comparison between the work herein and the white dwarf–main sequence star catalogue of Rebassa-Mansergas et al. (2010) is made in Sect. 7. Objects that are detected in WISE are discussed in Sect. 8. The implications of the DA white dwarf selection and the IR excess selection methods are discussed in Sect. 9. Finally, the conclusions of this work are drawn together in Sect. 10.
2 Large area surveys
The Sloan Digital Sky Survey (SDSS, York et al. 2000; Stoughton et al. 2002) and the UKIRT Infrared Deep Sky Survey (UKIDSS, Lawrence et al. 2007) are currently the deepest large-area optical and infrared surveys that are publicly available, and we summarise below details of both surveys relevant for our work.
2.1 SDSS
We have made use of the SDSS Data Release seven (DR7, Abazajian et al. 2009), which represents the final DR of the SDSS II project, including the low-latitude extension SEGUE (Yanny et al., 2009). SDSS DR7 provides photometry for 357 million objects spanning a magnitude range and covering , approximately one-quarter of the celestial sphere, as well as follow-up low-resolution (, Å) spectroscopy for 1.44 million galaxies, quasars, and stars. We limit our search to point-like sources, and to apparent magnitudes , which leaves million unique photometric and 87,000 unique spectroscopic objects. An additional important resource within DR7 are proper motions computed from the USNO-B and SDSS positions.
2.2 UKIDSS
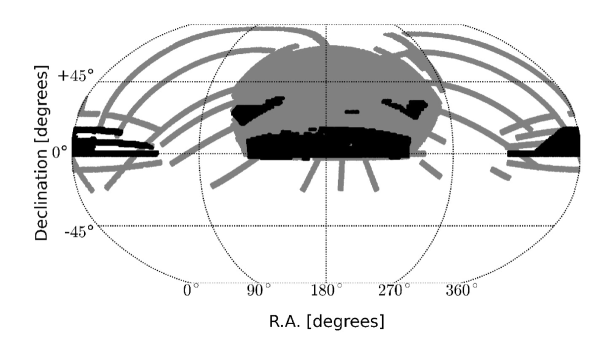
UKIDSS is a set of five near infrared surveys being undertaken with the Wide Field Camera (WFCAM) instrument on the United Kingdom Infrared Telescope (UKIRT) in Hawaii. One of the five sub-surveys, the Large Area Survey (LAS), aims to be the IR counterpart to the SDSS. Here we match SDSS hydrogen-dominated (DA) white dwarfs with UKIDSS LAS as opposed to 2MASS used in similar studies (e.g. Hoard et al., 2007) because a large majority of the SDSS white dwarfs are too faint in the IR for 2MASS to pick up. UKIDSS LAS will eventually provide imaging over in four broad band colours, , , , and , with limiting (Vega) magnitudes of 20.2, 19.6, 18.8 and 18.2, respectively, which adds a significant increase in depth over 2MASS. Here, we made use of UKIDSS DR8 (see Dye et al. 2006). The overlap between SDSS DR7 and UKIDSS/LAS DR8 is illustrated in Fig. 1, and amounts to square degrees.
2.3 WISE
The Wide-field Infrared Survey Explorer (WISE) is a NASA Medium-class Explorer mission designed to survey the entire sky in four infrared wavelengths, , , , and m (Wright et al., 2010). WISE consists of a 40 cm telescope that images all four bands simultaneously every 11 s. It covers nearly every part of the sky a minimum of eight times, ensuring high source reliability, with more coverage at the ecliptic poles. Astrometric errors are less than 0.5 arcsec with respect to 2MASS (Wright et al., 2010). The preliminary estimated S/N = 5 point source sensitivity on the ecliptic is 0.08, 0.1, 0.8, and 5 mJy in the four bands (assuming eight exposures per band; Wright et al., 2010). Sensitivity improves away from the ecliptic due to denser coverage and lower zodiacal background. We took advantage of the preliminary data release (PDR). The SDSS white dwarfs that are the subject of this work are largely too faint to be seen in the , and m bands and therefore we generally only discuss the and m fluxes.
3 Selecting DA white dwarfs in SDSS DR7
| Colour | constraint | |
|---|---|---|
| 19 | ||
| flags & 0x10000000 | ||
| flags & 0x8100000c00ac |
The latest catalogue of spectroscopicially identified SDSS white dwarfs was based on DR4 (Eisenstein et al., 2006), which comprised roughly half of the sky coverage of DR7. Here, we exploit the much larger footprint of SDSS DR7, and also extend the white dwarf sample to photometric objects without follow-up spectroscopy. We restricted our ambitions to DA white dwarfs for a number of reasons. Firstly, the vast majority of all known white dwarfs belong to the DA class (McCook & Sion, 1999). Secondly, determining the atmospheric parameters of DA white dwarfs, and , from fitting atmosphere models to either spectroscopy (Bergeron et al., 1992) or photometry (Koester et al., 1979) is a well-established and robust procedure. This is essential for the purpose of identifying white dwarfs with infrared excess, as we need to accurately extrapolate the white dwarf flux to the , and bands. Thirdly, optical spectra of DA white dwarfs are characterised by strong Balmer absorption lines on a blue continuum, and the strong dependence of the Balmer line equivalent widths results in DA white dwarfs occupying a distinct region in colour space.
We have developed a two-pronged approach to identify as many DA white dwarfs with spectroscopy within DR7, and subsequently to select white dwarf candidates which have photometry but were not spectroscopically followed-up by SDSS.
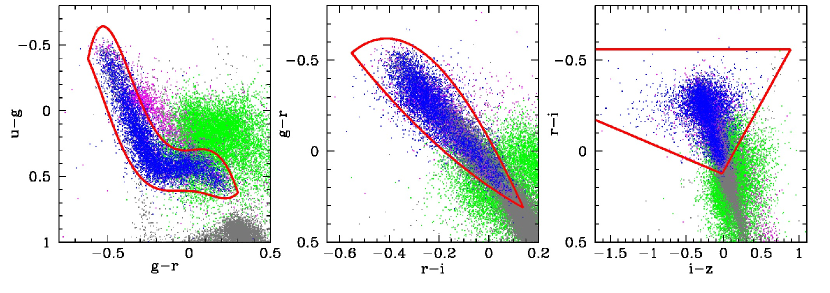
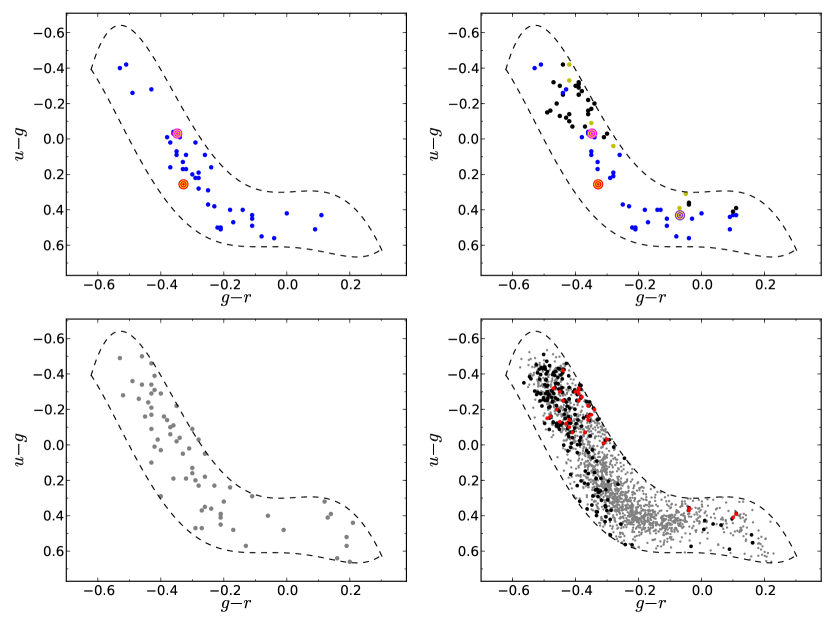
As a start, we retrieved the DR7 spectra and photometry for all white dwarfs with and classified by Eisenstein et al. (2006) as DA or DA_auto, corresponding to visually confirmed and automatically classified hydrogen-dominated white dwarfs, respectively. This totals 2889 unique objects, 938 being classified as DA and 1951 DA_auto. All spectra were visually inspected to corroborate their DA classification, and we found 99.4% agreement with the classification for white dwarfs by Eisenstein et al. (2006). The 0.6% disagreement primarily comes about from non-DA white dwarfs that were classified as DA_auto by Eisenstein et al.’s classification routine. The sample of spectroscopically confirmed DA white dwarfs was then used to trace the locus of DA white dwarfs in the , , and colour-colour planes. The population of DA white dwarf follows a boomerang-shape in colours, where it is clearly separated from the main sequence, but intersects the quasar population (Fig. 2).
This relatively complex shape was approximated by the intersection of two 5th-order polynomials (Table 1). In the DA white dwarfs lie along a relatively narrow band, overlapping with the blue end of the main sequence and, to some extent with quasars, which we approximated by the combination of a 2nd and 3rd order polynomial. Finally, in , the DA white dwarfs are again located at the blue end of the main sequence, but display a relatively large spread in . Visual inspection of the SDSS spectra of the outliers confirms them as DA white dwarfs, though the majority of them are near the faint end of the Eisenstein et al. sample. We decided to include those outliers in our colour-cut, and hence approximated the DA locus by the intersection of three linear relations in .
We applied a magnitude cut of as a (conservative) measure, so that each of the SDSS white dwarfs within the UKIDSS footprint would have a significant -band detection. Finally, we applied a set of recommended data quality flags to the SDSS photometry to minimise contamination by instrumental artifacts and blended stars. Applying the constraint set summarised in Table 1 to DR7 resulted in the selection of 7444 unique spectroscopic objects, which were then visually classified as DA white dwarfs, other (non-DA) white dwarfs, quasars, narrow line hot stars (see below), and other objects (Table 2).
3.1 Narrow Line Hot Stars
The optical spectra of ultra-low mass white dwarfs and very cool DAs, particularly those at low signal-to-noise ratio, can look rather similar to early type main sequence stars, subdwarfs, extreme horizontal branch stars or very metal-poor halo stars, which we all lump together as contaminants with the designation “narrow line hot stars” (NLHS). These are particularly dominant at the bright end of the white dwarf banana (, see Table 2). While there is noticeable interest in ultra-low mass white dwarfs (e.g. Liebert et al., 2004; Kilic et al., 2007; Marsh et al., 2010), they represent a tiny fraction of all DAs. Given that our aim is to study the bulk population of DA white dwarfs, we make no attempt to accurately classify ultra-low mass white dwarfs. In addition, our colour selection is only complete to effective temperatures above K. Attempting to include much cooler white dwarfs would result in significant contamination from NLHS.
3.2 Overall Completeness and Efficiency
Completeness and efficiency were the key parameters in designing our selection algorithm (Table 1), where we define completeness as the fraction of Eisenstein et al.’s DA white dwarfs recovered by our constraints, and efficiency as the ratio of spectroscopically confirmed DA white dwarfs to all objects in our colour-magnitude selection. In the case of the spectroscopic DA sample, one may argue that completeness is more important than efficiency because contaminants can be removed through visual spectral classification of all candidate objects. On the other hand, the photometric-only DA sample requires a high level of efficiency to minimise the number of contaminants. We optimised the colour boundaries to maximise both completeness and efficiency, and the constraint set in Table 1 results in a completeness of 95.4% and an efficiency of 62.3% (Table 2). From SDSS DR7, a total unique spectroscopic DA white dwarfs are contained within the colour-magnitude cuts. This represents a increase in spectroscopic DA white dwarfs with over the Eisenstein et al. (2006) sample. The photometric-only DA white dwarf candidates sample similarly contains 9341 objects. Assuming 62.3% efficiency of the selection, extra white dwarfs are contained within the sample and therefore the total increase over Eisenstein et al. (2006) is approximately a factor or three. The efficiency is however only a lower limit for the photometric sample because the SDSS is by design almost spectroscopicially complete for QSOs, one of our main contaminants. Therefore, QSOs are only a minor contaminant in the photometric-only sample.
The spectral classification and completeness are given as a function of -magnitude in Table 2. The completeness drops slightly towards larger apparent magnitude because of the larger scatter in the colour-colour diagrams. The fraction of NLHS contaminants is largest at the bright end of our sample, which is a natural consequence of the much larger intrinsic brightness of subdwarfs and early-type main-sequence stars, and the fraction of quasar contaminants increases towards larger apparent magnitudes. It is possible to eliminate a fair fraction of the contaminants in the photometric-only sample by using additional information such as proper motions and infrared colours (see Sect. 5.4).
| All WD | DA WD | NLHS | QSO | Other WD | Other | Efficiency | Completeness | Photometric-only | |||||||
|---|---|---|---|---|---|---|---|---|---|---|---|---|---|---|---|
| Candidates | N | % | N | % | N | % | N | % | N | % | NTot | NDA | |||
| 258 | 79 | 30.6 | 161 | 62.4 | 0 | 0.0 | 13 | 5.0 | 5 | 1.9 | 30.6% | 95.8% | 893 | 273 | |
| 16-17 | 581 | 326 | 56.1 | 185 | 31.8 | 22 | 3.8 | 44 | 7.6 | 4 | 0.7 | 56.1% | 96.7% | 980 | 550 |
| 17-18 | 1719 | 1092 | 63.5 | 225 | 13.1 | 230 | 13.4 | 165 | 9.6 | 7 | 0.4 | 63.5% | 96.5% | 2278 | 1447 |
| 18-19 | 4886 | 3139 | 64.2 | 269 | 5.5 | 1028 | 21.0 | 439 | 9.0 | 11 | 0.2 | 64.2% | 95.0% | 5190 | 3332 |
| Total | 7444 | 4636 | 62.3 | 840 | 11.3 | 1280 | 17.2 | 661 | 8.9 | 27 | 0.4 | 62.3% | 95.5% | 9341 | 5819 |
| Total DA WD | Photometrically selected DAs | Completeness | |||||||||||||
| Eisenstein | 2889 | 2757 | 95.4% | ||||||||||||
3.3 Completeness of SDSS spectroscopy for DA white dwarfs
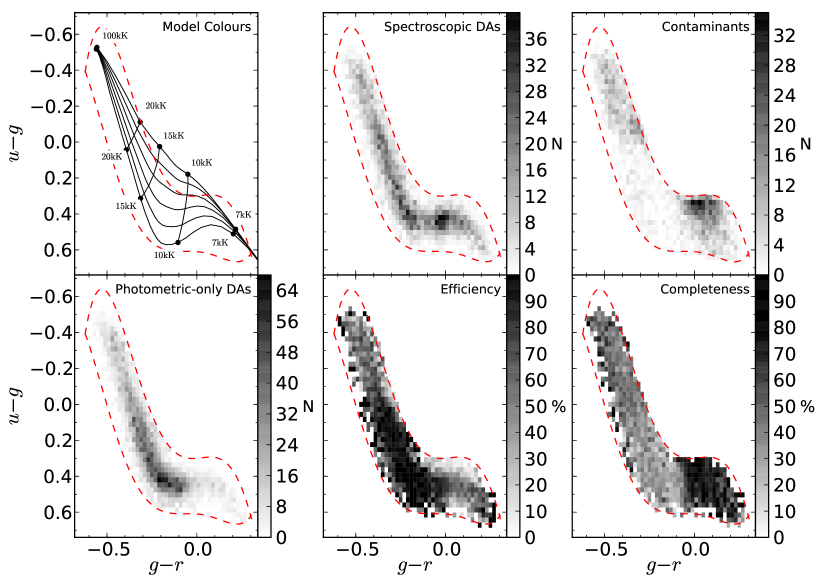
The sample produced here provides an excellent opportunity to investigate the spectroscopic completeness of SDSS for DA white dwarfs. We used the cuts in Table 1 to select both the spectroscopic and photometric objects within DR7. From these two sets of data, we then calculate the spectroscopic completeness within the colour-colour plane (Fig. 3). The upper middle and right panels display the density of spectroscopically confirmed DA white dwarfs (middle) and contaminants (such as NLHS and quasars, right hand side panel). For comparison, the upper left hand panel shows the DA white dwarf cooling tracks from Holberg & Bergeron (2006)111See http://www.astro.umontreal.ca/bergeron/CoolingModels for an updated grid.. The efficiency of our colour cuts is obtained for each bin within the plane as the ratio of the number of the DA white dwarfs to the total number of objects in the bin (lower centre panel). This clearly displays a reduced efficiency of selecting both the hottest and coldest white dwarf because of the increased numbers of contaminants. Our selection method however has an extremely high efficiency when selecting white dwarfs with temperatures between K. The number of DA white dwarfs without SDSS spectroscopy is predicted by scaling the number of photometric-only objects with the efficiency (resulting in the lower left panel). Finally, the DA white dwarf spectroscopic completeness was calculated as the ratio of spectroscopically confirmed DA white dwarfs to the total number of DA white dwarfs, with and without spectroscopy (lower right panel). The overall spectroscopic completeness is down to . As mentioned in Sect. 3.1, this analysis is limited to white dwarfs with K. The preference of SDSS spectroscopy to target quasars is clearly seen in the lower right corner of the spectroscopic completeness colour-colour diagram, where the vast majority of quasars lie. This corresponds to a very high spectroscopic completeness for cool DA white dwarfs. In contrast, the spectroscopic completeness for white dwarfs with K is significantly lower.
4 Cross-matching with UKIDSS
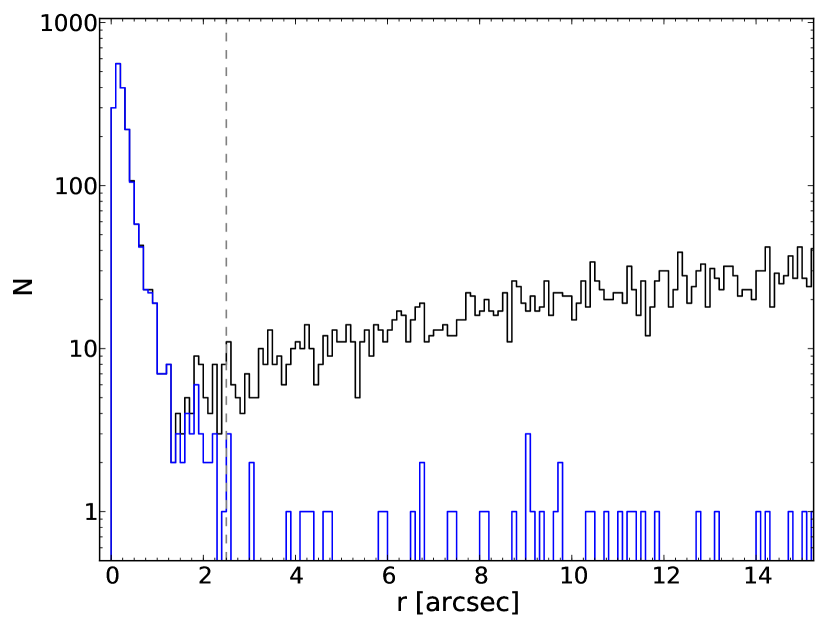
All (spectroscopic and photometric-only) objects from the DA selection in SDSS DR7 were matched with the UKIDSS database using the CrossID function. To decide upon a matching radius, a sample of 5000 randomly selected spectroscopically confirmed DA white dwarfs were matched to the UKIDSS database with a search radius . The distribution of the distance between the SDSS objects and the UKIDSS matches is shown in Fig. 4. The number of all possible matches within (black histogram) grows approximately as , as would be expect for chance coincidence, whereas true matches are primarily within . Selecting only the closest match (blue histogram), the majority of these random mismatches are removed. The blue and black distributions agree well at small distances (), indicating that crowding is not a major problem. is much larger than the quoted astrometric accuracies of both SDSS and UKIDSS (of order a few tenths of an arc second), but the large proper motions of the white dwarfs and the potentially large (few years) time interval between both surveys can lead to positional shifts up to a few arc seconds. We adopt for the final cross-matching of our spectroscopic and photometric-only SDSS DA samples with UKIDSS, which limits the number of spurious matches, and will exclude only a handful of (halo) objects with extremely high proper motions. Any remaining positional mismatches are flagged in the examination of the SDSS and UKIDSS images carried out later. We restrict our analysis to unresolved systems, as the physical association of spatially resolved companions to white dwarfs will be difficult to demonstrate with the available data. Consequently, objects that are flagged as partially resolved in the UKIDSS images are removed form the sample.
A total of 1990 of the SDSS objects with spectra were found to have at least one measured magnitude in the UKIDSS database. 1275 of these are spectroscopically confirmed DA white dwarfs. Similarly, 1771 of the photometric-only objects had at least one match in the UKIDSS database.
| Detections | Spectroscopic | Photometric |
|---|---|---|
| in band | Objects | Objects |
| Total SDSS | 7444 | 9341 |
| Any UKIDSS | 1990 | 1771 |
| 1815 | 1614 | |
| 1787 | 1549 | |
| 1503 | 1281 | |
| 1108 | 840 | |
| & | 1075 | 809 |
| , & | 979 | 720 |
5 Identifying infrared excess objects
5.1 DA White Dwarf Fitting
A grid of synthetic DA white dwarf spectra was calculated with the model atmosphere code described by Koester (2010) and using the latest line profiles of Tremblay & Bergeron (2009). These cover K in 131 steps nearly equidistant in , and in steps of dex.
5.1.1 Fitting the SDSS spectroscopy
We fitted the SDSS spectra of all DA white dwarfs found within our colour cuts (Table 1) following the method described in Rebassa-Mansergas et al. (2007). A minimisation is used to find a best fit from our grid of DA white dwarf model spectra, providing and . Using the cooling models of Holberg & Bergeron (2006), , and the distance can be calculated for each object.
5.1.2 Fitting the SDSS photometry
We also fitted all photometric objects found with our colour cuts, including all objects that do have SDSS spectroscopy. We also fitted objects known not to be DA white dwarfs, to allow us to investigate the properties of the contaminants among the photometric-only DA candidates.
Photometric objects were fitted by comparing the SDSS , , and magnitudes to the white dwarf model grid, again based upon a smallest . Model magnitudes were calculated for each of the and values by folding the theoretical spectra through the SDSS and UKIDSS filter curves. Magnitudes redder than were not included since we are searching for composite systems. This ensures we can recognise objects with an excess already showing in , such as white dwarf plus M-dwarf binaries. This does not significantly affect the spectroscopic fitting method because we fit line profiles. This method is most sensitive at shorter wavelengths, where the companion does not significant contribute. For the majority of photometric DA candidates, the 4-band photometry did not provide sufficient constraints to accurately determine the surface gravity. For objects with calculated effective temperatures in the range K, where the spectral line widths are narrow and therefore do not significantly affect the SED, we adopted a canonical value of for those objects.
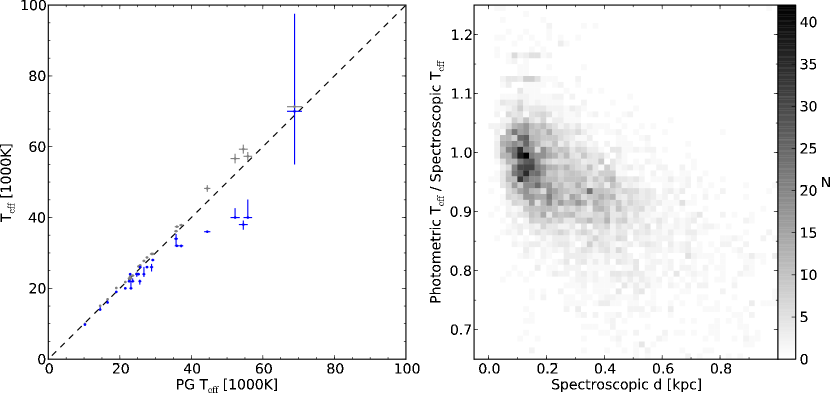
The temperatures measured from the SDSS photometry were found to be systematically lower than those from the fitting of line profiles (e.g. Table 10; objects with SDSS spectroscopy, but fitted with the photometric method). Our sample of SDSS white dwarfs overlaps with the Palomar Green (PG) sample, and Fig. 7 shows a comparison between our spectroscopic and photometric temperatures with those of Liebert et al. (2005), which were determined from independent data, spectral models, and fitting routines. We find good agreement between the results of Liebert et al. (2005) and our spectroscopic method. However, our photometric temperatures are systematically too low, a trend that is strongly correlated with either white dwarf temperature or distance. At 200pc (500pc), the photometric temperatures are on average () below our and Liebert’s spectroscopic values. This could suggest that interstellar reddening is, at least in part, the culprit for reduced temperatures. While reddening would not significantly effect the shape of the line profiles, it could noticeably change the slope of the continuum (see also Holberg et al. 2008). No clear correlation is, however, seen when comparing the mismatch in temperatures to the Schlegel et al. (1998) values of at the positions of the white dwarfs. The Schlegel et al. maps probe interstellar reddening through the entire Galaxy, whereas the white dwarfs in our sample lie at a few hundred parsecs at most. Typical (total Schlegel) reddening along the lines-of-sight towards our white dwarfs is . De-reddening the SDSS photometry with that total , and re-fitting the photometric white dwarf sample indeed leads, as expected, to a large over-correction of the white dwarf temperatures. Analysing the sample of spectroscopic DAs, we estimate that the typical reddening in front of the white dwarfs is . However, we can not systematically correct for the effect of reddening for the sample of photometric-only DA candidates. We note that for hot white dwarfs, K, non-LTE effects become important, which may also lead to some systematic differences in the fit parameter for the hottest stars in our sample. Therefore, the temperatures calculated from the photometry alone have an additional systematic uncertainty, on top of the statistical uncertainty from the fit, and the true temperatures are likely to be a few thousand Kelvin higher. In the context of our search for infrared flux excess (Sect. 5.2 below), changing the white dwarf temperature by a few thousand Kelvin does not have a significant impact on the level of excess detected (see Sect. 6 for examples).
5.2 IR Excess Detection
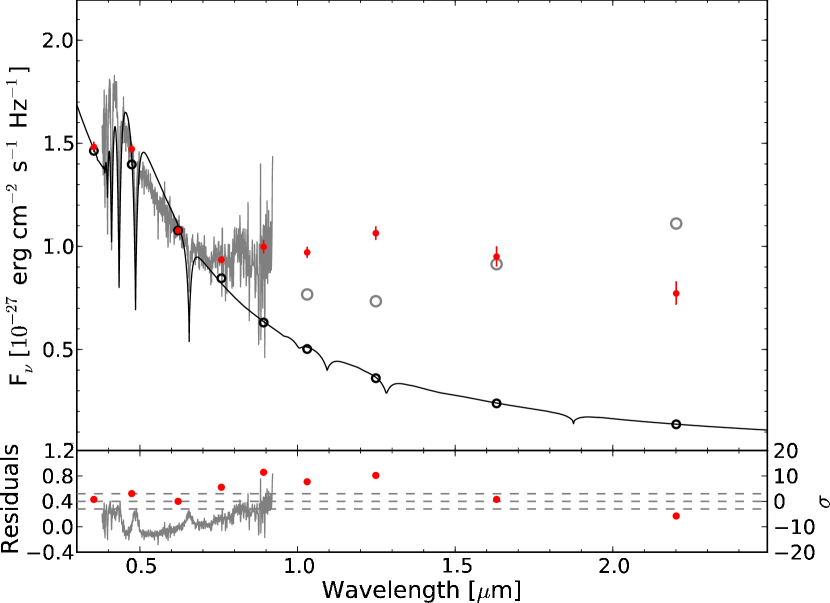
In both the spectroscopic and photometric fitting methods, the best fit model extends into the IR and all objects with UKIDSS data were examined for an excess by comparing the IR white dwarf model flux with the observed magnitudes. Objects with a excess in any band over the white dwarf model were defined as a robust excess candidate (“DAire” and “DA:ire” for the spectroscopically confirmed DAs and the photometric-only DA candidates, see Tables DA white dwarfs in SDSS DR7 and a search for infrared excess emission, 8 and 10). Further to this, objects that appeared to have a best fit model which over-estimated the flux in , and , but showed only a excess in were also flagged as tentative excess candidates (“DAire:” and “DA:ire:”, as above, Tables DA white dwarfs in SDSS DR7 and a search for infrared excess emission, 8 and 10), see Fig. 5 for an example. Further IR data is definitely needed to confirm these marginal IR excess candidates. Similarly, spectroscopically confirmed DAs (photometric DA candidates) with close to excess that by eye require further data to confirm the excess were also marked as “DAire:” (“DA:ire:”). For the photometric-only objects the uncertainty on the model parameters is generally larger compared to the spectroscopically confirmed DAs. This was accounted for by not flagging objects with a marginal IR excess and a large uncertainty on effective temperature as excess candidates.
Spurious excesses were often caused by spatially close background or foreground objects to the white dwarf and bad SDSS or UKIDSS images. We visually inspected all flagged sources and discounted resolved and partially resolved systems because the physical association of the two objects could not be demonstrated based on the available data.
A total of 42 white dwarfs were found to have an excess from the spectroscopic fitting method, and 105 infrared excess candidates were found from the photometric fitting method (Table 4). The excesses have a variety of spectral shapes, generally consistent with various spectral type companions. Table DA white dwarfs in SDSS DR7 and a search for infrared excess emission and 8 list all the spectroscopic and photometric IR excess candidates, respectively.
5.3 IR Excess Modelling
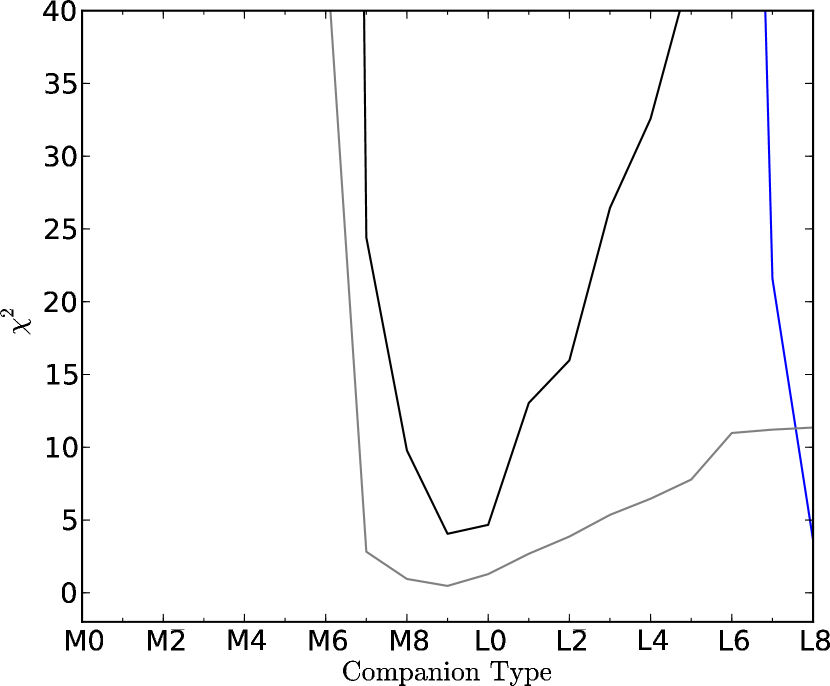
The magnitudes of objects that were found to exhibit an infrared excess were fitted with a composite model consisting of the best-fit white dwarf plus a set of low-mass companions with spectral types M0 through to L8. We used the 2MASS magnitudes of Hoard et al. (2007), which we converted into the UKIDSS filter system adopting the equations given in Dye et al. (2006). Hoard et al.’s absolute magnitudes of the low-mass companions were scaled to apparent magnitudes using the distance modulus calculated from the white dwarf fit. For photometrically fitted objects, the white dwarf distance modulus was calculated as an average of the difference between the best-fit absolute magnitudes and the SDSS apparent magnitudes in each of the , , and bands. Finally, the model magnitudes of the composite system were computed from the combined white dwarf and companion star fluxes. The best composite fit to the IR photometry was calculated using a least search and subsequently confirmed by visual inspection. Fig 8 shows reduced as a function of companion type for three white dwarfs with well constrained companions using the photometric method as an example. It was seen that a white dwarf with a good fit to the companion has a reduced , an example of a the corresponding SED is shown in Fig. 6. Composite fits with were flagged as “bad fits” and flagged as DAire: or DA:ire in Table DA white dwarfs in SDSS DR7 and a search for infrared excess emission and 8, respectively, as the nature of the IR excess remains somewhat unclear (see Fig. 9 and Sect. 5.4.1). Finally, QSOs stand out because of their very high , (e.g. Fig. 10). A summary of companion types for each method is given in Table 4.
| Spectroscopic | Spectroscopic using | Photometric | |||||||
| Photometric Method | |||||||||
| Primary Type | DA | DA | NLHS | WDMS | DAH | QSO | Total | - | |
| Companion Type | w SIRE | wo SIRE | |||||||
| M-type | 16 | 9 | 1 | 10 | 2 | 0 | 0 | 22 | 15 |
| L-type | 19 | 11 | 0 | 12 | 1 | 0 | 0 | 24 | 19 |
| or disc | 7 | 6 | 2 | 0 | 0 | 0 | 0 | 8 | 4 |
| QSO | - | 0 | 0 | 0 | 0 | 0 | 323 | 323 | 40 |
| Bad fit | 0 | 4 | 3 | 9 | 1 | 3 | 0 | 20 | 27 |
| No Phot IR Excess | - | 12 | - | - | - | - | - | 12 | - |
| 42 | 42 | 6 | 31 | 4 | 3 | 323 | 409 | 105 | |
5.4 Comparison of the spectroscopic and photometric methods
The results from using either the spectroscopic or purely photometric methods to find IR excess can be directly compared because all the objects with SDSS spectra also have SDSS photometry. We discuss in the following sub-sections how well the spectroscopic and photometric method compares for genuine DA white dwarfs (Sect. 5.4.1), what can be learned from the spectroscopic contaminants that show an IR excess when fitted with the photometric method (Sect. 5.4.2, 5.4.3), and how additional information such as IR colours and proper motion could be used to suppress contaminants in the photometric-only sample (Sect. 5.4.2).
5.4.1 DA White Dwarfs
Of the 42 spectroscopic DA white dwarf IR excess candidates, 30 () are recovered by the photometric fitting method as well (column “DA w SIRE” in Table 4, 9 M-type, 11 L-type, 6 -type companions/debris discs and 4 “bad fits”, which are marked as “DAire:” in Table 8), and 12 do not show an excess when using the photometric method. These 12 objects are close to the limit in the spectroscopic method and were not recovered. They were not recovered by the photometric method because of the larger uncertainty on effective temperature leading to the excesses being within the combined model and flux errors. 6 objects with DA white dwarf SDSS spectra are found to have an IR excess in the photometric method, but do not exhibit an IR excess when using the spectroscopic method (column “DA wo SIRE” in Table 4). Three of these have excesses which are accentuated by a slightly hotter photometric fit compared to the spectroscopic one. They fall just outside the criteria (Section 5.2) for having an excess in the spectroscopic method. For the other three objects the SDSS spectra are too poor to obtain reliable and measurements from fitting their Balmer lines. Therefore an excess was not recognised in the spectroscopic method. However, the photometric data were good enough and thus these three objects are classified as photometric IR excess candidates. We may therefore expect (3/36–6/36) spurious IR excess candidates from the photometric method. All objects that display an infrared excess either in the spectroscopic, or the photometric method, and have an SDSS spectrum are listed in Table 10.
Table 4 also lists the IR excess candidates split by modelled companion type. Among the 30 objects which are defined as IR excess candidates in both methods, the distribution of companion type has a similar form. of the companions have M or early L spectral types (split evenly between the two classes), and the remaining have companions , i.e. brown dwarf or debris disc candidates.
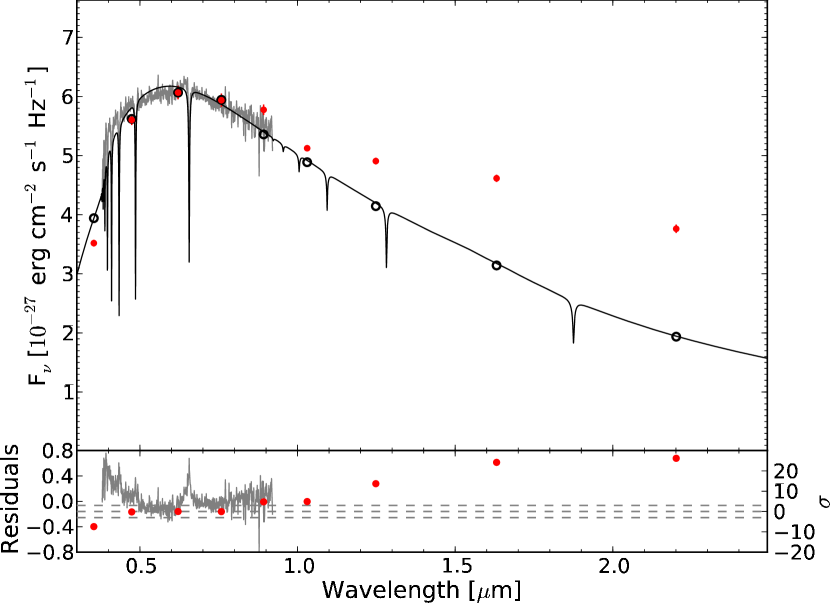
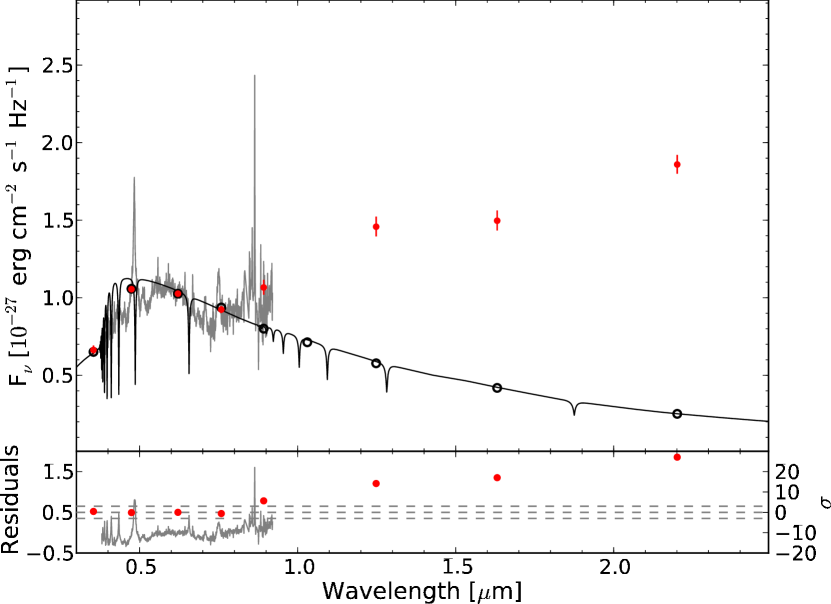
As briefly outlined in Sect. 5.1, the temperatures resulting from the photometric fits are systematically too low, and this will introduce a bias in the spectral type of the companion. The flatter SED of a cooler white dwarf will reduce/distort the IR flux excess relative to the white dwarf, and therefore a later type companion will provide sufficient flux to account for the excess. An additional effect is that a cooler white dwarf will suggest a lower distance when fitting the magnitudes. Underestimating the distance will lead to an overestimate of the absolute flux of the companion. To compensate for this, the fit to the companion will resort to a companion with a larger absolute magnitude, i.e. lead to a companion spectral type that is too late. A moderately extreme example of these effects is shown in Fig. 9 (SDSS J1619+2533, see Table 10). Assuming that the spectroscopic fit parameters are correct, the white dwarf temperature is underestimated by K, which leads to an L6 companion in the photometric method, as opposed to an M6 companion resulting from the spectroscopic analysis. This object is marked in the notes column as having a bad fit to the companion in the photometric method, where a “bad fit” is defined as an object having an excess which is inconsistent with any companion type (at the photometric white dwarf distance).
5.4.2 Quasar Elimination
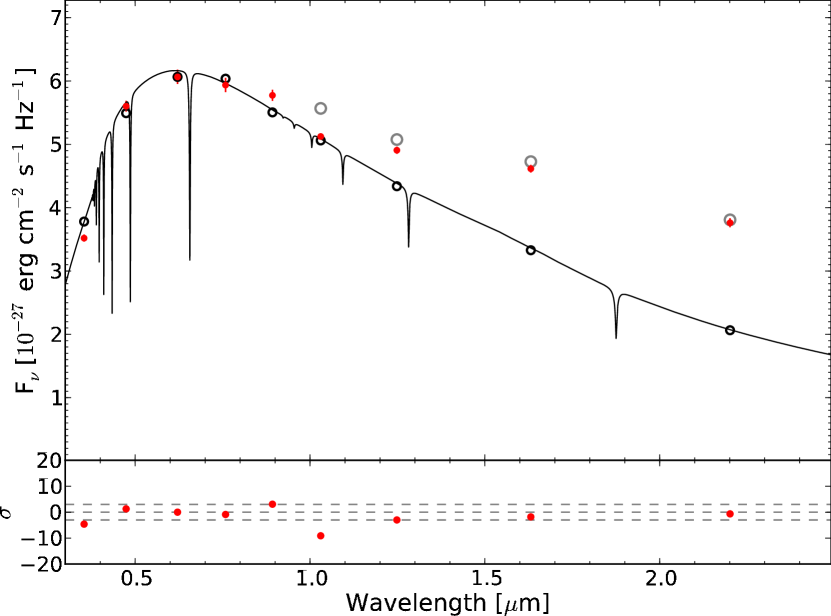
As can be seen in Table 4, a significant fraction (323) of the IR excess candidates from the photometric method with spectra are quasars. This is almost the entire population of spectroscopically confirmed quasars in the DA white dwarf sample with UKIDSS magnitudes. The remaining 5 quasars do not have sufficient IR data to show their quasar nature, but equally are not flagged as IR excess candidates. This is caused by the flat SED exhibited by QSOs (Covey et al., 2007). When modelled with a DA white dwarf, they generally have an effective temperature of K and have an IR excess that is much higher than physically possible for an M-dwarf or brown dwarf companion at the distance of the (photometric) DA fit (e.g. Fig. 10). Because of the (apparent) low effective temperatures, the quasars also generally have low (apparent) distances. These properties, however, overlap with those of genuine cool nearby white dwarfs and cannot be used to directly distinguish between white dwarfs and quasar. Another common sign of QSOs are large jumps in brightness between adjacent magnitudes (caused by emission lines) that are not seen in any of the genuine DA white dwarfs with infrared excess. Given that we correctly classified, on the base of their optical-IR SED, of (spectroscopic) quasars contaminants that were found as DA:ire by the photometric method, we are confident that we can identify the vast majority of quasars among the photometric-only sample.
Among the photometric-only sample of IR excess candidates, we find 38 objects whose SEDs are very similar to those of our 323-strong spectroscopicially confirmed quasar sample and which we therefore believe to be quasars as well. Optical spectroscopy is needed to confirm their nature. These have been removed from Table 8 and can be found in the online QSO tables available via CDS.
5.4.3 Contamination by NLHS and Non-DA White Dwarfs
Contaminant NLHS and non-DA white dwarfs are more difficult to identify and remove from the photometric-only DA candidate sample, as their overall SEDs are all rather similar. Closer inspection of the SDSS spectroscopy of the NLHS and cross-checking them in Simbad suggests that a large fraction of them are subdwarf B (sdB) stars. The bulk of subdwarfs are believed to have formed in binary interactions (Han et al., 2003; Heber, 2009) and therefore it is expected that a large majority will still have companions. Such companions would cause an IR flux excess over the Rayleigh-Jeans tail of the subdwarf, and it is hence likely that our photometric-only sample of candidate DA white dwarfs with infrared excess contains a significant contamination from sdB plus low-mass companion binaries.
Given that we fit all photometric objects with DA model spectra, we may expect some imperfections in the fits to the photometric NLHS objects. Nevertheless, the detection of a near-IR flux excess over the Rayleigh-Jeans tail of the model is likely to be correct for many of the NLHS objects among the photometric sample. However, a DA fit to the photometry of a physically much larger NLHS object will dramatically underestimate its radius, and hence its distance. Consequently, fitting the companion with the composite model (Sect. 5.3) will result in a spectral type of the companion that is much too late.
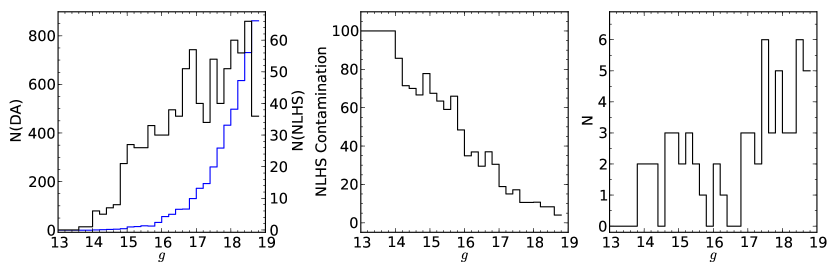
From the spectroscopic sample, we find that the frequency of NLHS inside the DA colour selection (Table 1, Fig. 2) is (Table 2), however the level of contamination is strongly magnitude-dependent. Figure 11 (left) shows the distribution of NLHS and DA white dwarfs as a function of -band magnitude. The ratio of these two, and thus the expected level of contamination of the photometric-only sample, is shown in the middle panel (this assumes that the majority of quasar have been removed because of the characteristic shape of their SED). The contamination of the photometric-only DA candidate sample by NLHS drops significantly towards fainter magnitudes. Subdwarfs are times brighter than white dwarfs and therefore apparent magnitudes of sample distances of many kpc. This is several times the exponential scale height of the Galactic thick-disc population, and hence the number of sdBs at such large distances is relatively small. Figure 11 (right panel) shows the photometric-only IR excess candidates as a function of magnitude, where we can assume that most objects with are likely to be NLHS.
An additional clue on the NLHS vs DA classification of the photometric-only objects comes from their location in the colour-colour diagram (Fig. 12, bottom right panel), where the majority of the spectroscopically confirmed NLHS objects are concentrated at the blue end of the “DA” banana. We can therefore assume that NLHS are the primary contaminants of the photometric sample in this region as well (Fig. 12, top right panel).
Assuming that the distribution of NLHS contaminants is similar between the spectroscopic and photometric-only sample, we expect of the 1771 photometric objects to be NLHS. When fitting the photometric sample, 31 () spectroscopically confirmed NLHS were found to have an IR excess (red dots in the bottom right panel of Fig. 12). Again, assuming that the contamination among the spectroscopic and photometric samples is similar, we would expect that (12% of 259) of our photometric DA candidates with infrared excess (DA:ire and DA:ire:) are in reality NLHS, primarily sdB stars with main sequence companions. These are still interesting in their own right (e.g. Sect. 6.3.2), but not the primary focus of the IR excess search (a detailed investigation of subdwarfs with main-sequence star companions will be published elsewhere, Girven et al. (2011, in prep).
In contrast to the above discussion on NLHS, fitting non-DA white dwarfs with DA white dwarf models is likely to provide a reasonably good estimate of all system parameters, including the companion type – the downside being that on the base of photometry only, it is nearly impossible to differentiate between DA and non-DA white dwarfs. However, based on the statistics of the Eisenstein et al. (2006), we only expect a small level of contamination by non-DA white dwarfs (Table 2).
5.4.4 Independent checks: proper motions and infrared colours
Our method of identifying infrared excess candidates follows Tremblay & Bergeron (2007), i.e. fitting model spectra to SDSS spectroscopy and photometry. In this section, we carry out an independent investigation of our sample using colour-colour diagrams, such as previously explored by e.g. Wachter et al. (2003) and Hoard et al. (2007), and test our classification of the photometric-only systems by making use of proper motions.
Figure 13 shows the distribution of the spectroscopic SDSS/UKIDSS sample in the colour-colour space (left panel). Using model white dwarf colours, it can be seen that the DA cooling sequence runs from top left to bottom right through the white dwarf group. The NLHS and DA white dwarfs are clearly separated from the quasars, which can be understood as stars are on the Rayleigh-Jeans tail in the infrared, whereas quasar follow a flatter power law (Covey et al., 2007). Therefore, as an additional test of how reliable our classification of the photometric-only quasar candidates works, we inspected the infrared colours of the photometric-only sample. Choosing an empirical cut of selects 89.6% of the quasar contaminants in the spectroscopic sample. Adopting the same cut for the photometric-only sample flags 38 objects as quasar candidates. This includes 31 of the 38 photometric-only objects identified as quasar candidates on the base of their SED (Sect. 5.4.2 (see online QSO table), of which only 37 have both and measurements). In addition, two of the selected QSO candidates correspond to the two “weak” photometric-only quasar candidates listed in Table 8.
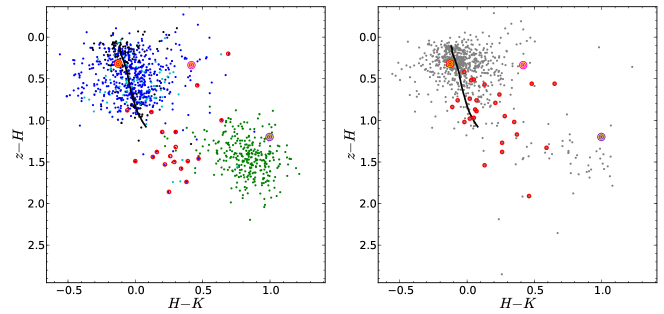
A third concentration of objects can be seen in Fig. 13 in the region between the DA white dwarfs and the quasars, a significant fraction of which are DA infrared excess candidates. The presence of an infrared excess over the stellar flux distribution results in a flatter spectral slope, and hence moves these objects closer to the quasar locus. On closer inspection, some white dwarfs in this region are found to be blended sources or suffer from background contamination from a nearby galaxy and therefore were not included as infrared excess candidates.
In summary, adopting would efficiently remove the bulk of contaminating quasars from the photometric-only sample, however, such a cut would also remove a handful of genuine white dwarfs with the largest infrared excess emission (such as e.g. SDSS J1228+1040, see Sect. 6.1.1).
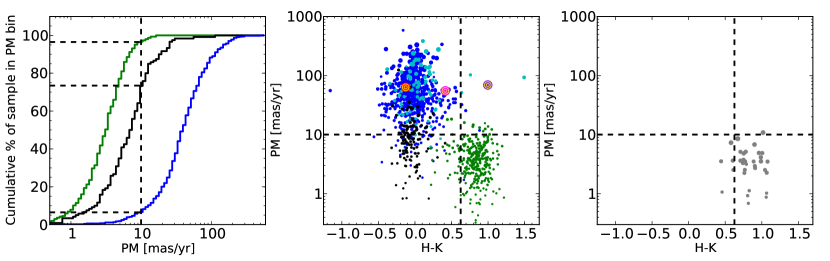
Given that white dwarfs are nearby low-luminosity objects, they are expected to exhibit larger proper motions than the more luminous NLHS, and quasars are not expected to show any significant proper motion at all. Thus, proper motions can be used to distinguish between white dwarfs and quasars in the region with . We have retrieved proper motions from DR7 for all objects in the SDSS/UKIDSS sample. Figure 14 (left panel) shows a cumulative proper motion distribution for the white dwarfs, quasars and NLHSs. Based upon this, we chose a cut in proper motion of mas/yr to define low proper motion objects such as quasars. In the spectroscopic sample, this cut selects , and of the DA white dwarfs, NLHS and quasar respectively, efficiently eliminating the majority of the quasar without removing too many white dwarfs.
Figure 14 (middle panel) plots the magnitude of the proper motion as a function of . The statistical significance of the proper motion is encoded in the size of the points, where larger points denote more significant proper motions. As expected, the spectroscopically objects classified as NLHS stars and quasars show very small proper motions, which are in most cases consistent with zero. The right hand side panel of Fig. 14 shows the location of 35 photometric-only objects classified as quasar because of the characteristic shape of their SEDs (see online QSO table) that have both colours and proper motions. The vast majority of these objects are contained within and mas/yr, corroborating our SED-based classification.
A small number of objects with , i.e. within the “quasar” region, display large and statistically significant proper motions (Fig. 14, middle panel). These are listed in Table 5. Among those objects are three spectroscopically confirmed DA white dwarfs. At closer inspection, the UKIDSS magnitudes of SDSS J1244+0402 may be contaminated by a nearby background object, which would lead to a spurious colour. The other two spectroscopic DA white dwarfs, SDSS J0753+2447 and SDSS J1557+0916 have very red colours and high proper motions. They are therefore excellent IR excess candidates. Applying the same procedure to the photometric-only DA candidate sample, SDSS J09590200 is the strongest infrared excess candidate among the three photometric-only objects. SDSS J1440+1223 and SDSS J1509+0539 also appear to suffer from background contamination.
Another four spectroscopic objects with quasar-like IR colours and high proper motions are classified as three magnetic white dwarfs (DAH) and one DZ white dwarf. We would expect that the IR spectra of all of these objects should be close to a Rayleigh-Jeans distribution, suggesting that the inferred IR excess is probably real. In fact, one of the DAH, SDSS J1212+0136 is a well-studied DAH plus brown dwarf binary (Schmidt et al., 2005), which exhibits a genuine infrared excess (Debes et al., 2006) (see Sect. 6.1.3). As discussed in the introduction, the metals seen in DAZ white dwarf atmospheres are from recent or ongoing accretion (e.g. Dupuis et al., 1993; Koester & Wilken, 2006). The same is true for cool DZ white dwarfs (e.g. Aannestad et al., 1993), and Farihi et al. (2010) discuss the potential connection between the large number of DZ white dwarfs, and the DAZ white dwarfs with dusty debris discs thought to originate from the tidal disruption of rocky asteroids. The DZ found here, SDSS J1342+0522, exhibits a very red colour. The excess in over the model spectrum is slightly under and therefore is, in our classification scheme, only a marginal candidate for having an IR excess. This DZ white dwarf and the two new DAH white dwarfs IR excess candidates warrant further investigation.
Finally, eight quasars have statistically significant proper motions (; see Table 5), which highlights the fact that the SDSS vs USNO-B proper motions have to be considered with a pinch of salt: among a total of 328 quasars with SDSS spectra and UKIDSS data, we would expect only one to have a significant proper motion, and none at .
We conclude that dissecting the white dwarf sample selected with our constraint set (Table 1) using colour-colour diagrams and proper motions leads to mutually consistent results when compared to our primary methodology (Sect. 5.1- 5.3), but the spectroscopic modelling provides an additional wealth of information.
| Name | p.m. (mas/yr) | Class | Comment | ||
|---|---|---|---|---|---|
| 0043+0005 | QSO | ||||
| 0753+2447 | DA | ||||
| 0858+0938 | QSO | ||||
| 0959-0200 | - | ||||
| 1031+0341 | QSO | ||||
| 1142+1347 | QSO | ||||
| 1212+0136 | DAH | ||||
| 1244+0402 | DA | BG object | |||
| 1250+1549 | DAH | ||||
| 1342+0522 | DZ | ||||
| 1427-0054 | QSO | ||||
| 1440+1223 | - | BG object | |||
| 1443+0910 | QSO | ||||
| 1509+0539 | - | BG object | |||
| 1514+0744 | DAH | ||||
| 1553+0718 | QSO | ||||
| 1557+0916 | DA | ||||
| 1557+2646 | QSO |
5.5 Overall Numbers
A summary of the numbers of objects at each stage of the analysis is given in Table 6. The total numbers of white dwarfs with near-IR excess are broken down according to the spectral type of their companions in Table 4.
We find that (42 of 1275) of the SDSS spectroscopically confirmed DA white dwarfs with at least one of the UKIDSS magnitudes have an IR excess and are therefore candidates for having a companion or a debris disc. However, this does not take account of the fact that the sample of white dwarfs is incomplete even within UKIDSS DR8 because for many only subsets of the IR magnitudes are available. Thus we are limited by UKIDSS coverage and the real number is higher. of the spectroscopic DA white dwarfs are candidates for having a companion of type L0 or later, i.e. have brown dwarf companions. Similarly, are promising disc candidates, having an excess compatible with a companion type of L7 or later. If we only discuss the objects with a detection in the K-band (required for detecting a disk), are disk candidates, and only including objects where we are confident of the IR excess (not “DAire:” in Table DA white dwarfs in SDSS DR7 and a search for infrared excess emission; see Section 5.2 and 5.3), a lower limit of of DA white dwarfs have a brown dwarf companion.
For the photometric-only sample, where we have fitted the SDSS and UKIDSS photometry, are IR excess candidates. However, this number will be affected by the efficiency of white dwarf selection (62.3%) and the efficiency of removing contaminants. Assuming that we remove all the obvious photometric-only quasar contaminants (38, see online QSO table) from the IR excess objects, the remaining 67 photometric-only IR excess candidates will be either DA white dwarfs or NLHS. As discussed previously, we estimate that of these are NLHS (Section 5.4.3). This number is very similar to the amount of “bad fits” found in from the photometric method and so we believe the majority of “bad fits” come about from NLHS contaminants in the photometric-only sample. Therefore, we expect ( of ) genuine DA white dwarfs with IR excess among the photometric-only DA white dwarf candidates. These infrared excess candidates show a similar distribution in companion type when compared to the spectroscopic sample. Considering only the objects we are confident of the excess (not “DA:ire:” in Table 8; see Section 5.2 and 5.3), (19) of the photometric-only DA white dwarfs candidates are likely to have a brown dwarf companion.
| Constraint | Spectroscopic | Photometric-only |
| Objects | Objects | |
| Objects Satisfying SDSS | ||
| Colour Cuts | 7444 | 9341 |
| Spectroscopically Confirmed | ||
| DA white dwarfs | 4636 | |
| QSO | 1280 | |
| NLHS | 840 | |
| Other white dwarfs | 661 | |
| Other Objects | 27 | |
| Objects cross matched with | ||
| UKIDSS with detection in | ||
| any of , , or | 1990 | 1771 |
| Spectroscopically Confirmed | ||
| DA white dwarfs | 1275 | |
| QSO | 328 | |
| NLHS | 209 | |
| Other white dwarfs | 172 | |
| Other Objects | 6 | |
| Objects with Detections in | ||
| & | 1075 | 809 |
| 1108 | 840 | |
| Spectroscopically Confirmed | ||
| DA white dwarfs | 571 | |
| QSO | 316 | |
| NLHS | 124 | |
| Other white dwarfs | 94 | |
| Other Objects | 3 | |
| IR Excess Objects | 42 | 105 |
6 Notes on individual Objects
Some objects of particular interest identified in the SDSS / UKIDSS cross-correlation are discussed below. We separate those into objects already known to host a disc or companion (Section 6.1), notable objects from the spectroscopic sample (Section 6.2), and the same from the photometric-only sample (Section 6.3).
6.1 Prototypical White Dwarfs
Our spectroscopic sample contains two white dwarfs that were known to host debris discs and one magnetic white dwarf with a substellar companion, and they serve hence as a benchmark for our selection procedures.
6.1.1 SDSS J1228+1040
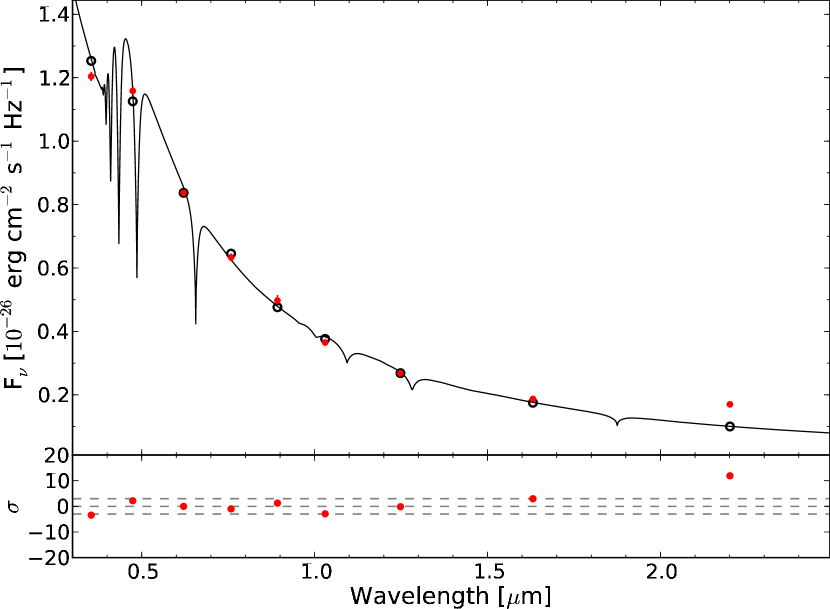
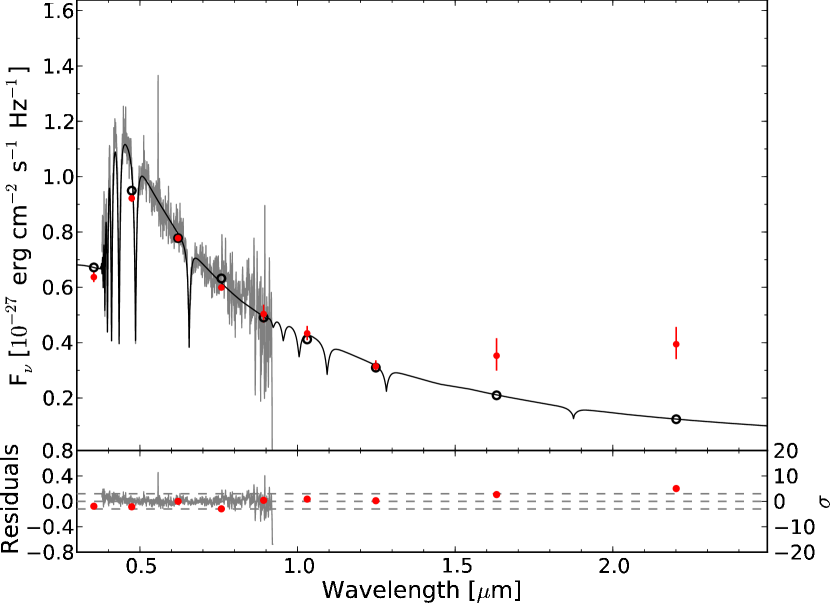
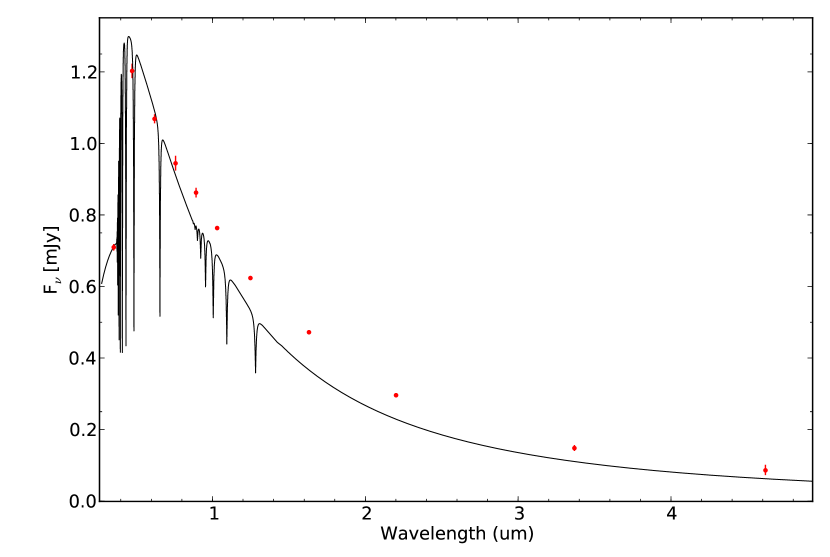
SDSS J1228+1040 is one of two DA white dwarfs in our SDSS/UKIDSS sample known to have a debris disc. The disc was initially identified because of the highly unusual emission lines of the Ca II 8200 Å triplet (Gänsicke et al., 2006b), whose double-peaked shaped can only be explained by metal-rich gas orbiting the white dwarf within its tidal disruption radius (Gänsicke et al., 2006b). Near- and mid-IR observations revealed a substantial infrared excess over the white dwarf, unambiguously identifying a dusty component of the debris disc, in addition to the gaseous one (Brinkworth et al., 2009). Our fits to the SDSS spectroscopy and photometry are shown in Fig. 15. The two fits differ in by 2000 K. However, this has very little effect on the extrapolated infrared magnitudes of the white dwarf, and the object shows a excess in and in , independent of the method used for fitting. At the temperature of SDSS J1228+1040, is not well constrained from fitting the photometry alone, however, this primarily effects the widths of the hydrogen lines, and has a negligible effect on the spectral slope of the white dwarf model. This demonstrates that the detection of a genuine infrared excess is robust and independent of whether an optical spectrum is available.
Taking the infrared measurements at face value and ignoring our knowledge about this star, we have modelled the SDSS/UKIDSS spectral energy distribution as a white dwarf plus low-mass companion, which results in a most likely spectral type of L6 for the companion. Based on the SDSS/UKIDSS data alone, it is impossible to distinguish between a low-mass companion and a dusty disc, but mid-infrared data data can break this degeneracy. We therefore classify infrared excess candidates that require a companion later than L7–8 as brown dwarf / dusty debris disc candidates
SDSS J1228+1040 exhibits a very red colour in the ) colour-colour diagram shown in Fig. 13, where it is clearly separated from the white dwarf model sequence. This region of the colour-colour space is therefore likely to harbour white dwarfs with a strong -band excess. A significant number of the IR excess candidates in Sect. 5.2 also lie in this region, as well as somewhat below (corresponding to a and -band excess). SDSS J1228+1040 is also prominent in Fig. 14 thanks to its relatively high proper motion and red colour. In summary, it is encouraging that this benchmark system indeed stands out in the various diagnostics we have considered.
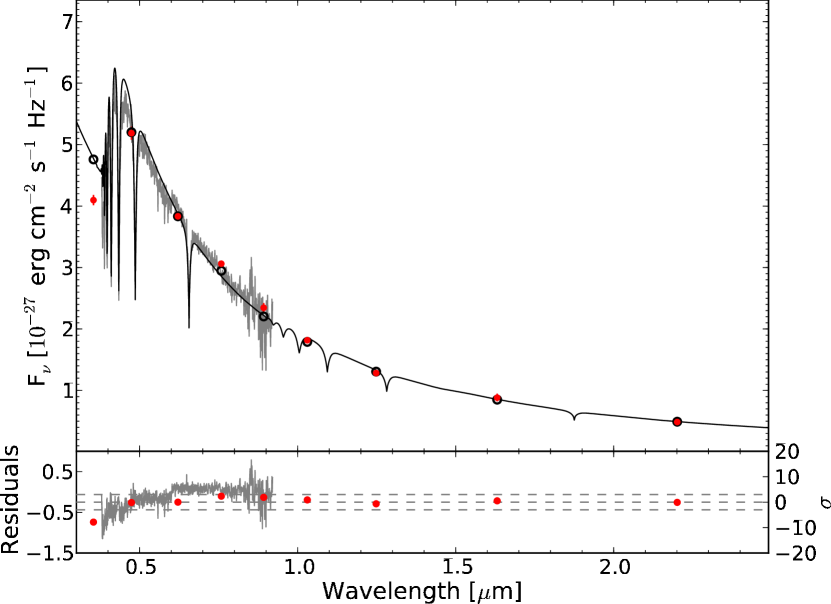
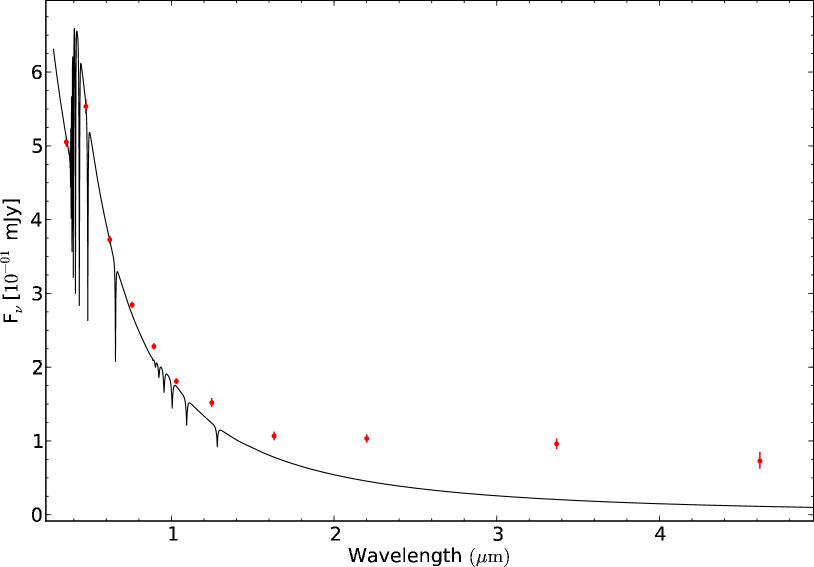
6.1.2 SDSS J1043+0855
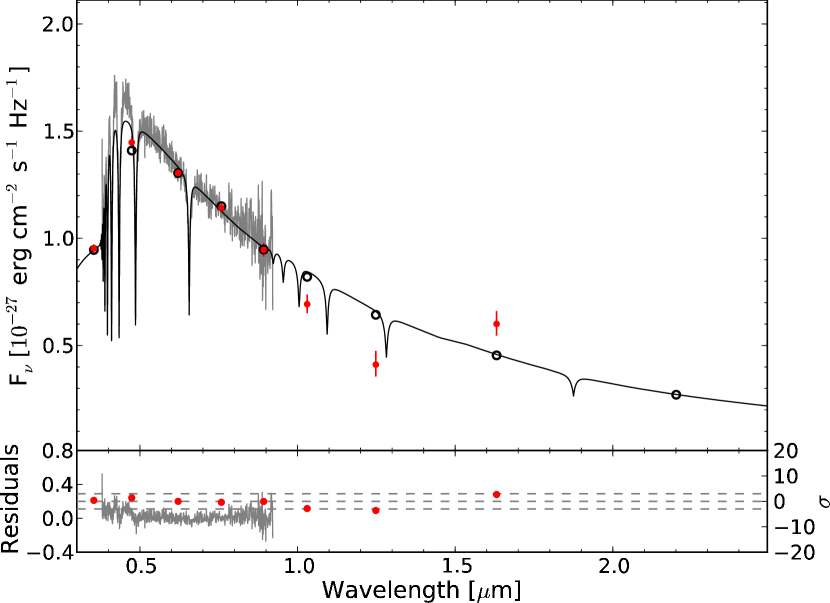
SDSS J1043+0855 is the second white dwarf in our sample known to have a gaseous debris disc (Gänsicke et al., 2007), though the evidence for an infrared excess in the near- and mid-IR is marginal (Melis et al., 2010, Brinkworth et al. 2011, in prep.). Based on the published results on this object, we would not expect to detect any excess in the UKIDSS photometry. In our analysis of the SDSS spectrum, we find K and , consistent within the errors with the parameters in Gänsicke et al. (2007). The corresponding model is an excellent fit to both the SDSS and UKIDSS photometry, with no detection of an IR excess in any of the near-IR bands (Fig. 16). Adopting the flux from Melis et al. (2010) rather than the UKIDSS measurement gives a excess above our model, which would again not classify as an IR excess candidate within our classification scheme (Sect. 5.2). This conclusion is confirmed by the fact that SDSS J1043+0855 falls very close to the model white dwarf sequence in Fig. 13. This system is an example where there either is no dusty disc, or where the dusty disc is too faint, e.g. edge-on, to be detected in the near-IR.
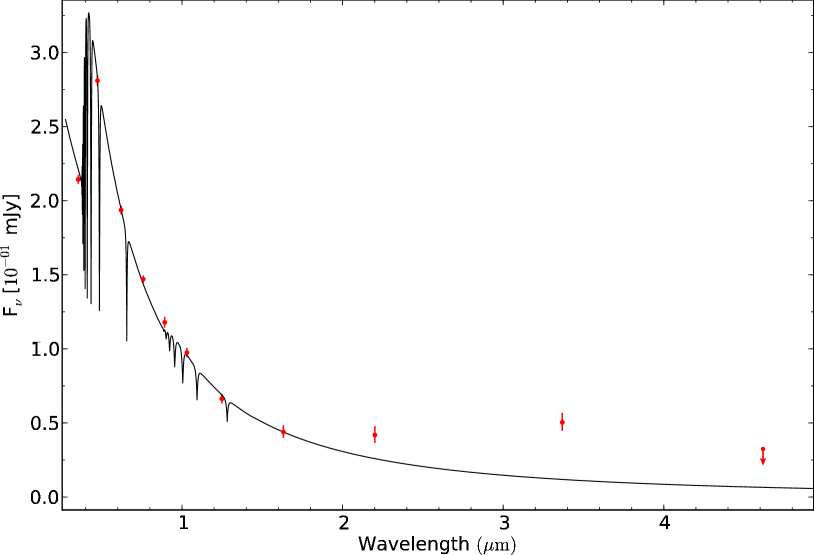
6.1.3 SDSS J1212+0136
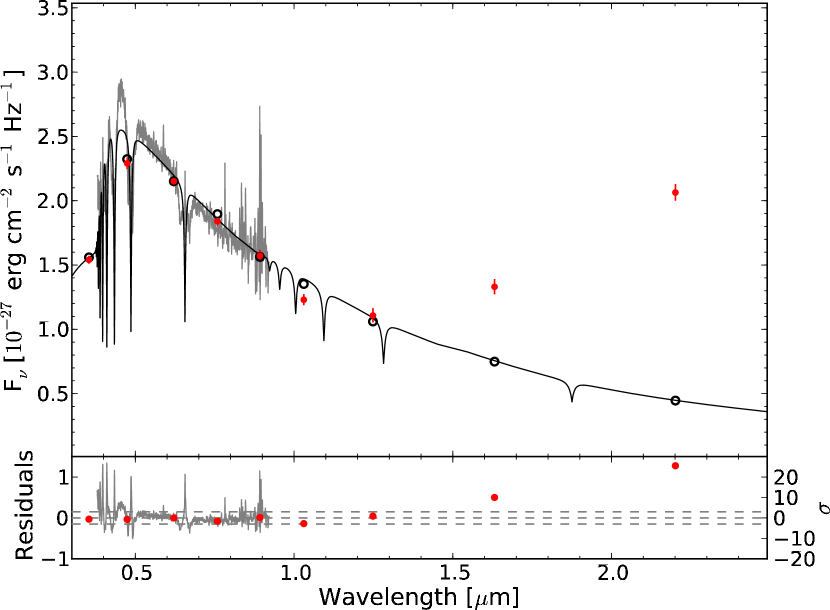
SDSS J1212+0136 is one of three magnetic (DAH) white dwarfs that were selected by our colour cut (Table 1) and that, when fitting their photometry, show a substantial IR flux excess (Fig. 17, Sect. 5.4.3). This white dwarf was first reported to have a magnetic field of MG by Schmidt et al. (2003). Schmidt et al. (2005) subsequently detected a weak H emission line, from which they measured an orbital period of min. Based on the band magnitude of SDSSJ1212+0136, Schmidt et al. (2005) concluded that the companion to the white dwarf is a brown dwarf. Additional studies in the near-IR confirmed the brown dwarf to have a spectral type in the range L5–L8, and detected variable cyclotron emission, indicative of ongoing accretion onto the magnetic white dwarf (Debes et al., 2006; Farihi et al., 2008; Howell et al., 2008). Observations at blue and ultraviolet wavelengths show a quasi-sinusoidal flux modulation interpreted as emission from an accretion-heated polecap (Burleigh et al., 2006; Linnell et al., 2010) which is typical of strongly magnetic cataclysmic variables (Gänsicke et al., 1995; Araujo-Betancor et al., 2005; Gänsicke et al., 2006a). Despite the fact that no state of high accretion activity has been observed in SDSS J1212+0136, all observational evidence suggests that is nearly a twin of the prototypical magnetic cataclysmic variable EF Eri (e.g. Beuermann et al., 2000).
Taken on its own, the very red colour of SDSS J1212+0136 would suggests it to be a quasar (Sect. 5.4.2, Fig. 13). However, its stellar nature is confirmed by the detection of a significant and large proper motion (Fig. 14). Recovering this DAH white dwarf with a brown dwarf companion shows that our methods to identify DA white dwarfs with IR-excess are sufficiently robust to also find non-DA white dwarfs with genuine IR excess.
6.2 Example Spectroscopic IR Excess Candidates
6.2.1 SDSS J0135+1445
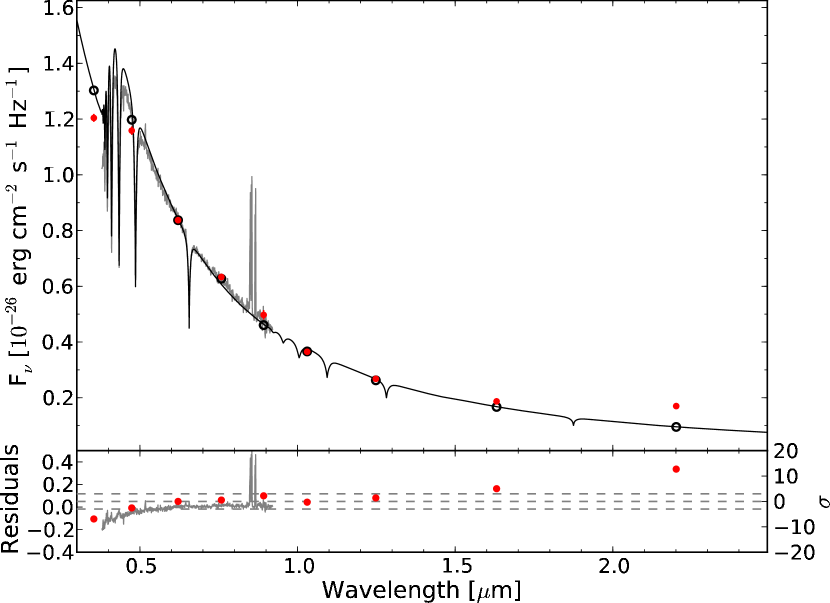
SDSS J0135+1445 is a clear candidate for being a cool white dwarf with a late-type stellar companion or brown dwarf. An excess is seen to extend over all the UKIDSS bands in Fig. 6. Modelling of the companion suggests that its spectral type is between L7 and L8. Spectral fitting implies a white dwarf of K at a distance of pc. A K is calculated from fitting of the photometry, broadly similar to the recently discovered (resolved) DA plus brown dwarf binary PHL 5038 (Steele et al., 2009).
6.2.2 SDSS J0753+2447
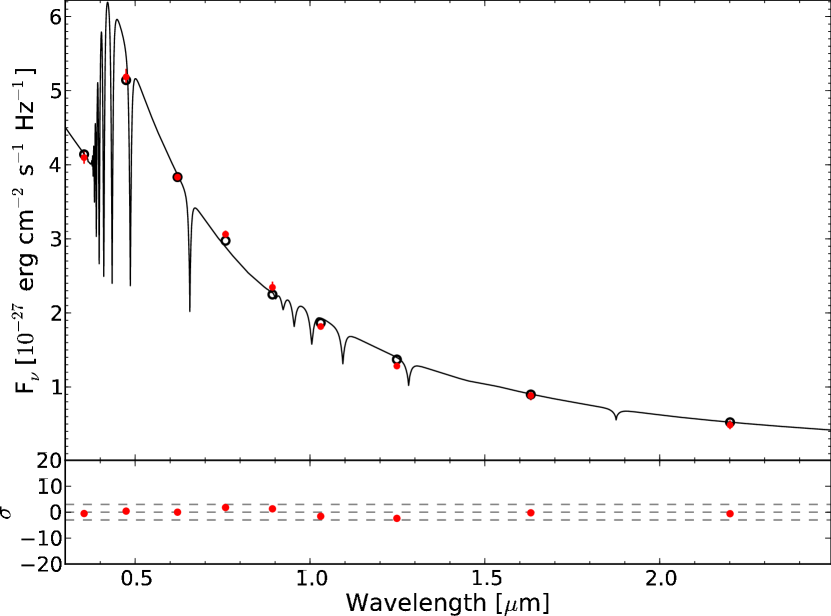
SDSS J0753+2447 is a very strong candidate for being a DA white dwarf with a late-type brown dwarf or debris disc (Fig. 18). The fit to the SDSS spectrum implies a K, , with an implied distance pc and white dwarf mass . Fitting of the companion type was inconclusive, but the shape of the SED is similar to that of the benchmark object, SDSS J1228+1040. Therefore SDSS J0753+2447 is classified as a brown dwarf or disc candidate.
6.2.3 SDSS J1247+1035
SDSS J1247+1035 is a candidate for having a brown dwarf companion or dusty debris disk, however the UKIDSS -band is only in excess by over the white dwarf model. Far-IR photometry of the object is required to confirm the IR excess.
6.2.4 SDSS J1557+0916
UKIDSS photometry of SDSS J1557+0916 shows a band excess for both the spectroscopic and photometric fitting methods. The spectroscopy and photometric differ by 3800K, however, this does not significantly affect the result. This is a good example of where reddening is probably reducing the blue flux. Reddening the white dwarf model spectrum by brings the overall SED in line with the SDSS optical spectrum. Modelling of the companion object proved inconclusive as to its spectral type (Table DA white dwarfs in SDSS DR7 and a search for infrared excess emission). SDSS J1557+0916 is a good candidate for having a dusty disc or low-mass companion based on its IR spectral shape.
6.2.5 SDSS J22200041
PHL 5038 ( = SDSS J22200041) is a wide () binary containing a cool ( K) white dwarf with an L8 companion, only the fourth white dwarf plus brown dwarf binary known (Steele et al., 2009).
6.3 Example Photometric IR Excess Candidates
As described in Sect. 5.1.2, we fitted all photometric objects satisfying our DA white dwarf constraint set (Table 1) with DA model spectra, independent on whether they also have an SDSS spectrum.
6.3.1 DA white dwarf candidates
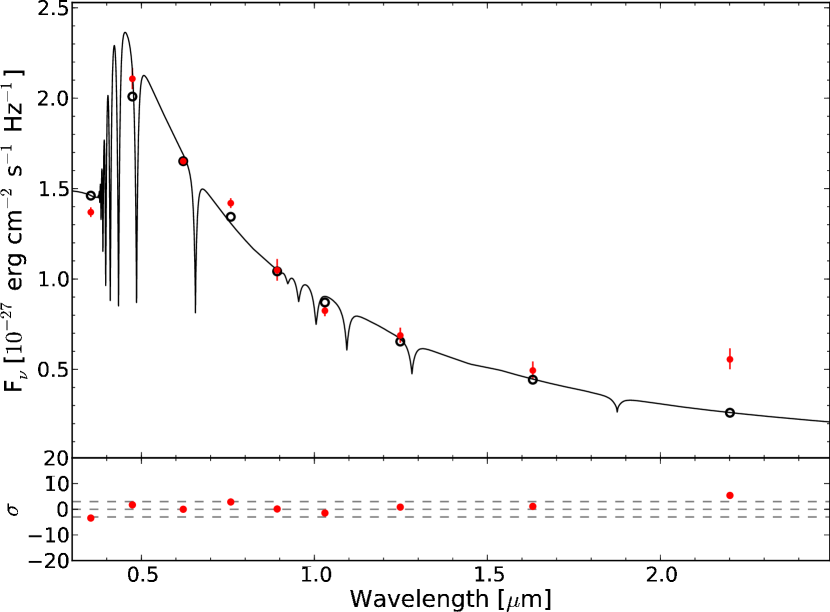
SDSS J09590200
SDSS J09590200 is a photometric-only DA candidate with K and . The UKIDSS -band magnitude shows a large () excess over the white dwarf model, no excess is seen at shorter wavelengths. This object is a strong candidate for having a very late type brown dwarf companion, or a dusty debris disc.
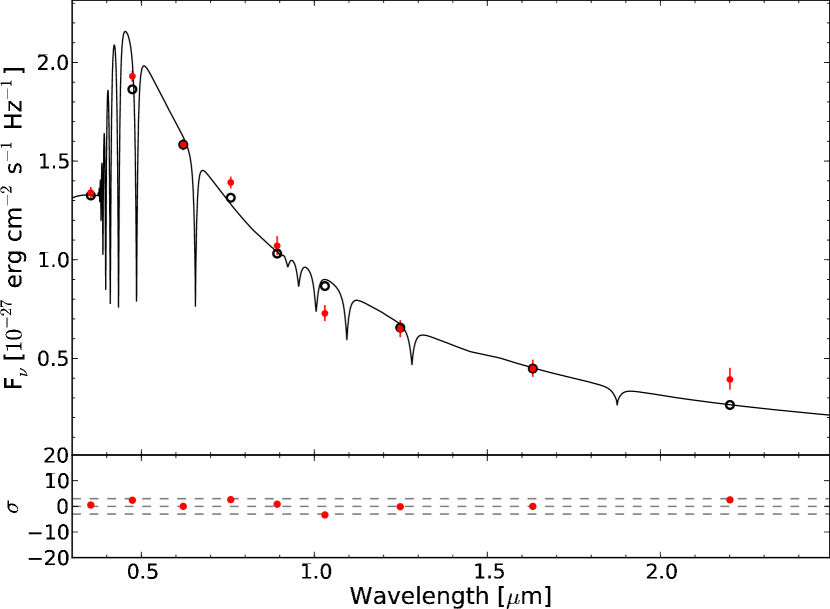
SDSS J1221+1245
A second interesting photometric-only DA white dwarf candidate is SDSS J1221+1245. The white dwarf is best fitted by a model with system parameters K and . The UKIDSS -band magnitude shows a borderline excess over the white dwarf model, but no excess is seen at shorter wavelengths. This object is again a good candidate for having a very late type brown dwarf companion, or a dusty debris disc.
6.3.2 Other Composite Objects
Inspection of Simbad reveals that four of the photometric-only DA candidates with IR excess (DA:ire and DA:ire:, Table 8) are previously known (pre-)white dwarf binaries and one pulsating subdwarf, which provides a preview on the mixture of objects that can be expected within this sample. It also underlines that the method efficiently identifies genuine infrared-excess white dwarfs.
SDSS J0016+0704 = PG 0014+067
Brassard et al. (2001) identified PG 0014+067 as a pulsating sdB with K and . Fitting the photometry with DA model atmospheres results in K with the surface gravity fixed to , and reveals a clear IR excess. At such high temperatures, the slope of the optical and near-IR SED of this object is close to a Rayleigh-Jeans distribution, and while modelling the photometric data with DA models may not be perfect, we believe that PG 0014+067 does exhibit a genuine IR excess. In their asteroseismological analysis, Brassard et al. (2001) found that the pulsation frequency spectrum of PG 0014+067 exhibits fine structure that they tentatively interpreted as a rotational period of h, revised later by (Jeffery et al., 2005) to d. One possibility is that PG 0014+067 has a close low-mass binary companion with an orbital period of a few days and that the sdB is tidally locked, rotating at the same period. This hypothesis can be tested by a radial velocity study of this subdwarf.
Cataclysmic Variables
BK Lyn ( = SDSS J0920+3356) and HS 0139+0559 ( = SDSS0141+0614) are novalike variables (Dobrzycka & Howell, 1992; Aungwerojwit et al., 2005) with optically thick accretion discs, and their optical colours are similar to that of hot white dwarfs or subdwarfs. However, their companion stars and cooler outer regions of the accretion discs start to contributed noticeably in the near-IR.
Detached Binaries
Abell 31 ( = SDSS J0854+0853, PN G219.1+31.2) is a planetary nebula with a nearby () M-dwarf, both stars are most likely an associated wide binary (Ciardullo et al., 1999).
7 Comparison with SDSS DR6 White Dwarf–Main Sequence Binaries
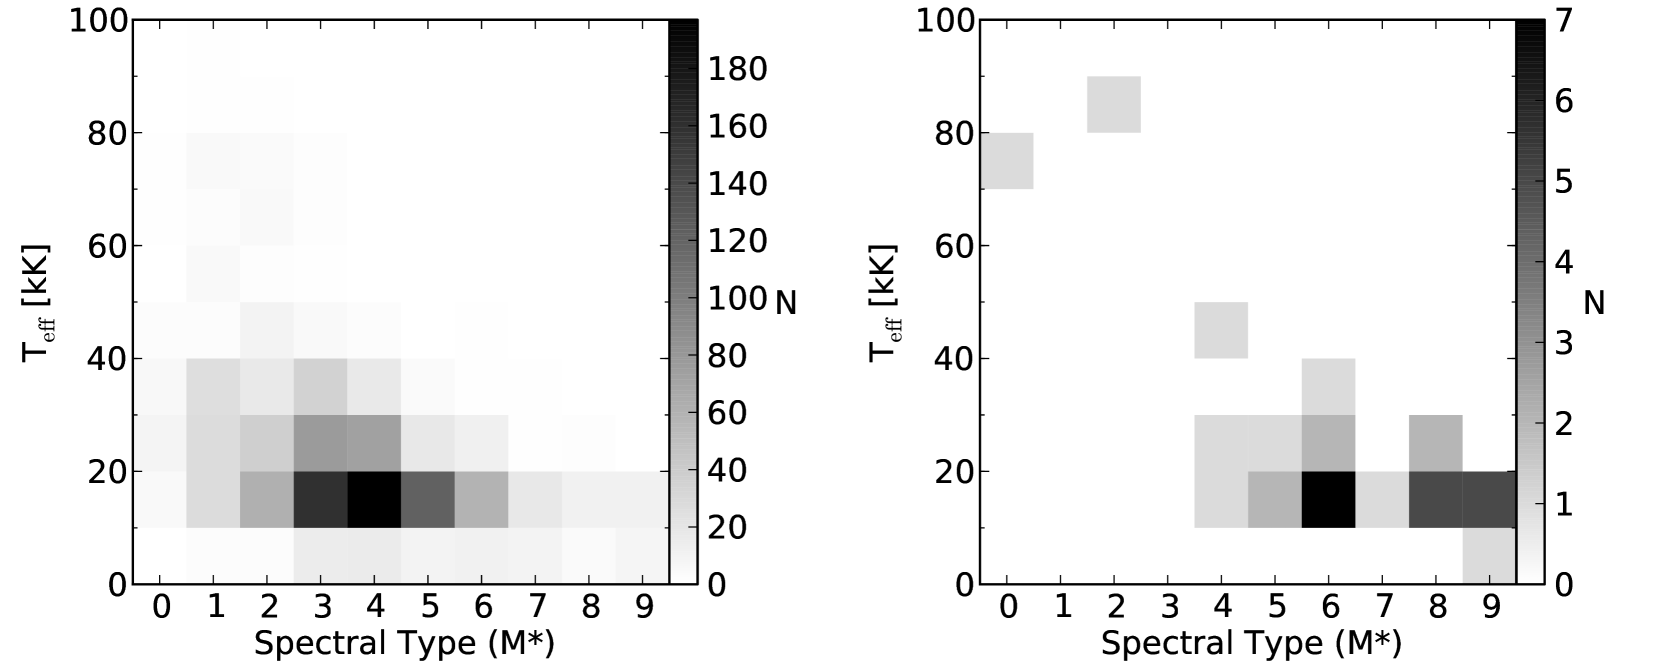
Rebassa-Mansergas et al. (2010, hereafter RM10) compiled a catalogue of white dwarf–main sequence (WDMS) binaries from all spectroscopic objects within SDSS DR6. Given that their detection method was based on optical data alone, RM10 were primarily sensitive to white dwarfs with M-type companions. The distribution of their WDMS binaries as a function of effective temperature and companion star spectral type shows a clear concentration of kK white dwarfs with M4-type companions (Fig. 21, left panel). The large luminosity of hot white dwarfs prevents the identification of low-mass companions around them, explaining the relative dearth of late spectral types at higher temperatures. The decreasing number of very late M-dwarfs (M6) could also be affected to some degree by the same contrast problem, however, it is known that the companion mass distribution of WDMS binaries is dropping towards the low-mass end of the main sequence (Farihi et al., 2005).
The sample of WDMS binaries of RM10 provides a natural comparison for the work done here. We have subjected their entire sample of WDMS binaries to our DA colour cuts (Table 1), finding that only 93 of the 1602 systems fall within the colour cuts. This small number is not too surprising, as the red flux from the M-dwarf companions moves the majority of RM10’s WDMS binaries out of our colour selection. RM10 list WD temperature and companion spectral type for 53 of these 93 systems. In contrast to our work here (Sect. 5.2), the study of RM10 included (partially) resolved systems. Consequently, we removed 21 that appeared resolved in the SDSS (or UKIDSS images where available), which leaves us with 32 objects in common. Figure 21 shows that the two samples only overlap for systems where the companion is relatively faint in the optical compared to the white dwarf, which is expected as our DA selection needs the white dwarf to dominate. Finally, 10 of the 32 objects are in the UKIDSS footprint.
We cross-correlated the white dwarfs with an IR excess from our spectroscopic and photometric samples (Table DA white dwarfs in SDSS DR7 and a search for infrared excess emission and 8), and the WDMS catalogue of RM10 and found 19 objects in common (Table DA white dwarfs in SDSS DR7 and a search for infrared excess emission). This is comprised of the 10 objects above that we expect to be in the sample, along with 9 others where no spectral type is listed in RM10’s catalogue. There is in general a good agreement between the white dwarf system parameters, however the underestimation of photometric temperatures is highlighted again. The spectroscopic sample and the WDMS catalogue largely find companion types within two spectral types of each other. All of these are M-type companions as expected from the sensitivity of the WDMS catalogue. Five objects are found to have an excess in the photometric method, but were rejected from the spectroscopic sample because signatures of a main sequence star companion can be seen in the optical spectra, whereas the spectroscopic sample only contains pure DA white dwarfs. Those are marked as such in Table DA white dwarfs in SDSS DR7 and a search for infrared excess emission, and suffer from the same companion type biases discussed in Section 5.4.1.
8 Confirmation of IR excess candidates in WISE
We cross correlated all spectroscopic and photometric-only IR excess candidates (from Table DA white dwarfs in SDSS DR7 and a search for infrared excess emission and 8 respectively) with WISE PDR within . Of the 42 IR excess objects from the spectroscopic method, 3 had a detection in at least one WISE band. Similarly 14 of the 67 photometric-only objects were detected and are listed in the online master table.
The three spectroscopically confirmed DA white dwarfs with IR excesses and WISE data: SDSS J02360103, SDSS J0847+2831 and SDSS J1448+0713, are all confirmed to have an excess in the WISE and m bands. They are however all predicted to have late M-type companions and are not brown dwarf or debris disk candidates.
Of the 14 photometric-only IR excess candidates with WISE data, SDSS J15240128 and SDSS J1549+0325 are not found to have an excess in the and m bands. Similarly, because we do not trust the effective temperature of the white dwarf fit, we also do not believe the far-IR excess found for SDSS J0841+0501, SDSS J1441+0137, SDSS J1538+0644 and SDSS J15510118. This is indicated by a flat, constant excess over the white dwarf model and is continued into the far-IR WISE data in these cases (see Fig. 22).
The remaining 8 objects (SDSS J0207+0715, SDSS J0742+2857, SDSS J0751+2002, SDSS J0920+3356, SDSS J1448+0812, SDSS J1456+1040, SDSS J1538+2957, and SDSS J1635+2912) are confirmed to have an IR excess consistent with a late type companion in the WISE far-IR data. Some interesting examples of these are shown in Fig. 23. SDSS J1538+2957 (Fig. 23) is predicted to have an M8-type companion from the photometric method. However, the spectral shape of the excess is found to be inconsistent with such an early type companion. The excess in UKIDSS, and now WISE, is more indicative of a later type brown dwarf companion or dusty debris disk. This mismatch is most likely caused by over estimating the distance to the white dwarf in the photometric method. SDSS J1635+2912 (Fig. 23) is one of the photometric-only debris disk candidate systems. The WISE m flux confirms the infrared excess, but still leaves the origin of the excess, brown dwarf or disk, open.
9 Discussion
9.1 Selection of DA white dwarfs from optical photometry
We have developed dedicated colour-colour cuts to select DA white dwarfs only from their optical photometry (Table 1, Fig. 2). This method can easily be optimised to prioritise for completeness, efficiency or a compromise of both. We have demonstrated that a high completeness (95.4%) can be obtained with a reasonable efficiency (62.3%) based on the data from SDSS DR7. The strengths of this approach, is that it provides substantially larger and statistically better characterised white dwarf samples (Sect. 3.3) when compared to spectroscopic catalogues such as McCook & Sion (1999) and Eisenstein et al. (2006). We have also investigated methods to account for the contamination of the DA white dwarf candidate sample by quasars and NLHS. This method can be adapted to obtain large uniform samples of white dwarfs from other multicolour optical photometric surveys, such as e.g. SkyMapper (Keller et al., 2007).
9.2 Implications for the brown dwarf desert and the numbers of white dwarfs with dusty debris discs
Fitting the optical spectroscopy or photometry and probing for IR flux excess above the best-fit white dwarf, as previously done by Tremblay & Bergeron (2007), has proven to be an efficient and robust approach. It also allows one to identify hot white dwarfs with low-level excesses which have IR colours that are very similar to the bulk population of white dwarfs (Fig. 13). Our search is sensitive to companions as late as L8, and to warm dusty debris discs.
Of the 1275 spectroscopically confirmed DA white dwarfs with at least one UKIDSS magnitude, 26 () are found (or are candidates) to have an IR excess consistent with a L0-type companion or later, i.e. a brown dwarf. The exact cut off of where the brown dwarf sequence starts is age dependent and can vary from mid-M to mid-L-type. Taking the white dwarf mass distribution and the initial-final mass relation we can calculate the white dwarf progenitor masses. This with the white dwarf cooling age allows us to estimate the total age of the system. The average total age of the companion is a few Gyr, and in this regime L0-type is a suitable cut-off for being a brown dwarf. Taking only the systems where we are confident of the excess (not “DAire:” in Table DA white dwarfs in SDSS DR7 and a search for infrared excess emission) gives a lower limit for the number of white dwarfs with brown dwarf type companions of . This is compatible with previous estimates. An adaptive optics imaging survey of 266 solar-like stars by Metchev & Hillenbrand (2009) found a wide (28–1590 AU) sub-stellar companion fraction of . Farihi et al. (2005) carried out an extensive near-IR imaging survey for both wide and unresolved low-mass companions to 394 known white dwarfs, finding an overall stellar companion fraction of 22%, and a brown dwarf companion fraction of %.
When using the photometric fitting method, 105 of the 1771 photometric-only DA white dwarf candidates with UKIDSS data exhibit an IR excess, of which we eliminate 38 likely quasars (Sect. 5.4.2 and see online QSO table). Taking into account our estimate for the contamination by NLHS (Sect. 5.4.3), we find that of white dwarfs in the photometric-only sample have an IR excess, of which are candidates for having a brown dwarf companion. This is consistent with the frequencies found in the spectroscopic sample, though not as secure.
Taking only the objects with a detection in the -band (required for detecting a disk), of the 571 spectroscopically confirmed DA white dwarfs, 7 () are found to have an IR excess compatible with a companion spectral type later or equal to L8, and are hence viable disc candidates. Similarly, (4/840) of the photometric-only sample are disc candidates, or, scaling for the 62.3% efficiency of our DA white dwarf selection, (4/523). This is consistent with the results of Farihi et al. (2009), who estimated that the frequency of white dwarfs with dusty debris discs is at least . Any search for debris discs based on -band data is biased towards warm, bright circumstellar dust rather than faint discs or narrow rings. Of the known white dwarfs with a dusty debris disc, only about half reveal themselves shortward of (Kilic et al., 2006; Farihi et al., 2009).
To confirm the IR excess candidates we have cross matched all the spectroscopic (Table DA white dwarfs in SDSS DR7 and a search for infrared excess emission) and photometric-only (Table 8) candidates with the far-IR WISE PDR. This has provided and m fluxes for (3/42) and (14/64) of the spectroscopic and photometric-only IR excess candidates respectively. We find that all three of the spectroscopic IR excess candidates also have an excess in the far-IR.
However, in the photometric-only sample, a total of six objects are found not to have a definite IR excess at m. The remaining 8 of 14 white dwarf candidates have a real IR excess in the WISE fluxes. We therefore find that of the photometric-only IR excess candidates have real IR excesses consistent with a MS star companion, brown dwarf companion or dusty debris disk.
Determining the true nature of the white dwarfs with an excess in only will require far-IR data to distinguish between a late-type brown dwarf companion or a dusty debris disc. More generally, deeper near-IR and/or far-IR follow up observations will be required to verify, or refute, the IR excess candidates (DAire: and DA:ire:), as some of these candidates are likely to be spurious. Similarly, while our colour selection (Table 1) has a high efficiency, optical spectroscopy of the white dwarf candidates (DA:ire and DA:ire:) will be necessary to confirm their (DA) white dwarf nature.
10 Conclusions
We have developed a detailed method to select DA white dwarfs in colour space, and applying this method to SDSS DR7, we have identified 7444 DA white dwarfs with and SDSS spectroscopy, approximately more than the corresponding number from DR4 (Eisenstein et al., 2006), and 9341 photometric-only DA candidates. Using this sample, we estimate the spectroscopic completeness of DA white dwarfs with K in SDSS DR7 to be %.
We cross-correlated these spectroscopic and photometric DA samples with UKIDSS DR8 to carry out the currently largest and deepest untargeted search for low-mass companions to and debris discs around DA white dwarfs. This search led to the identification of a significant number of DA white dwarfs with low-mass companions, including several brown dwarf and dusty debris disc candidates. Similar studies to the one presented here making use of the full UKIDSS area, as well as the corresponding surveys in the southern hemisphere, e.g. Skymapper, VISTA and VHS, promise to further increase the sample sizes of these types of systems.
Note
Before submission the authors became aware of the study of Steele et al. (2011, in prep.) who have carried out an independent study, cross-matching the spectroscopically confirmed white dwarfs from McCook & Sion (1999) and Eisenstein et al. (2006) with UKIDSS DR8. Comparison of their results with our spectroscopic sample shows that both studies lead to broadly consistent results.
Acknowledgements
Funding for the Sloan Digital Sky Survey (SDSS) and SDSS-II has been provided by the Alfred P. Sloan Foundation, the Participating Institutions, the National Science Foundation, the U.S. Department of Energy, the National Aeronautics and Space Administration, the Japanese Monbukagakusho, and the Max Planck Society, and the Higher Education Funding Council for England. The SDSS Web site is http://www.sdss.org/.
D. Steeghs acknowledges a STFC Advanced Fellowship.
This publication makes use of data products from the Wide-field Infrared Survey Explorer, which is a joint project of the University of California, Los Angeles, and the Jet Propulsion Laboratory/California Institute of Technology, funded by the National Aeronautics and Space Administration.
References
- Aannestad et al. (1993) Aannestad, P. A., Kenyon, S. J., Hammond, G. L., Sion, E. M., 1993, AJ, 105, 1033
- Abazajian et al. (2009) Abazajian, K. N., et al., 2009, ApJS, 182, 543
- Araujo-Betancor et al. (2005) Araujo-Betancor, S., Gänsicke, B. T., Long, K. S., Beuermann, K., de Martino, D., Sion, E. M., Szkody, P., 2005, ApJ, 622, 589
- Aungwerojwit et al. (2005) Aungwerojwit, A., et al., 2005, A&A, 443, 995
- Becklin & Zuckerman (1988) Becklin, E. E., Zuckerman, B., 1988, Nat, 336, 656
- Bergeron et al. (1992) Bergeron, P., Saffer, R. A., Liebert, J., 1992, ApJ, 394, 228
- Beuermann et al. (2000) Beuermann, K., Wheatley, P., Ramsay, G., Euchner, F., Gänsicke, B. T., 2000, A&A, 354, L49
- Brassard et al. (2001) Brassard, P., Fontaine, G., Billères, M., Charpinet, S., Liebert, J., Saffer, R. A., 2001, ApJ, 563, 1013
- Brinkworth et al. (2009) Brinkworth, C. S., Gänsicke, B. T., Marsh, T. R., Hoard, D. W., Tappert, C., 2009, ApJ, 696, 1402
- Burleigh et al. (2002) Burleigh, M. R., Clarke, F. J., Hodgkin, S. T., 2002, MNRAS, 331, L41
- Burleigh et al. (2006) Burleigh, M. R., et al., 2006, MNRAS, 373, 1416
- Burleigh et al. (2008) Burleigh, M. R., et al., 2008, MNRAS, 386, L5
- Ciardullo et al. (1999) Ciardullo, R., Bond, H. E., Sipior, M. S., Fullton, L. K., Zhang, C., Schaefer, K. G., 1999, AJ, 118, 488
- Covey et al. (2007) Covey, K. R., et al., 2007, AJ, 134, 2398
- De Gennaro et al. (2008) De Gennaro, S., von Hippel, T., Winget, D. E., Kepler, S. O., Nitta, A., Koester, D., Althaus, L., 2008, AJ, 135, 1
- Debes et al. (2006) Debes, J. H., López-Morales, M., Bonanos, A. Z., Weinberger, A. J., 2006, ApJ Lett., 647, L147
- Dobrzycka & Howell (1992) Dobrzycka, D., Howell, S. B., 1992, ApJ, 388, 614
- Dupuis et al. (1993) Dupuis, J., Fontaine, G., Pelletier, C., Wesemael, F., 1993, ApJS, 84, 73
- Dye et al. (2006) Dye, S., et al., 2006, MNRAS, 372, 1227
- Eisenstein et al. (2006) Eisenstein, D. J., et al., 2006, ApJS, 167, 40
- Farihi & Christopher (2004) Farihi, J., Christopher, M., 2004, AJ, 128, 1868
- Farihi et al. (2005) Farihi, J., Becklin, E. E., Zuckerman, B., 2005, ApJS, 161, 394
- Farihi et al. (2008) Farihi, J., Burleigh, M. R., Hoard, D. W., 2008, ApJ, 674, 421
- Farihi et al. (2009) Farihi, J., Jura, M., Zuckerman, B., 2009, ApJ, 694, 805
- Farihi et al. (2010) Farihi, J., Barstow, M. A., Redfield, S., Dufour, P., Hambly, N. C., 2010, MNRAS, 404, 2123
- Fulbright et al. (1993) Fulbright, M. S., Liebert, J., Bergeron, P., Green, R., 1993, ApJ, 406, 240
- Gänsicke et al. (1995) Gänsicke, B. T., Beuermann, K., de Martino, D., 1995, A&A, 303, 127
- Gänsicke et al. (2006a) Gänsicke, B. T., Long, K. S., Barstow, M. A., Hubeny, I., 2006a, ApJ, 639, 1039
- Gänsicke et al. (2006b) Gänsicke, B. T., Marsh, T. R., Southworth, J., Rebassa-Mansergas, A., 2006b, Science, 314, 1908
- Gänsicke et al. (2007) Gänsicke, B. T., Marsh, T. R., Southworth, J., 2007, MNRAS, 380, L35
- Graham et al. (1990) Graham, J. R., Matthews, K., Neugebauer, G., Soifer, B. T., 1990, ApJ, 357, 216
- Green et al. (1978) Green, R. F., Richstone, D. O., Schmidt, M., 1978, ApJ, 224, 892
- Grether & Lineweaver (2006) Grether, D., Lineweaver, C. H., 2006, ApJ, 640, 1051
- Han et al. (2003) Han, Z., Podsiadlowski, P., Maxted, P. F. L., Marsh, T. R., 2003, MNRAS, 341, 669
- Heber (2009) Heber, U., 2009, ARA&A, 47, 211
- Hoard et al. (2007) Hoard, D. W., Wachter, S., Sturch, L. K., Widhalm, A. M., Weiler, K. P., Pretorius, M. L., Wellhouse, J. W., Gibiansky, M., 2007, AJ, 134, 26
- Hogan et al. (2009) Hogan, E., Burleigh, M. R., Clarke, F. J., 2009, MNRAS, 396, 2074
- Holberg & Bergeron (2006) Holberg, J. B., Bergeron, P., 2006, 132, 1221
- Holberg et al. (2008) Holberg, J. B., Bergeron, P., Gianninas, A., 2008, AJ, 135, 1239
- Howell et al. (2008) Howell, S. B., Harrison, T. E., Huber, M. E., Szkody, P., Walter, F. M., Harbeck, D., 2008, AJ, 136, 2541
- Ignace (2001) Ignace, R., 2001, PASP, 113, 1227
- Jeffery et al. (2005) Jeffery, C. S., Aerts, C., Dhillon, V. S., Marsh, T. R., Gänsicke, B. T., 2005, MNRAS, 362, 66
- Jura (2003) Jura, M., 2003, ApJ Lett., 584, L91
- Keller et al. (2007) Keller, S. C., et al., 2007, Publications of the Astronomical Society of Australia, 24, 1
- Kilic et al. (2006) Kilic, M., von Hippel, T., Leggett, S. K., Winget, D. E., 2006, ApJ, 646, 474
- Kilic et al. (2007) Kilic, M., Brown, W. R., Allende Prieto, C., Pinsonneault, M. H., Kenyon, S. J., 2007, ApJ, 664, 1088
- Koester (2010) Koester, D., 2010, Memorie della Societa Astronomica Italiana, 81, 921
- Koester & Wilken (2006) Koester, D., Wilken, D., 2006, A&A, 453, 1051
- Koester et al. (1979) Koester, D., Schulz, H., Weidemann, V., 1979, A&A, 76, 262
- Koester et al. (1997) Koester, D., Provencal, J., Shipman, H. L., 1997, A&A, 320, L57
- Lawrence et al. (2007) Lawrence, A., et al., 2007, MNRAS, 379, 1599
- Li & Thakar (2008) Li, N., Thakar, A. R., 2008, Computing in Science and Engineering, 10, 18
- Liebert et al. (2004) Liebert, J., Bergeron, P., Eisenstein, D., Harris, H. C., Kleinman, S. J., Nitta, A., Krzesinski, J., 2004, ApJ Lett., 606, L147
- Liebert et al. (2005) Liebert, J., Bergeron, P., Holberg, J. B., 2005, ApJS, 156, 47
- Linnell et al. (2010) Linnell, A. P., Szkody, P., Plotkin, R. M., Holtzman, J., Seibert, M., Harrison, T. E., Howell, S. B., 2010, ApJ, 713, 1183
- Luhman et al. (2011) Luhman, K. L., Burgasser, A. J., Bochanski, J. J., 2011, ApJ Lett., 730, L9+
- Marcy & Butler (2000) Marcy, G. W., Butler, R. P., 2000, PASP, 112, 137
- Marsh et al. (2010) Marsh, T., Gänsicke, B. T., Steeghs, D., Southworth, J., Koester, D., Harris, V., Merry, L., 2010, ApJ Lett., submitted, arXiv:1002.4677
- Maxted et al. (2006) Maxted, P. F. L., Napiwotzki, R., Dobbie, P. D., Burleigh, M. R., 2006, Nat, 442, 543
- McCook & Sion (1999) McCook, G. P., Sion, E. M., 1999, ApJS, 121, 1
- Melis et al. (2010) Melis, C., Jura, M., Albert, L., Klein, B., Zuckerman, B., 2010, ApJ, 722, 1078
- Metchev & Hillenbrand (2009) Metchev, S. A., Hillenbrand, L. A., 2009, ApJS, 181, 62
- Mullally et al. (2009) Mullally, F., Reach, W. T., Degennaro, S., Burrows, A., 2009, ApJ, 694, 327
- Oswalt et al. (1996) Oswalt, T. D., Smith, J. A., Wood, M. A., Hintzen, P., 1996, Nat, 382, 692
- Parsons et al. (2010) Parsons, S. G., et al., 2010, MNRAS, 407, 2362
- Probst & Oconnell (1982) Probst, R. G., Oconnell, R. W., 1982, ApJ Lett., 252, L69
- Rebassa-Mansergas et al. (2007) Rebassa-Mansergas, A., Gänsicke, B. T., Rodríguez-Gil, P., Schreiber, M. R., Koester, D., 2007, MNRAS, 382, 1377
- Rebassa-Mansergas et al. (2010) Rebassa-Mansergas, A., Gänsicke, B. T., Schreiber, M. R., Koester, D., Rodríguez-Gil, P., 2010, MNRAS, 402, 620
- Schlegel et al. (1998) Schlegel, D. J., Finkbeiner, D. P., Davis, M., 1998, ApJ, 500, 525
- Schmidt et al. (2005) Schmidt, G. D., Szkody, P., Silvestri, N. M., Cushing, M. C., Liebert, J., Smith, P. S., 2005, ApJ Lett., 630, L173
- Schmidt et al. (2003) Schmidt, G. D., et al., 2003, ApJ, 595, 1101
- Steele et al. (2009) Steele, P. R., Burleigh, M. R., Farihi, J., Gänsicke, B. T., Jameson, R. F., Dobbie, P. D., Barstow, M. A., 2009, A&A, 500, 1207
- Stoughton et al. (2002) Stoughton, C., et al., 2002, AJ, 123, 485
- Tremblay & Bergeron (2007) Tremblay, P.-E., Bergeron, P., 2007, ApJ, 657, 1013
- Tremblay & Bergeron (2009) Tremblay, P.-E., Bergeron, P., 2009, ApJ, 696, 1755
- Wachter et al. (2003) Wachter, S., Hoard, D. W., Hansen, K. H., Wilcox, R. E., Taylor, H. M., Finkelstein, S. L., 2003, ApJ, 586, 1356
- Winget et al. (1987) Winget, D. E., Hansen, C. J., Liebert, J., van Horn, H. M., Fontaine, G., Nather, R. E., Kepler, S. O., Lamb, D. Q., 1987, ApJ Lett., 315, L77
- Wright et al. (2010) Wright, E. L., et al., 2010, 140, 1868
- Yanny et al. (2009) Yanny, B., et al., 2009, AJ, 137, 4377
- York et al. (2000) York, D. G., et al., 2000, AJ, 120, 1579
- Zuckerman & Becklin (1987) Zuckerman, B., Becklin, E. E., 1987, Nat, 330, 138
| Coord | () | Companion | Notes | Notes2 | Eisenstein | JHK | ||||
|---|---|---|---|---|---|---|---|---|---|---|
| 00320739 | M6 | DAire: | resolved,bg: | DA | JHK | |||||
| 00390030 | M9 | DAire: | DA_auto | JHK | ||||||
| 01351445 | L6 | DAire | DA | JHK | ||||||
| 02070702 | L7 | DAire: | JHK | |||||||
| 02360103 | M6 | DAire | DAM: | JHK | ||||||
| 02530027 | L4 | DAire | moreIR | DA_auto | JH | |||||
| 07482058 | M3 | DAire | resolved: | DAM: | JHK | |||||
| 07532447 | L5: | DAire | disk | DA_auto | JHK | |||||
| 08472831 | M6 | DAire | DAM: | JHK | ||||||
| 09070536 | L6 | DAire: | moreIR | DA_auto | JHK | |||||
| 09333200 | L4 | DAire | resolved: | JHK | ||||||
| 09500115 | L8 | DAire: | moreIR | DA | JH | |||||
| 10020939 | L0 | DAire | DA_auto | JHK | ||||||
| 10100407 | L8: | DAire: | moreIR | DA_auto | JH | |||||
| 10150425 | L4 | DAire: | moreIR | DA_auto | JHK | |||||
| 10160020 | L6 | DAire: | moreIR | DA | H | |||||
| 10370139 | L5: | DAire | DA | JHK | ||||||
| 11200639 | L3 | DAire: | resolved,bg: | DA_auto | J | |||||
| 11410420 | M7 | DAire | DAM: | JHK | ||||||
| 12080610 | M7 | DAire | DA_auto | JH | ||||||
| 12180042 | L8 | DAire: | moreIR | DA | JH | |||||
| 12281040 | L6: | DAire | disk | DA_auto | JHK | |||||
| 12460707 | L2 | DAire | HK | |||||||
| 12471035 | L6: | DAire: | bg:,resolved: | JHK | ||||||
| 13140057 | L6 | DAire: | disk: | HK | ||||||
| 13200018 | L8 | DAire: | disk: | DA | JHK | |||||
| 13291230 | M7 | DAire | DA_auto | JHK | ||||||
| 13310040 | ? | DAire: | moreIR | DA | ||||||
| 13410056 | M7 | DAire | JHK | |||||||
| 13520910 | M5 | DAire | JHK | |||||||
| 14100225 | DAire: | moreIR | DA | JH | ||||||
| 14250013 | L8: | DAire: | moreIR | DA | JHK | |||||
| 14480240 | L4 | DAire | moreIR | DA | JH | |||||
| 14480713 | M8 | DAire | JHK | |||||||
| 14500000 | L8: | DAire: | moreIR | JHK | ||||||
| 15570916 | L1: | DAire | DA_auto | JHK | ||||||
| 16092905 | DAire | JHK | ||||||||
| 16192533 | M5 | DAire | JHK | |||||||
| 16253026 | M5 | DAire | DA_auto | JHK | ||||||
| 22200041 | DAire: | resolved | DA_auto | JHK | ||||||
| 22250016 | L6 | DAire: | resolved: | DA_auto | JHK | |||||
| 23311342 | L6 | DAire | DAM: | JHK |
| Coord | Companion | Notes | Notes2 | JHK | Simbad Name | Simbad Class | ||
|---|---|---|---|---|---|---|---|---|
| 00160704 | L0 | DA:ire | JHK | V* EK Psc | Variable Star | |||
| 01041459 | L5 | DA:ire | moreIR | JH | ||||
| 01410614 | L8: | DA:ire: | bf | JHK | 2MASS | Nova | ||
| 02070715 | L6: | DA:ire | bf | JHK | PB6668 | Star | ||
| 07422857 | L6 | DA:ire | JHK | |||||
| 07512002 | L5 | DA:ire | JHK | |||||
| 07582406 | L2: | DA:ire | JHK | |||||
| 08410501 | L8: | DA:ire: | bf | JHK | ||||
| 08420004 | M9 | DA:ire | JH | |||||
| 08540853 | M6 | DA:ire | JHK | PN_A66_31 | PN | |||
| 09060001 | L8: | DA:ire: | bf | JHK | ||||
| 09203356 | L8: | DA:ire: | bf | JHK | V* BK Lyn | Nova | ||
| 09230652 | L8: | DA:ire: | bf,bg | JHK | ||||
| 09250140 | M9 | DA:ire | JHK | |||||
| 09521205 | L8: | DA:ire: | bf | HK | ||||
| 09590200 | L6 | DA:ire | disk | JHK | ||||
| 09590330 | L0 | DA:ire | JHK | PG0957037 | UV | |||
| 10050225 | L5: | DA:ire: | bf | JHK | ||||
| 10060032 | L8 | DA:ire | bf: | JHK | PG1004008 | UV | ||
| 10381100 | L3 | DA:ire | JHK | |||||
| 10570628 | L8: | DA:ire: | QSO: | JHK | ||||
| 11030101 | L8: | DA:ire: | bf: | JHK | [VV2006]J110336.3010141 | Quasar | ||
| 11031100 | L4 | DA:ire: | hotWD,moreIR | J | PG1101113 | SD | ||
| 11160755 | M9 | DA:ire | JHK | |||||
| 11530048 | L8: | DA:ire: | bf | JHK | LBQS11510104 | Star | ||
| 12211245 | L8: | DA:ire: | disk: | JHK | ||||
| 12240907 | L7 | DA:ire: | bg:,resolved:,bf: | JHK | ||||
| 12370151 | L4: | DA:ire: | resolved,bg: | JHK | ||||
| 12461600 | L8: | DA:ire: | bf: | JHK | ||||
| 13150245 | L1: | DA:ire: | resolved,bg: | JHK | ||||
| 13190152 | L8: | DA:ire: | bf | HK | WD1317021 | DA | ||
| 13232615 | L8: | DA:ire: | bf | HK | ||||
| 13340534 | L8: | DA:ire: | bf: | HK | ||||
| 13481100 | L1 | DA:ire | moreIR | J | ||||
| 13551454 | L1 | DA:ire | JHK | PB4150 | SD | |||
| 14161352 | M6 | DA:ire | JHK | PK_00366_1 | Galaxy | |||
| 14230138 | L8: | DA:ire: | moreIR | JH | ||||
| 14410137 | L6: | DA:ire: | bf: | JHK | PG1438018 | SD |
| S | S | P | P | S | P | S | P | Simbad | Simbad | |||
|---|---|---|---|---|---|---|---|---|---|---|---|---|
| Coord | Companion | Notes | Notes | Notes | Classification | Name | Class | |||||
| 00180101 | L1 | DA:ire | NLHS | |||||||||
| 00320739 | M6 | DAire: | resolved,bg: | DA | ||||||||
| 00390030 | M9 | L2 | DAire: | DA | ||||||||
| 01180025 | L3 | DA:ire | resolved | NLHS | ||||||||
| 01351445 | L6 | L8 | DAire | DA | ||||||||
| 02070702 | L7 | ? | DAire: | bf | DA | |||||||
| 02360103 | M6 | L8: | DAire | bf | DA | |||||||
| 02530027 | L4 | DAire | moreIR | DA | ||||||||
| 03330020 | M9 | DA:ire | NLHS | |||||||||
| 07482058 | M3 | M5 | DAire | resolved: | resolved: | DA | ||||||
| 07532447 | L5: | L6: | DAire | disk | DA | |||||||
| 08142811 | L8: | DA:ire: | bf | NLHS | ||||||||
| 08472831 | M6 | M9 | DAire | DA | ||||||||
| 08510330 | L6 | DA:ire | WDMS | |||||||||
| 09070536 | L6 | DAire: | moreIR | DA | ||||||||
| 09333200 | L4 | L2 | DAire | resolved: | resolved: | DA | ||||||
| 09500115 | L8 | DAire: | moreIR | DA | ||||||||
| 09510347 | L8: | DA:ire: | bf | NLHS | ||||||||
| 10020939 | L0 | L0 | DAire | DA | ||||||||
| 10100407 | L8: | DAire: | moreIR | DA | ||||||||
| 10150425 | L4 | DAire: | moreIR | DA | ||||||||
| 10160020 | L6 | DAire: | moreIR | DA | ||||||||
| 10251200 | L1 | DA:ire | NLHS | |||||||||
| 10370139 | L5: | L1 | DAire | DA | ||||||||
| 11000346 | M7 | DA:ire | NLHS | |||||||||
| 11060737 | M5 | DA:ire | WDMS | |||||||||
| 11200639 | L3 | DAire: | resolved,bg: | DA | ||||||||
| 11350731 | L7: | DA:ire: | bf: | NLHS | ||||||||
| 11410420 | M7 | M7 | DAire | DA | ||||||||
| 11480336 | L0 | DA:ire | NLHS | |||||||||
| 11480640 | M8 | DA:ire | NLHS | |||||||||
| 12080610 | M7 | L3 | DAire | DA | ||||||||
| 12111437 | M9 | DA:ire | NLHS | |||||||||
| 12120136 | ? | DA:ire: | bf | MWD | ||||||||
| 12151351 | M6 | DA:ire: | resolved: | NLHS | ||||||||
| 12180042 | L8 | L8: | DAire: | moreIR | moreIR | DA | ||||||
| 12191244 | L8: | DA:ire: | NoXs | bf: | DA | |||||||
| 12281040 | L6: | L8: | DAire | disk | disk | DA | ||||||
| 12460707 | L2 | M8 | DAire | DA | ||||||||
| 12471035 | L6: | DAire: | bg:,resolved: | DA | ||||||||
| 12490422 | L8: | DA:ire: | NoXs | moreIR | DA | |||||||
| 12501549 | L3: | DA:ire: | bf | MWD | ||||||||
| 13000057 | L8: | DA:ire: | bf: | NLHS | ||||||||
| 13100233 | M8 | DA:ire | NLHS | |||||||||