11email: echapill@mpifr-bonn.mpg.de, bparise@mpifr-bonn.mpg.de, fjdu@mpifr-bonn.mpg.de 22institutetext: Université de Bordeaux, Observatoire Aquitain des Sciences de l’Univers, 2 rue de l’Observatoire BP 89, F-33271 Floirac, France 33institutetext: CNRS/INSU - UMR5804, Laboratoire d’Astrophysique de Bordeaux; 2 rue de l’Observatoire BP 89, F-33271 Floirac, France
33email: guilloteau@obs.u-bordeaux1.fr
A deep search for H2D+ in protoplanetary disks ††thanks: Based on observations carried out with the Atacama Pathfinder Experiment and the James Clerk Maxwell Telescope. APEX is a collaboration between the Max-Planck-Institut für Radioastronomie, the European Southern Observatory, and the Onsala Space Observatory. The JCMT is operated by the Joint Astronomy Centre on behalf of the Science and Technology Facilities Council of the United Kingdom, the Netherlands Organisation for Scientific Research, and the National Research Council of Canada.
Abstract
Context. The structure in density and temperature of protoplanetary disks surrounding low-mass stars is not yet well known. The protoplanetary disks mid-planes are expected to be very cold and thus depleted in molecules in gas phase, especially CO. Recent observations of molecules at very low apparent temperature ( K) challenge this current picture of the protoplanetary disk structures.
Aims. We aim at constraining the physical conditions, and in particular the gas-phase CO abundance in the mid-plane of protoplanetary disks.
Methods. The light molecule H2D+ is a tracer of cold and CO-depleted environment. It is therefore a good candidate to explore the disks mid-planes. We performed a deep search for H2D+ in the two well-known disks surrounding TW Hya and DM Tau using the APEX and JCMT telescopes. The analysis of the observations are done with DISKFIT, a radiative transfer code dedicated to disks. In addition, we used a chemical model describing deuterium chemistry to infer the implications of our observations on the level of CO depletion and on the ionization rate in the disks mid-plane.
Results. The ortho-H2D+ line at 372 GHz was not detected. Although our limit is three times better than previous observations, comparison with the chemical modeling indicates that it remains insufficient to put valuable constraints on the CO abundance in the disk mid-plane.
Conclusions. Even with ALMA, the detection of H2D+ may not be straightforward, and H2D+ may not be a sufficiently sensitive tracer of the protoplanetary disks mid-plane.
Key Words.:
Stars: circumstellar matter – planetary systems: protoplanetary disks – individual: DM Tau, TW Hya – Radio-lines: stars1 Introduction
Planetary systems are believed to be formed in the latest stages of protostellar evolution, within protoplanetary disks. The details of this process are however not known. Constraining the physical and chemical structure in disks during their evolution are requirements to get more insights into this question.
Current models predict that protoplanetary disks consist of three typical layers, which are, going from the surface to the mid-plane of the disk: 1) the outer layer, a PDR directly illuminated by the stellar UV, 2) a warm molecular zone, where the UV is sufficiently attenuated to allow formation of molecules, and 3) a cold mid-plane where temperature is low and most molecules are expected to be frozen on dust grains (Bergin et al., 2007). All static chemical models published so far produce similar results (e.g. Aikawa & Nomura, 2006; Semenov et al., 2005). The chemistry is dominated by two main processes: molecular freeze-out onto grains in the cold mid-plane and photodissociation in the upper layers (enhanced by grain growth that allows the UV field to penetrate deeper in the disk). This simple picture is however not yet constrained by observations, and some puzzles still remain. In particular, very cold C2H, CN and CO (15 K, i.e. below the evaporation temperature) were detected in the DM Tau disk (Dartois et al., 2003; Piétu et al., 2007; Henning et al., 2010; Chapillon et al., submitted), pointing out that some process may lead to cold gas-phase molecules in the disk mid-plane. Radial and vertical mixing is usually invoked to explain partial molecular replenishment of the cold disk mid-plane from the higher warm layer (Semenov et al., 2006; Aikawa, 2007). Such an explanation is not fully satisfactory with respect to the current chemical results (see for example Hersant et al., 2009). Observations of a chemical tracer of cold regions are thus needed.
H2D+ is a very promising molecule to trace the disk mid-plane as it is likely the only remaining observable species in cold medium, where molecules are frozen onto grains. H2D+ is exclusively formed in the gas phase at low temperatures (T 20–30K). Moreover, CO (and other heavy species like N2) is a very efficient destroyer of H and H2D+. High abundances of H2D+ can thus only build up in depleted environments. The ortho-H2D+ line, hereafter o-H2D+, is commonly detected towards cold and dense pre-stellar cores, see for instance Caselli et al. (2008). Observation of o-H2D+ was also proposed by Ceccarelli et al. (2004) as a way to measure the mid-plane ionization, since H2D+ may be the dominant ion in that region.
Until now, no firm detection of o-H2D+ in protoplanetary disks has been definitively secured. A tentative detection on DM Tau obtained with the CSO was claimed by Ceccarelli et al. (2004) and later challenged by SMA observations by Qi et al. (2008). Using a line profile appropriate for the DM Tau disk, Guilloteau et al. (2006) showed that the Ceccarelli et al. (2004) data indicates only a tentative detection. There are only upper-limits in TW Hya (Ceccarelli et al., 2004; Thi et al., 2004; Qi et al., 2008) obtained with the JCMT and the SMA.
The paper is organized as follows: the observations are presented in Sect. 2, and upper limits on the o-H2D+ column densities are derived in Sect. 3. The implications on the level of CO depletion and ionization in the disk midplane are discussed in Sect. 4. The feasibility of ALMA observations are discussed in Sect. 5 and we summarize our study in Sect. 6.
2 Observations
We searched for o-H2D+ in two well-studied, close or large protoplanetary disks. Their properties are summarized in Table 1.
TW Hya is the nearest observable T-Tauri star, located only at 56 pc from the Sun, and surrounded by a rather small disk of about 200 AU of radius. It is the only protoplanetary disk where molecules have been studied in some systematic way because of its proximity (Qi et al., 2008). The disk is viewed nearly face-on.
DM Tau is a well known TTauri star of 0.5 surrounded by a large and massive molecular disk (Guilloteau & Dutrey, 1994, 1998; Öberg et al., 2010). Dartois et al. (2003) and Piétu et al. (2007) have performed high resolution multi-transition, multi-isotope studies of CO, and demonstrated the existence of a vertical temperature gradient in the disk as well as the presence of cold gas-phase CO.
| Source | RA | DEC | Vlsr (km s-1) | Distance (pc) | Radius∗*∗*From CO observations. (AU) | ∗∗**∗∗**FWHM derived from CO observations (km s-1) | M∗ (M⊙) | Mdisk ( M⊙)∗∗∗***∗∗∗***From continuum observations (Dutrey et al., 1997; Wilner et al., 2000) assuming a dust mass absorption coeffficient cm2/g. The uncertainties are at least a factor due to the unknown dust characteristics. |
|---|---|---|---|---|---|---|---|---|
| DM Tau | 04:33:48.733 | 18:10:09.890 | 6.1 | 140 | 800 | 2 | 0.5 | 3 |
| TW Hya | 11:01:51.875 | -34:42:17.155 | 2.7 | 56 | 200 | 1 | 0.5 | 3 |
We retrieved observations of o-H2D+ toward DM Tau from the JCMT archive. The o-H2D+ line at 372.421 GHz was observed together with L1544 in January 2007 with the multi-beam receiver HARP and the ACSIS backend with a resolution of 0.03 km s-1. The source was centered in the pixel at the tracking center (H10). DM Tau was observed during about 10.75 h on source, with a system temperature of 605 K on average leading to a rms of mK (T) at a resolution of 0.03 km s-1.

Using the APEX telescope, we observed the o-H2D+ at 372.421 GHz toward TW Hya during 3.8 h on source in July and September 2010 with the new FLASH 345 receiver (the dual-polarization receiver FLASH operates a two SB SIS mixer provided by IRAM, see Maier et al., 2005). The July and September observations were carried out with different backends, leading respectively to a spectral resolution of 0.15 km s-1 and 0.06 km s-1. Data were resampled to a spectral resolution of 0.20 km s-1. As no planet was visible, the focus was checked by line pointing on RAFGL 5254 and IRAS 07454-7112, pointing was done toward the same calibrators. The rms noise is 18 mK(T) obtained after removing a constant baseline to the data at 0.2 km s-1 of resolution.

We did not detect any o-H2D+ emission in any of the sources. Assuming a Jansky-to-Kelvin (S/TA) conversion factor of 30 222 http:docs.jach.hawaii.eduJCMTHETGUIDEhet_guide for the JCMT and 41 for APEX333 http:www.apex-telescope.orgtelescopeefficiency, and presuming that the total linewidths are respectively of 2 and 1 km s-1 for DM Tau and TW Hya, we derived 1 noise level on the integrated line of 0.32 Jy km s-1 for DM Tau and 0.33 Jy km s-1 for TW Hya. We converted to flux density as the sources are unresolved.
Previous observations by Ceccarelli et al. (2004),Thi et al. (2004), and Qi et al. (2008) give a 1 rms of 1.2 Jy km s-1 for TW Hya and 0.88 Jy km s-1 for DM Tau (assuming a S/TMB conversion factor of 55 Jy/K for the CSO telescope). So, our limits on the integrated intensities are respectively 3.3 and 3.6 times better for DM Tau and TW Hya.
3 Results
To derive upper limits on the o-H2D+ column density from the non-detections, taking into account the disk structure, we used DISKFIT, a radiative transfer code optimized for disks (Piétu et al., 2007; Pavlyuchenkov et al., 2007). This code fits a parametric model to the data and the best model is determined by a minimization process. Disks can be reasonably described by a parametric model where all primary quantities are power laws functions of the radius (see Dutrey et al., 1994; Piétu et al., 2007): surface density , temperature , velocity and scale height that controls the vertical density structure. The temperature is a simple power law of the radius, no vertical gradient is taken into account. In the peculiar case of non detection, all parameters except the value of are fixed. The surface density of o-H2D+ at the reference radius (noted ) is then derived under the LTE hypothesis (valid for densities cm-3 see Parise et al., 2011, Fig.5 a). This parametric approach limits the number of assumptions on the disk structure. Table 2 presents the resulting o-H2D+ column densities distributions for several models.
For the two sources, parameters such as position, inclination, and position angle are fixed according to previous CO observations (Piétu et al., 2007; Hughes et al., 2008). Two values are adopted for the exponent of the column density distribution (i.e. flat distribution) and (i.e. surface density linearly increasing with radius) to match the results of chemical modeling (see Willacy, 2007, and this work).
Given the uncertainties on the disks thermal structure, we derived the o-H2D+ column density under two cases for each source, with low (case L) and high (case H) temperature. For DM Tau, a useful upper limit can be derived from the measurement with K and . This is an upper limit as the emission is optically thick enough to trace mainly the disk uppers layers. Less abundant isotopologues, which sample deeper in the disk, as well as other molecules (HCO+, C2H, CN and HCN, see Piétu et al., 2007; Henning et al., 2010; Chapillon et al., submitted) give lower values (10 – 15, 0 – 0.4). The law is adopted for the cold case. For TW Hya, the two temperature cases considered here ( and ) correspond to the two temperature solutions of Hughes et al. (2008).
The results are also dependent on the external radius. In the case, is chosen in agreement with CO observations (i.e. 720 AU for DM Tau and 200 AU for TW Hya). When the o-H2D+ column density increases with the radius (), the flux is dominated by the outer disk, we adopted a radius of 550 AU for DM Tau in that case. This assumption is in accordance with the “tapered edge” model (see Discussion).
| fixed parameters | 3 upper limit | |||
|---|---|---|---|---|
| T100(K) | q | Rout(AU) | p | (cm-2) |
| DM Tau | ||||
| 15 | 0.4 | 720 | 0 | |
| 15 | 0.4 | 550 | -1 | |
| 30 | 0.6 | 720 | 0 | |
| 30 | 0.6 | 550 | -1 | |
| 10 | 0.0 | 720 | 0 | (a)𝑎(a)(a)𝑎(a)footnotemark: |
| TW Hya | ||||
| 30 | 0.5 | 200 | 0 | |
| 30 | 0.5 | 200 | -1 | |
| 40 | 0.2 | 200 | 0 | |
| 40 | 0.2 | 200 | -1 | |
The derived upper limits on the o-H2D+ column density at 100 AU is about cm-2 (see Table 2 ). That is times lower than the previous estimation of cm-2 by Ceccarelli et al. (2004) on DM Tau. To make a more sensible comparison, the value of was also derived adopting the same disk parameters as Ceccarelli et al. (2004) ( K, q=0 and p=0). In that case we find cm-2, so a factor 3 lower.
Qi et al. (2008) have derived a upper limit of cm-2 on TW Hya. Our upper limit is a factor lower but because their adopted thermal structure is not given, we cannot fit the same disk model to our data.
4 Discussion
| H2 density | Temperature | |||||||||||
| Model 1 | Model 2 | Case L | Case H | |||||||||
| (cm-2) | (AU) | (AU) | (cm-2) | (AU) | (AU) | (K) | (K) | |||||
| DM Tau | 0.85 | 45 | 700 | 0.45 | 45 | 180 | 15 | 0.4 | 30 | 0.63 | ||
| TW Hya | 1.0 | 45 | 200 | 0.7 | 45 | 30 | 30 | 0.5 | 40 | 0.2 | ||
Our deep integrations show that o-H2D+ emission, if any, is actually much fainter than previously thought. In this section, we discuss the implications of our non-detections on the amount of CO remaining in gas-phase in the disks mid-plane.
To derive a lower limit on the CO abundance in the disk midplane, we make use of the time-dependent chemical code dedicated to deuterium chemistry presented in Parise et al. (2011) and calculate the o-H2D+ abundance on a grid of densities and temperatures, over several hypothesis on the local CO abundance, grain growth and ionization rate. Using a realistic density and temperature profile for the disk, we then compute the resulting column density of o-H2D+ , and compare it to the one derived from observations. We also derive the emission lines profiles for each of those disk chemical models using the radiative transfer code DISKFIT under LTE.
The chemical model was first developed to describe the deuterium chemistry at work in cold prestellar cores (Parise et al., 2011). This code takes into account all different spin states of the different molecules and ions. In particular, ortho and para H2 , H and isotopologues are considered separately, with up-to-date reaction rates from Hugo et al. (2009) and recombination rates for all ions of Pagani et al. (2009). A simple chemistry of CO and N2 is also included. The reactions are all in gas-phase except the formation of H2, HD and D2 on grains. The code is time-dependent, and the developement of deuterium fractionation was shown to be limited by the ortho-H2 to para-H2 conversion timescale (Pagani et al., 2009). In the mid-plane of protoplanetary disks, we expect that this conversion has already efficiently happened, and therefore use the steady-state abundances reached at long times.
We obtained the o-H2D+ abundance relative to H2 as a function of density and temperature. We ran the code for several values of the CO abundance (x[CO] = ). We also varied the effective grain size (a = and m). The abundance of H2D+ should also depend on the ionization, so we varied the cosmic rays ionization rate ( and s-1). The UV field is neglected, which should not be a problem as H2D+ will in any case be predominantly in the dense regions.
To estimate the o-H2D+ column densities resulting from the chemical simulations we need a model of the disk H2 density and temperature. For the surface density we adopted two different models:
-
•
the simple model where the H2 surface density is described by a power law , truncated at a given radius (), hereafter Model 1,
-
•
and a model where the H2 surface density is an exponentially tapered power law as would result from viscous spreading of the disk hereafter Model 2 (see also Hughes et al., 2008).
We adopted the same temperature law as previously, without vertical gradient. Parameters are summarized in Table 3. To derive local densities, we further assumed hydrostatic equilibrium.
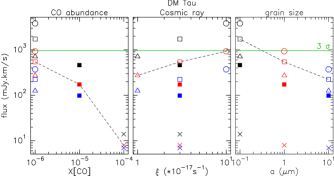
Grain size: a=0.1 m (black), 1 (red) and 10 (blue). Cosmic ray ionization rate: (triangle), (square) and s-1 (octagon). CO abundance: x[CO]= (open marker) (filled marker) and (cross). The green line corresponds to our limit derived from observations. The dashed lines illustrate the dependencies.
| o-H2D+ fluxes for s-1 | o-H2D+ fluxes for x[CO] = | ||||||||||||||||||||||||||||||||||||||||
|---|---|---|---|---|---|---|---|---|---|---|---|---|---|---|---|---|---|---|---|---|---|---|---|---|---|---|---|---|---|---|---|---|---|---|---|---|---|---|---|---|---|
|
|
||||||||||||||||||||||||||||||||||||||||
For DM Tau, the disk parameters mainly come from the analysis performed by Piétu et al. (2007). The density models are derived from the continuum observations of Guilloteau et al. (2011). Model 1 is arbitrarily extended up to an external radius of 700 AU (in agreement with CO emission).
For TW Hya, the parameters are derived from Hughes et al. (2008). Note that their “cold” case applies to the density Model 1 and the “hot” case to the Model 2.
The disks are expected to have vertical temperature gradients which we ignore in this simple modeling. As a consequence, the abundance of o-H2D+ above the mid-plane is underestimated (see for instance Asensio Ramos et al., 2007, Fig. 1). Nevertheless, as the H2 density above the mid-plane is significantly lower, the contribution of this additional layer to the total o-H2D+ column density is negligible (see Fig. 6 and 7 of Willacy, 2007). For DM Tau the two adopted temperature profiles represent two extreme cases, one only considering the low mid-plane temperature, the other using the higher values sampled by at 1-2 scale heights.
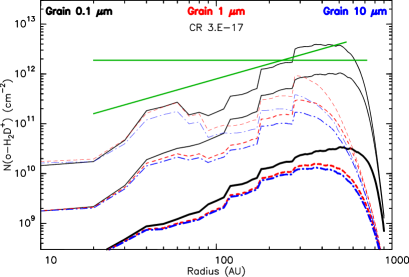
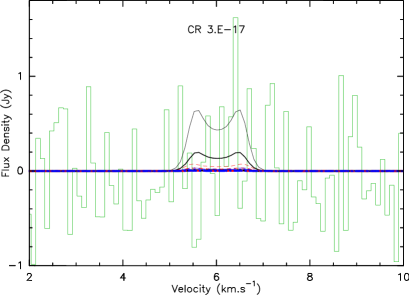
The top panel of Fig. 3 presents the distribution of the o-H2D+ column density for DM Tau, Model 2 case L and the standard value of the cosmic ray ionization s-1. All models with CO depletion show a region of high column density at R = 40–50 AU (low temperature case) or R = 150–200 AU (high temperature case). In each case, this corresponds to a kinetic temperature around 20 K. These models display also a region of low o-H2D+ column density for T15K. This is caused by the rapid evolution of the ortho/para ratio of H2D+ with temperature in this range (the ratio o/p decreases by a factor of 3 between 20K and 15K for a density of 106 cm-3, and x(CO)=10-6). This effect has already been shown in previous works, see Flower et al. (2004, their Fig. 6) and Sipilä et al. (2010, their Fig. 4). Apart from that feature (which is much more pronounced for x[CO]=0), the o-H2D+ column density increases with the radius in Model 1 (in qualitative agreement with Willacy, 2007). In Model 2 this increase is tapered off by the exponential fall of the H2 surface density. For DM Tau, the o-H2D+column density peaks around R = 550 AU where it reaches cm -2. The disk of TW Hya being small (R 200 AU), the temperature is high in the whole disk, so the o-H2D+ column density is low whatever the CO abundance (column density below cm-2 if we exclude the high ionization case) and the models are not constraining. The predicted integrated spectra for each of the models are computed using DISKFIT. The bottom panel of Fig. 3 presents the predicted spectra together with observational data for DM Tau, Model 2 case L and the standard value of the cosmic ray ionization. The predicted o-H2D+ line fluxes for DM Tau are presented in Table 4 and Fig.4. The integrated line flux seems to vary roughly like and a-0.5. The dependancy over the CO abundance is more complicated.
From Fig. 4 one can see that unless the ionization rate is very high, the current upper limits are not very stringent on the disk parameters. At best only the small grains, CO depleted by a factor 100 and s-1 case are excluded in the DM Tau case. With a CO depletion of order 10 or so, any grain size would fit the current data. The chemical models are not constraining for TW Hya.
Compared to the earlier study of Ceccarelli & Dominik (2005), which did not consider the ortho and para H2D+ separately, our chemical model including all spin-dependent reaction rates predicts column densities on average 5-10 times weaker. Accordingly, as the o-H2D+ line emission is mostly optically thin, except for the highest column densities (above a few cm-2 ), we predict flux densities 3 to 5 times lower than Asensio Ramos et al. (2007).
5 Implications for ALMA
In this section, we discuss the feasibility of observational improvements compared to the present work, using the ALMA interferometer. Figure 3 demonstrates that an increase in flux sensitivity by at the very least a factor of 10 (note that the emission is optically thin) compared to the present observations is required to secure a convincing detection of H2D+ (in the framework of the chemical models of Sect 4). An even higher sensitivity would be required to disentangle the different models. The current upper limits, obtained with single-dishes of 12 - 15 m diameter and integration times 5–10 hours, show that only larger instruments can expect detecting H2D+. ALMA is the most promising: in single-dish mode, the 50 12-m antennas will bring a gain of 7 in sensitivity compared to APEX (assuming similar receiver performances). However, in interferometric mode, even in its compact configuration, the angular resolution of the main array will be around 1′′, so that the sources will be highly resolved out. In such cases, the brightness sensitivity becomes the relevant parameter. In the beam of the current instruments, the observed discs are diluted by about a factor 3 to 4, as the APEX beam size is compared to an outer disc diameter around . However, the aperture filling factor of ALMA is only about 40 %, compared to filled aperture for APEX. Hence, in a similar integration time, and assuming similar noise performance, the ALMA brightness sensitivity should enable to reach a detection level of column densities only 2 times smaller that the current level in each ALMA synthesized beam. Further spatial smoothing would improve the sensitivity to extended structure, but only moderately, as this implies degrading the weight of the longest baselines. Using the ALMA compact array (ACA) may be more appropriate: the collecting area of the 12 7-m antennas is 4 times that of APEX, so accounting for an effective filling factor around 30-40 % also leads to similar brightness sensitivities as for the 12-m antennas compact configuration.
While detailed predictions will require proper knowledge of the ALMA performances at the difficult frequency of 372.4 GHz, these simple considerations show that o-H2D+ is unlikely to become a major “workhorse” to study e.g. the kinematics of disks.
6 Conclusion
-
•
We have improved the sensitivity to o-H2D+ by a factor 3 over previous observations. No o-H2D+ is detected, in contradiction with previous tentative detection.
-
•
With our chemical model, TW Hya is in any case too warm or not dense enough to provide detectable o-H2D+ at the current sensitivity.
-
•
The limit on DM Tau is incompatible with very high CO depletion (x[CO]) and small grains (m). However, it is not discriminant with more reasonable values of the grain sizes and/or CO abundances.
-
•
Much more sensitive observations will be required to obtain significant constraints. Even with the powerful ALMA interferometer, it will be extremely difficult to reach a sensitivity that will allow to constrain the ionization level and the amount of CO in the disk mid-planes by means of the observation of o-H2D+.
Acknowledgements.
We acknowledge Anne Dutrey for many fruitful discussions. Remo Tilanus kindly provided us with the JCMT data. E.C.,B.P. and F.D are supported by the Deutsche Forschungsgemeinschaft (DFG) under the Emmy Noether project PA 1692/1-1. S.G. acknowledges financial support by the French program PCMI from CNRS/INSU.References
- Aikawa (2007) Aikawa, Y. 2007, ApJ, 656, L93
- Aikawa & Nomura (2006) Aikawa, Y. & Nomura, H. 2006, ApJ, 642, 1152
- Asensio Ramos et al. (2007) Asensio Ramos, A., Ceccarelli, C., & Elitzur, M. 2007, A&A, 471, 187
- Bergin et al. (2007) Bergin, E. A., Aikawa, Y., Blake, G. A., & van Dishoeck, E. F. 2007, in Protostars and Planets V, ed. B. Reipurth, D. Jewitt, & K. Keil, 751–766
- Caselli et al. (2008) Caselli, P., Vastel, C., Ceccarelli, C., et al. 2008, A&A, 492, 703
- Ceccarelli & Dominik (2005) Ceccarelli, C. & Dominik, C. 2005, A&A, 440, 583
- Ceccarelli et al. (2004) Ceccarelli, C., Dominik, C., Lefloch, B., Caselli, P., & Caux, E. 2004, ApJ, 607, L51
- Chapillon et al. (submitted) Chapillon, E., Guilloteau, S., Dutrey, A., Piétu, V., & Guélin, M. submitted, submitted
- Dartois et al. (2003) Dartois, E., Dutrey, A., & Guilloteau, S. 2003, A&A, 399, 773
- Dutrey et al. (1997) Dutrey, A., Guilloteau, S., & Guelin, M. 1997, A&A, 317, L55
- Dutrey et al. (1994) Dutrey, A., Guilloteau, S., & Simon, M. 1994, A&A, 286, 149
- Flower et al. (2004) Flower, D. R., Pineau des Forêts, G., & Walmsley, C. M. 2004, A&A, 427, 887
- Guilloteau & Dutrey (1994) Guilloteau, S. & Dutrey, A. 1994, A&A, 291, L23
- Guilloteau & Dutrey (1998) Guilloteau, S. & Dutrey, A. 1998, A&A, 339, 467
- Guilloteau et al. (2011) Guilloteau, S., Dutrey, A., Piétu, V., & Boehler, Y. 2011, A&A, 529, A105+
- Guilloteau et al. (2006) Guilloteau, S., Piétu, V., Dutrey, A., & Guélin, M. 2006, A&A, 448, L5
- Henning et al. (2010) Henning, T., Semenov, D., Guilloteau, S., et al. 2010, ApJ, 714, 1511
- Hersant et al. (2009) Hersant, F., Wakelam, V., Dutrey, A., Guilloteau, S., & Herbst, E. 2009, A&A, 493, L49
- Hughes et al. (2008) Hughes, A. M., Wilner, D. J., Qi, C., & Hogerheijde, M. R. 2008, ApJ, 678, 1119
- Hugo et al. (2009) Hugo, E., Asvany, O., & Schlemmer, S. 2009, J. Chem. Phys., 130, 164302
- Maier et al. (2005) Maier, D., Barbier, A., Lazareff, B., & Schuster, K. F. 2005, in Sixteenth International Symposium on Space Terahertz Technology, 428–431
- Öberg et al. (2010) Öberg, K. I., Qi, C., Fogel, J. K. J., et al. 2010, ApJ, 720, 480
- Pagani et al. (2009) Pagani, L., Vastel, C., Hugo, E., et al. 2009, A&A, 494, 623
- Parise et al. (2011) Parise, B., Belloche, A., Du, F., Güsten, R., & Menten, K. M. 2011, A&A, 526, A31+
- Pavlyuchenkov et al. (2007) Pavlyuchenkov, Y., Semenov, D., Henning, T., et al. 2007, ApJ, 669, 1262
- Piétu et al. (2007) Piétu, V., Dutrey, A., & Guilloteau, S. 2007, A&A, 467, 163
- Qi et al. (2008) Qi, C., Wilner, D. J., Aikawa, Y., Blake, G. A., & Hogerheijde, M. R. 2008, ApJ, 681, 1396
- Semenov et al. (2005) Semenov, D., Pavlyuchenkov, Y., Schreyer, K., et al. 2005, ApJ, 621, 853
- Semenov et al. (2006) Semenov, D., Wiebe, D., & Henning, T. 2006, ApJ, 647, L57
- Sipilä et al. (2010) Sipilä, O., Hugo, E., Harju, J., et al. 2010, A&A, 509, A98+
- Thi et al. (2004) Thi, W., van Zadelhoff, G., & van Dishoeck, E. F. 2004, A&A, 425, 955
- Willacy (2007) Willacy, K. 2007, ApJ, 660, 441
- Wilner et al. (2000) Wilner, D. J., Ho, P. T. P., Kastner, J. H., & Rodríguez, L. F. 2000, ApJ, 534, L101