A method for generating realistic correlation matrices
Abstract
Simulating sample correlation matrices is important in many areas of statistics. Approaches such as generating Gaussian data and finding their sample correlation matrix or generating random uniform deviates as pairwise correlations both have drawbacks. We develop an algorithm for adding noise, in a highly controlled manner, to general correlation matrices. In many instances, our method yields results which are superior to those obtained by simply simulating Gaussian data. Moreover, we demonstrate how our general algorithm can be tailored to a number of different correlation models. Using our results with a few different applications, we show that simulating correlation matrices can help assess statistical methodology.
doi:
10.1214/13-AOAS638keywords:
, and t1Supported in part by the Institute for Pure and Applied Mathematics, NSF Grant DMS-09-31852. t2Supported in part by NSF Grant DMS-10-01614. t3Supported in part by a fellowship from the Edmond J. Safra center for Bioinformatics at Tel Aviv University.
1 Introduction
As computational resources continue to improve, researchers can take advantage of simulation studies to investigate properties and results associated with novel statistical methodology. In particular, simulating correlation matrices with or without a given structure can provide insight into the sensitivity of a model. There has been extensive work on simulating correlation matrices with random entries, that is, generating positive-semidefinite matrices with all entries bounded by and having ones along the diagonal. Seminal work by Marsaglia and Olkin (1984) discusses distributional characteristics and eigenvalues of simulated random correlation matrices. Although there has been additional work expanding the ideas associated with generating random correlation matrices [Joe (2006), Lewandowski, Kurowicka and Joe (2009), Holmes (1991), Davies and Higham (2000), Rae (1997)] and even randomly generating correlation matrices within particular settings [Ng and Joe (2010), Holmes (1989)], to our knowledge there is no literature devoted to the problem of adding noise to given template correlation structures.
We discuss the need to simulate realistic correlation matrices in a specific context. By realistic we mean not only that the correlation matrix has some prescribed structure (dependent upon the requirements of the particular application), but also that it is noisy. Below, we discuss the importance of simulating correlation matrices in probit analysis, Bayesian shrinkage estimation, meta-analysis, multiple comparisons, management science, factor analysis, heritability estimation, network analysis and classification.
In order to ensure identifiability of model parameters, covariance matrices in probit analysis on longitudinal data are often constrained to be correlation matrices. Liu and Daniels (2006) and Zhang, Boscardin and Belin (2006) discuss advantages and disadvantages of different prior distributions used with a Metropolis Hastings algorithm to sample correlation matrices from a posterior distribution.
Barnard, McCulloch and Meng (2000) use hierarchical Bayesian models to describe the covariance between parameters in a regression model with shrinkage. In practice, joint uniform and inverse-Wishart priors are used to simulate correlation matrices.
One important task in meta-analysis is to combine correlation matrices from different studies. Different methods for combining such matrices are used to make inferences about marginal correlations. Hafdahl (2007) ran a Monte Carlo study generating sample correlation matrices using Gaussian deviates from a given population correlation matrix.
One of the big challenges in developing accurate multiple comparisons techniques is knowing the underlying correlation structure of the many items being compared. Simply knowing the rate of null versus alternative tests in a given simulation does not provide enough information for realistic application to studies with possibly strongly correlated data and hypotheses. In order to model false discovery rates (FDR) in settings more realistic than i.i.d. (independent and identically distributed), Kim and van de Wiel (2008) use Gaussian deviates to simulate nested correlation matrices with constrained correlation strengths.
In order to maximize expected performance, Nelson and Goldsman (2001) use a stochastic simulation to compare a variety of management systems (e.g., queues). The authors use a modification of the method of Marsaglia and Olkin (1984) to simulate correlation matrices. Instead of generating random points on the -dimensional unit sphere, they constrain their search to the part of the unit sphere with all nonnegative coordinates (inducing nonnegative correlations).
In factor analysis, sample correlation matrices based on population correlation matrices are typically used in simulation studies. Methods which incorporate model error as well as sampling error create more realistic structures from which to model data. Hong (1999) recommends using the eigenstructure of the population correlation matrix along with random chi-square deviates to directly obtain a random sample covariance matrix, from which the sample correlation matrix can be computed.
Additionally, as we detail in Section 4, simulated correlation matrices are used to estimate heritability in Genome Wide Association Studies (GWASs) and to assess network and classification algorithms. We present work done by Lee et al. (2011) on estimating heritability without considering unknown noise in the correlation structure. Alternatively, some clustering and classification methods simulate correlations (or covariances) using uniform distributions [Kraus and Kestler (2010), Tai and Pan (2007), Huang, Tong and Zhao (2010), Kraj et al. (2008)]. However, randomly simulated univariate correlations do not typically produce matrices that are positive semidefinite. We argue that neither the no-noise strategy nor the uniform-noise strategy is realistic for assessing methodology. Our work is applicable to any context where simulating realistic correlation matrices is important.
Suppose that we are given a correlation matrix . Generating a noisy correlation matrix based upon the template can be difficult since noise must be added to in such a way that remains positive semidefinite and satisfies and for . Moreover, for numerical purposes (e.g., generating data from ) one might also require an explicit upper bound on the condition number of (see Section .1) to ensure its numerical stability (e.g., for matrix inversion). Unfortunately, naively adding random noise to a correlation matrix can result in matrices which violate any or all of the above constraints.
1.1 Simulating data for evaluating algorithms
In certain applications, it is important to have a known (or assumed) structure based on a covariance or correlation matrix. Many authors use a particular structure and simulate Gaussian data from that matrix. For example, in a recent paper, Tritchler, Parkhomenko and Beyene (2009) simulate Gaussian data to assess a method for filtering genes prior to, for example, network analysis. Their structure consists of within group correlations of 0.4 and between group correlations of 0. Using clustering to find differentially expressed genes, Hu, Qiu and Glazko (2010) generate Gaussian deviates in a two-group setting with one group of 100 observations correlated at 0.94, another group of 608 observations clustered at 0.9, and observations from different groups correlated at 0.697.
We appreciate the difficulty in generating realistic data with known structure. However, we believe that using Gaussian deviates often adds an additional unnecessary layer of assumptions. Indeed, much recent work has been applied to high-throughput data and, for example, we do not believe that microarray data have Gaussian distributions [Hardin and Wilson (2009)]. In Section 3.1 we demonstrate that our method produces matrices that are more general than the class of matrices produced by finding the sample correlation of Gaussian data. In particular, our method is able to produce Gaussian-like deviates or other distributional deviates (e.g., uniform-like deviates). Instead of simulating Gaussian data from a known correlation structure, we argue in favor of simulating correlation matrices directly based on a known correlation structure. The random correlation matrices can then be used to assess the algorithm at hand.
1.2 Three existing models
The goal of our work is to provide an algorithm for simulating correlation structures that can be used to evaluate statistical methodology in a realistic context. Instead of relying on a known structure, noise is added to the matrix to represent variability across different components of the entries. Additionally, the noise is added in a way that can represent any underlying data structure.
Below we have outlined three methods for generating correlation matrices, each of which describes different dependence structures for simulating data. Each of the three methods is taken from a different area of application (estimating heritability from GWAS, classification and network analysis). Our paper offers a flexible way to generate correlation structures given a reasonable model of what we would expect across observational units.
1.2.1 Constant correlation model
Heritability is the proportion of variability in a phenotypic characteristic which is due to genetic differences between individuals. The estimation procedure for heritability is based on a mixture model specified by a large correlation structure defining the correlations between the genetic effects of individuals in a study. These correlations are typically referred to as genetic correlations. The genetic correlation structure is then used to decompose the phenotypic variance to genetic and environmental components, resulting in an estimate of heritability.
Recent work has assumed that the genetic correlation structure is known [Lee et al. (2011)], despite estimating it from genetic data. Simulations using a known correlation structure are used to evaluate the heritability estimation algorithm. In the actual data analysis, the estimate of the correlation matrix is plugged into the algorithm as if it were the true value.
The simulation study generates genetic relationships between 10,000 individuals in the following manner: Groups of size 100 are simulated to have genetic correlations of 0.05. Uncorrelated environmental effects are added to the genetic effects. The variances of the genetic and environmental effects are predetermined by the value of heritability used in the simulation. According to the liability threshold model used by Lee et al. (2011), individuals for which the sum of effects crosses a pre-defined threshold are considered to be cases, while the rest are considered controls.
Since the prevalence of most interesting phenotypes is small, the threshold is set such that only a small fraction of the individuals in each group are considered cases. To simulate realistic case-control studies, the cases are kept along with the same number of randomly selected controls from the group, while the rest of the controls are discarded. The process is repeated until 5000 cases and 5000 controls are obtained.
Depending on the number of cases in each group, the resulting groups of genetic correlation 0.05 are as small as a few individuals or as large as 100 individuals. Genetic correlations between different groups are assumed to be zero [Lee et al. (2011)]. For future reference, we let
| (1) |
be the genetic correlation matrix for the th group of individuals, where the size of the th block matrix is a random variable (i.e., the group size), with a distribution which is defined by the parameter settings.
1.2.2 Toeplitz model
Another structure is one that models high correlation for observations which are close together in the correlation matrix and models decreasing correlation values for observations which are increasingly far away. In building a classification model, Guo, Hastie and Tibshirani (2007) describe a Toeplitz structure (sometimes referred to as an auto-regressive structure) to the correlation matrix, where adjacent pairs of observations are highly correlated, and those further away are less correlated. For future reference we let
| (2) |
be the correlation matrix for the th class, given by the base correlation value . In this model, the between group correlations are set to zero. Additional classification models have used similar Toeplitz structure for simulating data from a correlation matrix [Guo, Hastie and Tibshirani (2007), Dabney and Storey (2007), Witten and Tibshirani (2009), Zuber and Strimmer (2009), Pang, Tong and Zhao (2009), Huang, Tong and Zhao (2010)]. In fact, Huang et al. use a distribution to simulate the variance components in order to add noise to the above prescribed structure. Further, this Toeplitz correlation structure is seen in time series models where simulating correlation matrices is also important [Joe (2006), Ng and Joe (2010)]. The Toeplitz structure has been used extensively in classification and discriminant analysis as a model for group correlations
1.2.3 Hub observation model
The last model which we consider is one that is hierarchical in nature based on a single hub-observation and the relationship of each observation to that original hub. Within the context of network analysis, Horvath et al. [Zhang and Horvath (2005), Langfelder, Zhang and Horvath (2008), Langfelder and Horvath (2008)] define a structure with respect to a particular profile (or hub-observation). Each observation in a group is correlated with the hub-observation with decreasing strength (from a user supplied maximum correlation to a given minimum correlation). Additionally, groups are generated independently (i.e., with correlation zero between groups). Letting observation 1 correspond to the hub, for the th observation (), the correlation between it and the hub-observation is given by
Note that the correlation between the th observation and the hub will range from to ; the rate at which the correlations decay is controlled by the exponent (where would indicate a linear decay).
1.2.4 Overview
Motivated by the models above, we provide algorithms for adding noise to prescribed correlation matrices. We begin in Section 2 detailing algorithms for the three specific models of correlation matrices discussed above. In Section 3.1 we demonstrate the benefits of generating random deviates from the correlation matrix instead of using random deviates from a particular distribution. Section 4 gives applications of how our method can be used to assess new and standard statistical procedures. Following a brief conclusion in Section 5, we present the theoretical justifications of our algorithms in the Appendix.
2 Recipes
Using a single basic procedure (Algorithm 4 in Section .2) for adding noise to a given correlation matrix, we can take advantage of our theoretical understanding of certain known correlation structures to yield stronger results. This is carried out for the constant correlation structure (Algorithm 1 in Section 2.1), the Toeplitz correlation structure (Algorithm 2 in Section 2.2) and the hub correlation structure (Algorithm 3 in Section 2.3). Each model describes a population based on multiple groups with the same underlying structure (with different sizes and parameter values). Since the justifications of these procedures are rather involved, we defer the technical details until Appendix.
2.1 Constant correlation structure
Our first correlation structure isbased on constant correlations within each group and between each group (values of the correlation differ for each relationship). In particular, observe that the approach below yields a noisy correlation matrix which has a significant amount of noise on the off-diagonal blocks. This is clearly more realistic than simply assuming that all of these entries are zero. A detailed justification of the following algorithm can be found in Section .3 of Appendix.
Algorithm 1
Let
-
•
denote a positive integer (the number of groups) and ,
-
•
be a positive integer (the size of the th group),
-
•
(size of the desired matrix),
-
•
such that (baseline correlation in the th group),
-
•
(minimum correlation in any group),
-
•
(maximum correlation in any group),
-
•
such that (baseline noise between group),
-
•
be the matrix
(3) (correlation matrix for th group),
-
•
be the matrix having the blocks along the diagonal and zeros elsewhere,
-
•
such that (maximum entry-wise random noise),
-
•
be a positive integer (the dimension of the noise space).
Select unit vectors randomly from . The matrix defined by
| (4) |
is a correlation matrix whose condition number satisfies
| (5) |
2.2 Toeplitz correlation structure
The Toeplitz structure has been used extensively in classification, discriminant analysis and in the time series literature as a model for group correlations. In particular, the model we follow assumes that each pair of adjacent observations is highly correlated and that the correlations between the th and th observations decay exponentially with respect to . The following algorithm, whose justification can be found in Section .4 of Appendix, produces noisy correlation matrices based upon the Toeplitz template.
Algorithm 2
Let
-
•
denote a positive integer (the number of clusters) and ,
-
•
be a positive integer (the size of the th group),
-
•
(size of the desired matrix),
-
•
be such that (correlation factor in the th group),
-
•
(maximum correlation factor),
-
•
be the Toeplitz correlation matrix
(6) (correlation matrix for th group),
-
•
be the matrix having the blocks along the diagonal and zeros elsewhere,
-
•
(maximum entry-wise random noise),
-
•
be a positive integer (the dimension of the noise space).
Select unit vectors from and form the matrix whose columns are the . The matrix
| (7) |
is a correlation matrix whose entries satisfy and whose condition number satisfies
| . | (8) |
Among other things, let us remark that for typical values of [e.g., Guo, Hastie and Tibshirani (2007) let ] the noise level can be made quite large compared to most of the entries in each . This occurs because the eigenvalue estimates (66) obtained in Section .4 are remarkably strong and because the off-diagonal entries of each submatrix are small (due to exponential decay) if one is far away from the main diagonal. Thus, the approach outlined above yields a flexible method for introducing noise into the Toeplitz model. In fact, one can introduce so much noise (while still obtaining a correlation matrix with controlled condition number) that the original block-Toeplitz structure becomes difficult to discern.
2.3 Hub correlation structure
The hub correlation structure assumes a known correlation between a hub observation (typically the first observation) and each of the other observations. Moreover, one typically assumes that the correlation between the st and the th observation decays as increases.
Let us describe a typical example which has been considered frequently in the literature. Suppose that the first row (and hence column) of a correlation matrix is to consist of the prescribed values
which decrease (linearly if ) from to for . For instance, this model is considered in Horvath et al. [Zhang and Horvath (2005), Langfelder, Zhang and Horvath (2008), Langfelder and Horvath (2008)]. For the sake of simplicity, we consider the linear case and adopt a more convenient notation. Rather than specifying and , we specify only and work instead with the step size .
After specifying the first row, there are a variety of ways to generate the remainder of such a correlation matrix. Using any hub structure correlation matrix, we can find the smallest resulting eigenvalue which can be fed into Algorithm 4 of Section .2. For example, we can use a Toeplitz structure to fill out the remainder of the hub correlation matrix and, using the well-developed theory of truncated Toeplitz matrices [Böttcher and Silbermann (1999)], obtain eigenvalue bounds which can be fed directly into Algorithm 4. This approach yields the following algorithm, whose justification can be found in Section .5 of Appendix.
Algorithm 3
Let
-
•
denote a positive integer (the number of groups) and ,
-
•
be a positive integer (the size of the th group),
-
•
(size of the desired matrix),
-
•
(maximum correlation in the first row of th group),
-
•
(step size in first row/column of th group),
-
•
and (correlations between hub and observations),
-
•
be the hub-Toeplitz correlation matrix
(9) (correlation matrix for th group),
-
•
be the matrix having the blocks along the diagonal and zeros elsewhere,
-
•
( is the maximum noise level),
-
•
be a positive integer (the dimension of the noise space).
Select unit vectors from and form the matrix whose columns are the . The matrix
| (10) |
is a correlation matrix whose entries satisfy and whose condition number satisfies
| (11) |
where
| (12) | |||||
2.4 Extensions
Before proceeding, let us remark that our general Algorithm 4, which can be found in Section .2 of Appendix, is applicable to any given positive-definite correlation matrix. The amount of noise which can be added to the original matrix is determined by its smallest eigenvalue. For several specific classes of correlation matrices, one can obtain simple, but powerful, lower bounds on this lowest eigenvalue. For such correlation matrices, we have provided explicit, specialized algorithms which provide a significant amount of noise while also maintaining quantitative control over the condition number of the resulting matrix.
3 Distribution of error terms
As described above, our method uses the dot product of normalized vectors as the error terms which are added to a given correlation matrix. Below we discuss three methods for generating normalized vectors with given distributions.
[1.]
Random uniform vectors on the M-dimensional unit sphere: Consider
It is known that will be uniformly distributed on the -dimensional unit sphere [Muller (1959)]. Additionally, for vectors distributed uniformly on the unit sphere, the distribution of their dot product is well characterized [Cho (2009)]:
is the probability density function for the dot product of and . Note that if , the distribution of is of the form which gives a U-shaped distribution favoring values of closer to and 1. If , the distribution is uniform across to 1. For , the distribution function is mound shaped and converges to a Gaussian distribution for large (see below).
Random independent and identically distributed vectors: Consider two vectors generated independently from identical distributions in with mean zero,
The asymptotic distribution of is a straightforward application of the Central Limit theorem and Slutsky’s theorem.
Arbitrary distribution: Some situations may call for a particular distribution of error noise. The distribution can be controlled through the parameter as seen in equation (63).
Note that typically the error terms added to the correlation entries are of the form
If the dot product is approximately distributed with a variance of , then the variance of the error term is , resulting in a standard error of the correlation values,
| (14) |
The distribution of error terms will necessarily depend on the application. For some problems, uniform error terms may be most appropriate; for other problems, Gaussian errors will be preferable. In fact, for Gaussian data, correlations between vectors are approximately Gaussian, which may motivate a user to want to add Gaussian noise to the given correlation structure.
3.1 Comparison to a correlation matrix from Gaussian vectors
One method for generating a noisy correlation matrix is to simulate Gaussian data from an original template and then find the sample correlation matrix from the data. Varying the sample size of the generated data can create correlation matrices which are more or less variable (in magnitude). However, from Gaussian data the nature of the variability (distribution) of the resulting correlations is similar across different sample sizes—uniform or U-shaped distributions of error terms are not possible given correlations from Gaussian data. In addition, the majority of the entries in a given sample correlation matrix generated from Gaussian data are quite close to the template matrix. Only a handful of observations deviate from the template substantially. In fact, the sample size needed in order to get a large amount of variability could be smaller than the dimension of the correlation matrix (thus producing sample correlation matrices which are not positive definite).
To demonstrate the restriction associated with simulating Gaussian data as a way to find sample correlation matrices, we generate multiple correlation matrices using both Gaussian samples and our method. The Gaussian noise is created by simulating data of a particular sample size (25, 250, or 1000) from a template correlation matrix. We then compute the sample correlation matrix and find the difference between the estimate and the template; histograms of those differences describe the distribution of the correlation error terms. For example, Gauss25 was created by simulating 25 observations from a template correlation matrix. The difference between the correlations of the 25 observations and the template matrix are computed; the histograms of the differences are given in Figure 1.
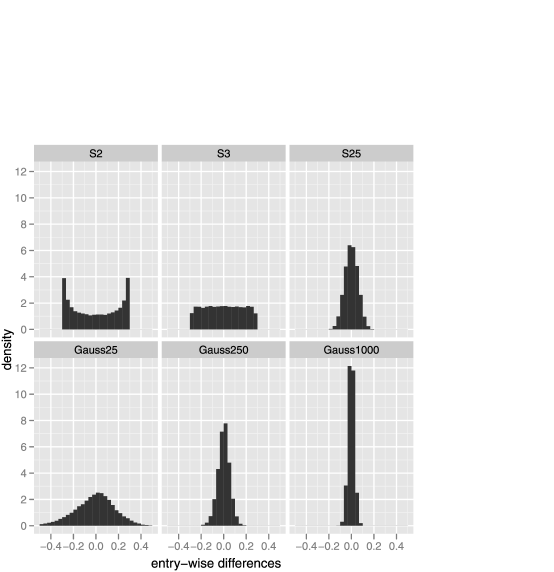
The three Gaussian structures (sample sizes 25, 250, 1000) show the same tendencies with more spread for smaller sample sizes (see Figure 1: Gauss25, Gauss250, Gauss1000). The three simulations using our method are based on uniform random vectors on the unit sphere in , and (see Table 1 for different generating scenarios). For each simulation we used a constant correlation structure with three groups of sizes ; within group correlations of ; ; and between group correlations of (see Algorithm 1 in Section .3).
Note that in our simulations below, the distribution of differences from uniform vectors in (S25) is similar to that obtained from the correlation matrix generated by sampling 250 random Gaussian vectors (Gauss250). In fact, not only can our method create correlations with univariate distributions that are similar to Gaussian deviations, but the eigenvalues of the respective matrices (ours compared with correlations from Gaussian data) are indistinguishable (results not shown).
We see that our method is able to add larger noise terms than the Gaussian simulation. Figure 1 shows the distribution of the differences. Depending on the application, one might prefer large noise components, uniform noise components or bell-shaped noise components. Our work provides a template for generating multiple different structures depending on the problem at hand.
| Template | |||||
|---|---|---|---|---|---|
| S2 | |||||
| S3 | |||||
| S25 | 7 | ||||
| Gauss25 | 25 vectors | ||||
| Gauss250 | 250 vectors | ||||
| Gauss1000 | 1000 vectors |
4 Applications
To demonstrate the effectiveness of our method, we simulate data from two applications to show that noise added to a known correlation structure can be useful in practice. It may not always be obvious which format to use to incorporate the noise; the format of the noise will be situation dependent and should be based on the underlying data structure. In Section 3.1 we have provided more details about the different noise models.
4.1 Heritability
Heritability is the proportion of variability in a phenotypic characteristic which is due to genetic differences. The understanding and estimation of heritability is of great importance in directing future studies as well as understanding the architecture of human genetic diseases such as type-1 and type-2 diabetes, Crohn’s disease, schizophrenia and bipolar disorder. The study of heritability in human disease presents the so-called “mystery” of the missing heritability [Maher (2008)]: a considerable gap between the estimated heritability as obtained from family studies and the estimated heritability as obtained from genetic studies (known as genome-wide association studies, or GWASs), with the latter estimate of heritability being considerably smaller than the former for a wide range of phenotypes.
Recently, a novel method for estimation of heritability from the genotypes of unrelated individuals was introduced by Yang et al. (2010). The method was first applied for random samples from a population [Yang et al. (2010)] and later adapted for the more relevant scenario of case-control studies [Lee et al. (2011)]. These works presented genome-based estimates of heritability that were considerably higher than previous estimates, thus bridging, at least in part, the gap between family-based and genome-based estimates of heritability. As expected, these works attracted attention and are the focus of recent research and debate [see, e.g., Golan and Rosset (2011), Lee et al. (2012)].
The central idea behind these methods is to estimate a population-wise correlation structure from the genotypes of individuals and use this estimated structure in a Restricted Maximum Likelihood (REML) estimation of the heritability. However, the REML estimation does not account for the fact that the correlation structure is estimated rather than known. Moreover, the simulations in Lee et al. (2011) use a known correlation structure to demonstrate the validity of the method, which in turn uses an estimated correlation structure. Such simulations might produce an overly optimistic evaluation of the method used to estimate heritability in terms of both bias and variance.
To demonstrate the sensitivity of the heritability estimate to the known correlation structure, we reran the simulations in Lee et al. (2011) with and without noise. As expected, adding noise to the matrix introduces bias to the estimators. Our methods provide a mechanism for understanding the behavior of heritability estimates under different correlation and error structures.
For our investigation, we are interested in estimating heritability in the setting of a binary response, in particular, we want to estimate heritability for case control studies. As done in Lee et al. (2011), we assume there is an underlying liability continuous variable (e.g., glucose level) determining the binary measured phenotype (e.g., diabetes). We can find the heritability on the observed scale (with respect to the binary disease trait) and transform it back to the value of interest, the heritability on the liability scale. The transformation considers the disease prevalence in the population [Lee et al. (2011)].
We followed the simulation procedure of Lee et al. (2011), which is outlined in Section 1.2.1. See Lee et al. (2011) for a more detailed description of the simulation procedure. Subsequently, we added noise to the correlation matrices using Algorithm 1 in Section 2.1. We used the software Genome-wide Complex Trait Analysis (GCTA) to estimate heritability and standard errors of the estimate [Yang et al. (2011)].
Results are presented in Table 2. Each table entry contains the estimated heritability of liability from our simulations with noise as well as the corresponding estimate given by Lee et al. (2011)—calculated using the known correlation structure. As expected, the more noise added to the relationship matrix, the more bias in estimating the heritability. Additionally, we see that there is a strong interaction: for low prevalence, even a small amount of error can have a large impact on the estimate of heritability. With high prevalence, moderate amounts of error can bias the estimate.
| True heritability of liability | |||||||
|---|---|---|---|---|---|---|---|
| Prevalence of disease in pop. | 0.1 | 0.3 | 0.5 | 0.7 | 0.9 | ||
| 0.10 (0.09) | 0.28 (0.28) | 0.47 (0.51) | 0.64 (0.70) | 0.80 (0.90) | |||
| 0.11 (0.11) | 0.29 (0.30) | 0.49 (0.49) | 0.70 (0.71) | 0.87 (0.89) | |||
| 0.05 (0.17) | 0.23 (0.31) | 0.37 (0.56) | 0.56 (0.75) | 0.77 (0.94) | |||
| 0.08 (0.09) | 0.23 (0.28) | 0.37 (0.51) | 0.54 (0.70) | 0.69 (0.90) | |||
| 0.06 (0.11) | 0.23 (0.30) | 0.42 (0.49) | 0.60 (0.71) | 0.78 (0.89) | |||
| 0.00 (0.17) | 0.01 (0.31) | 0.01 (0.56) | 0.02 (0.75) | 0.02 (0.94) | |||
| 0.07 (0.09) | 0.19 (0.28) | 0.35 (0.51) | 0.51 (0.70) | 0.65 (0.90) | |||
| 0.03 (0.11) | 0.16 (0.30) | 0.22 (0.49) | 0.53 (0.71) | 0.73 (0.89) | |||
| 0.01 (0.17) | 0.01 (0.31) | 0.01 (0.56) | 0.01 (0.75) | 0.01 (0.94) | |||
We run a second set of simulations to see how often we can capture the true heritability in a confidence interval using 2 SE (provided from the GCTA software) when noisy correlation matrices are used; we expect roughly 95% of the confidence intervals to capture the true heritability value. We simulated 100 heritability values from a uniform distribution. We then simulated phenotypes and a corresponding correlation matrix with error (as described previously) for each heritability. We constructed corrected CIs, using a multiplicative factor correction obtained from our first set of simulations as well as uncorrected confidence intervals, and counted the number of times these CIs contained the true heritability.
Results for the CIs are given in Table 3. Each entry gives the number of true heritabilities captured in the interval two standard errors around the adjusted estimated heritability (expected to be 95 when CIs are accurate). Our results show that neglecting to account for the effects of noise on heritability estimation resulted in problematic confidence intervals. Correcting the bias using the method described above resolved the issue for low and moderate levels of noise.
| Amount of error added to the correlation structure | ||||
| Prevalence of disease in population | ||||
| 0.5 | ||||
| 0.1 | ||||
We note that for the case of estimating heritability, the bias suggests an immediate way of choosing for proper inference. The bias is a result of the noisy estimation of the true underlying genetic correlation structure, and so can be estimated using the actual genotypes, as done by Yang et al. (2010). We thus suggest choosing such that the bias in simulations of correlation structures equals the bias estimated from the genetic data as in Yang et al. (2010). Since the bias increases with (as the signal-to-noise ratio decreases), finding the appropriate value of should be straightforward using simulations.
The example provided on estimating heritability shows that a sensitivity analysis can uncover obstacles in applying methods—which work for simulated data—to actual data collected with error. In the following section we provide an additional sensitivity analysis applied to a clustering algorithm.
4.2 Clustering
As an additional example, we consider the PAM algorithm [Kaufman and Rousseeuw (1990)] to cluster data which has known structure but different levels of noise. We use the adjusted Rand statistic [Rand (1971), Yeung and Ruzzo (2001)] to measure the degree of concordance between the clustering output and the truth. Using silhouette width, the unsupervised PAM algorithm will give the optimal number of clusters. The adjusted Rand statistic models the degree of concordance between the PAM results and the truth. An adjusted Rand of 1 indicates perfect concordance; an adjusted Rand of zero indicates a random partition. For each of the models we tested, we created the correlation matrix (including noise) using an appropriately customized algorithm.
Clustering results from simulation
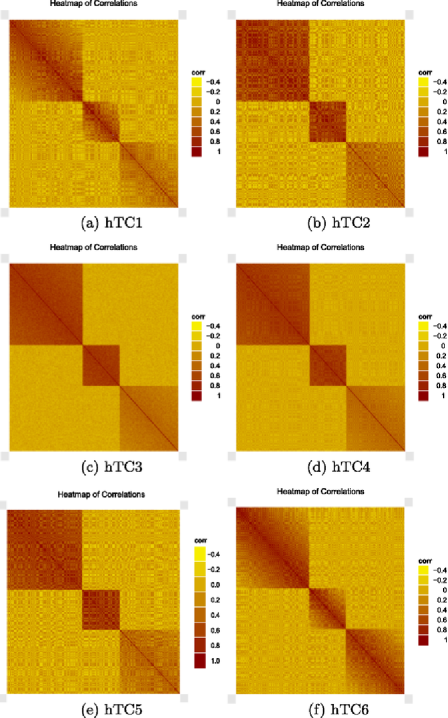
Using the hub correlation structure discussed in Section 1.2.3, we are required to choose a method to fill out the rest of the correlation matrix. We use the Toeplitz structure as discussed in Algorithm 3 with the parameter settings below. All simulations were done in the three cluster setting with groups of the following size: . Recall that with the hub-Toeplitz correlation, the correlation values descend according to some power (here linearly) from a specified maximum to a specified minimum correlation (see Figure 2):
| (a) hTC1 | |||||
|---|---|---|---|---|---|
| (b) hTC2 | |||||
| (c) hTC3 | |||||
| (d) hTC4 | |||||
| (e) hTC5 | |||||
| (f) hTC6 |
For each of the scenarios above, we simulated 1000 correlation matrices. We then clustered the data using PAM; the clustering results were assessed by determining the number of clusters the algorithm produced (truth was 3 clusters) as well as the concordance between the clustering results and the truth (1 gives perfect concordance).
| Scenario | hTC1 | hTC2 | hTC3 | hTC4 | hTC5 | hTC6 |
|---|---|---|---|---|---|---|
| min # clusters | 3 | 3 | 3 | |||
| median # clusters | 3 | 3 | 3 | |||
| max # clusters | 3 | 3 | 3 | |||
| median adj Rand | 1 | 1 | 1 |
Our results show that adding noise can create scenarios about which the algorithm is unable to determine the true structure (hTC1 and hTC2) and scenarios where the noise is not sufficient to decrease the performance of the algorithm (hTC3, hTC4 and hTC6), as well as situations that work only sometimes (hTC5) (see Table 4). For correlation structures that degrade all the way to zero (hTC1 and hTC6), the algorithm is able to discern the structure if the original correlations are large (hTC6). For correlation structures that degrade only a small amount (hTC2, hTC3, hTC4), the results are based on the amount of error and the dimension from which the noise vectors from Algorithm 3 are selected.
Clustering results on Fisher’s Iris data
As an application to real data, we consider Fisher’s Iris data [Fisher (1936)] which have been used extensively to asses discriminant and cluster analysis methods. For 50 iris specimens in each of three species, Iris setosa, I. versicolor and I. virginica, the sepal length, sepal width, petal length and petal width are measured in millimeters (see Figure 3). Though there are three species measured, I. versicolor and I. virginica are typically quite difficult to differentiate with unsupervised clustering methods [Mezzich and Solomon (1980), page 85]. Indeed, when applying the PAM algorithm to the iris data, we get a perfect separation into two groups (with the three group silhouette width being slightly smaller).
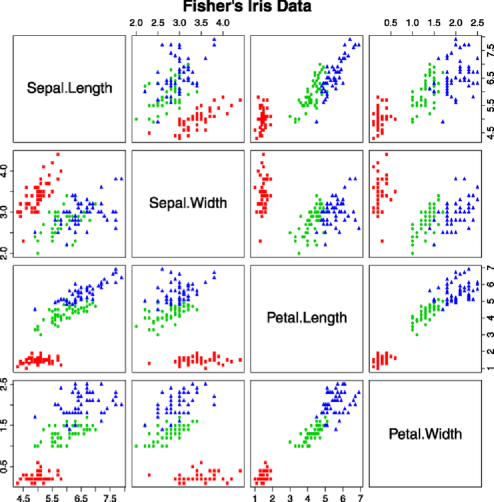
In order to assess the sensitivity of the output, we can add noise consistent with the variability of the observations. In this case, we assume that the correlations within a group are constant, and we estimate the standard error of the correlations to be approximately 0.01. Such errors might be generated by using vectors from , with . [Refer to the discussion preceding equation (14) for choice of .] Even without noise, the unsupervised PAM algorithm separates the flowers into two distinct groups (see Table 5). As would be expected with the iris data, substantially more noise is needed before the two-group structure is lost.
| Scenario | (no error) | ||||
|---|---|---|---|---|---|
| min # clusters | 2 | 2 | |||
| median # clusters | 2 | 2 | |||
| max # clusters | 2 | 2 | |||
| median adj Rand | |||||
| (2 species) | 1 | 1 |
5 Conclusion
We have developed an algorithm for adding noise, in a highly controlled manner, to a template correlation matrix in order to obtain a more realistic correlation matrix. Moreover, we have demonstrated how our general procedure can be tailored to a number of different correlation models (e.g., constant correlation, Toeplitz structure).
Our method allows for noisy correlation matrices which differ more from the initial template than the estimated correlation matrix based on simulated Gaussian data. Using Gaussian data produces a sample correlation matrix with limited and well-behaved (possibly unrealistic) differences from the original template correlation if the generated sample is large. If the generated sample is small, then the sample correlation matrix is not positive definite (i.e., most of the eigenvalues will be zero). Using uniform deviates as random correlation values produces a matrix that is in general not even positive semidefinite. It can also create relationships between observations that are meaningless (e.g., a trio of observations where the first is highly correlated to the other two, but the other two are negatively correlated).
Using a recent—though already influential—model for heritability and a standard clustering algorithm, we have shown that simulated correlation matrices can be used to assess new or existing statistical methodology. We provide the user with detailed algorithms to use on several standard clustering structures, as well as a general algorithm to apply to any correlation matrix for which the smallest eigenvalue can be reasonably estimated.
Appendix
.1 Preliminaries
Recall that if is a symmetric matrix, then each of its eigenvalues is real and, hence, we may list them in descending order
where each eigenvalue is repeated according to its multiplicity. According to this convention, is positive semidefinite if and only if and is positive definite if and only if .
The norm of a matrix is defined to be
| (57) |
which equals if is positive semidefinite. To be more specific, the expression (57) is often called the operator norm to distinguish it from other frequently used matrix norms (e.g., the Frobenius norm). The condition number [Horn and Johnson (1990), page 336] of a symmetric matrix is defined to be
In particular, if is positive semidefinite, then we have
In the following, we let denote the identity matrix and denote the matrix whose entries are all equal to .
.2 The basic algorithm
Given an prototype correlation matrix , we might wish to add noise to in a computationally efficient way such that the resulting matrix is also a correlation matrix. Furthermore, we might also require effective bounds on the condition number of to ensure that is a suitable candidate for certain numerical procedures (e.g., matrix inversion). For example, in the statistical software R, the default tolerance for detecting linear dependencies in the columns of a matrix is a condition number . The following simple procedure accomplishes this task.
Algorithm 4
Let {longlist}[1.]
be a given correlation matrix,
( is the maximum noise level),
be a positive integer (the dimension of the noise space). Select unit vectors from and form the matrix whose columns are the . The matrix
| (58) |
is a correlation matrix whose entries satisfy for and whose condition number satisfies
| (59) |
We might also desire that for some fixed , which depends upon the particular requirements of the software being employed. From (59), it is easy to see that any satisfying the additional constraint
| (60) |
yields an such that .
Justification of Algorithm 4 Let so that
and note that is symmetric and positive semidefinite [i.e., ]. Moreover, is positive definite if and only if the are linearly independent [Horn and Johnson (1990), Theorem 7.2.10].
Now recall that Geršgorin’s Disk theorem [Horn and Johnson (1990), Theorem 6.1.1] asserts that if is a matrix, then for each eigenvalue of there exists a corresponding index such that
By Geršgorin’s theorem and Cauchy–Schwarz, it follows that every eigenvalue of satisfies
whence for .
We next define by (58) and observe that is of the form
| (61) |
In particular, is our original matrix with “noise” terms of magnitude at most added to the off-diagonal entries. To analyze the impact of adding this noise, we require Weyl’s Inequalities [Horn and Johnson (1990), Theorem 4.3.1], which assert that if and are symmetric matrices, then
| (62) |
for . Applying the lower inequality in (62) with , and , we obtain
from which we conclude that is positive definite. Next, we apply the upper inequality in (62) with , which yields
Putting this all together, we obtain the estimates
The inequality (59) follows since .
There are several arguments which can be made in favor of adding noise in this manner. First of all, the procedure described above is easy to implement numerically, and it can be rapidly executed. Moreover, it offers a great deal of flexibility since the dimension of the ambient space that the vectors are drawn from and the manner in which these vectors are selected is arbitrary and can be tailored to the particular application at hand. Finally, our method is completely general in the sense that any positive-definite matrix having constant diagonal can be factored as where is some matrix whose columns are unit vectors (e.g., let be the positive-semidefinite square root of ). In other words, regardless of the method one employs to produce a positive-semidefinite matrix for use in (58), the same can in principle be generated using our approach.
Let us now say a few words about the manner in which the vectors are selected. If is very small (e.g., ), then many of the dot products will be large in magnitude. For many purposes, this yields a very noisy coefficient matrix based upon the original template . Moreover, even if is relatively large, then the matrix can be computed extremely rapidly since generating the unit vectors and computing the dot products involve straightforward computations (e.g., no eigenvalue calculations).
There are of course many other ways which one could select the . If one wishes the to be consistently large in magnitude while also ensuring that has full rank, one lets and then selects numbers at random from using a continuous probability density function on which favors extreme values (e.g., , or a Beta distribution transformed to exist on the range ). One then replaces the numbers in (61) by
| (63) |
In effect, one is replacing the with the unit vectors . These vectors tend to have high negative or positive correlations (but they are linearly independent) since the numbers favor extreme values in the interval .
.3 Justification of Algorithm 1
In order to introduce a significant amount of noise to the off-diagonal blocks, we work instead with the modified correlation matrix
| (64) |
where denotes the matrix whose entries are all . Since
it follows that
| (65) |
and that the eigenspace corresponding to the largest eigenvalue of is spanned by the vector . In particular, the eigenspace corresponding to the eigenvalue is -dimensional and any eigenvector belonging to this eigenspace is orthogonal to (i.e., satisfies ).
If we augment by placing zeros appropriately, we obtain a vector
which is an eigenvector of corresponding to the eigenvalue since and . It follows that the lowest eigenvalues of are the numbers , each repeated times. In particular,
An upper bound on the eigenvalues of follows from (62) and (65):
Plugging the matrix into Algorithm 4 and using the preceding estimates for and into (59), we obtain the desired estimate (5) for .\qed
.4 Justification of Algorithm 2
Using the spectral theory of self-adjoint Toeplitz operators, it is possible to show that is positive definite and that its eigenvalues satisfy
| (66) |
for . We also remark that the preceding bounds are quite sharp in the sense that
| (67) |
as the size of the matrix tends to infinity. In light of the explicit bounds (66), a straightforward application of Algorithm 4 yields the following procedure.
To justify the crucial inequalities (66) and the limits (67), first observe that the Toeplitz matrix
| (68) |
is simply the upper-left corner of the infinite Toeplitz matrix
| (69) |
which induces a linear operator on the Hilbert space of all square-summable infinite sequences. Since the th entry of is the th complex Fourier coefficient of the function defined by
we conclude from Böttcher and Silbermann (1999), Theorem 1.9, that is a bounded self-adjoint operator whose spectrum equals the range of [Halmos (1982), Problem 250] [note that is the so-called Poisson kernel from the study of harmonic functions]. A short calculus exercise reveals that achieves its maximum value at and its minimum value at (see Figure 4),
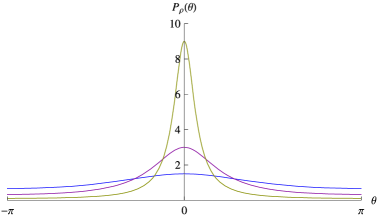
from which we conclude that the spectrum of is precisely the closed interval . By Böttcher and Silbermann (1999), Proposition 2.17, it follows that the eigenvalues of are also contained in this interval. This establishes the inequalities (66). The limiting behavior (67) follows immediately from Böttcher and Silbermann (1999), Theorem 5.14.\qed
.5 Justification of Algorithm 3
By Geršgorin’s Disk theorem Horn and Johnson (1990), Theorem 6.11, the largest eigenvalue of satisfies
This immediately yields (12). On the other hand, it is possible to show that the smallest eigenvalue of satisfies
| (70) |
To be brief, one regards the original Toeplitz matrix as the upper-left principal submatrix of a symmetric circulant matrix, the eigenvalues of which can be exactly computed using well-known techniques [Böttcher and Grudsky (2005), page 32]. A series of elementary but tedious algebraic manipulations and a standard eigenvalue interlacing result [Böttcher and Grudsky (2005), Theorem 9.19] yield the desired inequality (70), from which (LABEL:eq-EVSmall) follows. We thank A. Böttcher, the author of Böttcher and Grudsky (2005), Böttcher and Silbermann (1999), for suggesting this approach to us.
[id=suppA] \stitleR code \slink[doi]10.1214/13-AOAS638SUPP \sdatatype.r \sfilenameaoas638_supp_rcode.r \sdescriptionR code for functions available at http://pages.pomona.edu/~jsh04747/research/simcor.r.
References
- Barnard, McCulloch and Meng (2000) {barticle}[mr] \bauthor\bsnmBarnard, \bfnmJohn\binitsJ., \bauthor\bsnmMcCulloch, \bfnmRobert\binitsR. and \bauthor\bsnmMeng, \bfnmXiao-Li\binitsX.-L. (\byear2000). \btitleModeling covariance matrices in terms of standard deviations and correlations, with application to shrinkage. \bjournalStatist. Sinica \bvolume10 \bpages1281–1311. \bidissn=1017-0405, mr=1804544 \bptokimsref \endbibitem
- Böttcher and Grudsky (2005) {bbook}[mr] \bauthor\bsnmBöttcher, \bfnmAlbrecht\binitsA. and \bauthor\bsnmGrudsky, \bfnmSergei M.\binitsS. M. (\byear2005). \btitleSpectral Properties of Banded Toeplitz Matrices. \bpublisherSIAM, \blocationPhiladelphia, PA. \biddoi=10.1137/1.9780898717853, mr=2179973 \bptokimsref \endbibitem
- Böttcher and Silbermann (1999) {bbook}[mr] \bauthor\bsnmBöttcher, \bfnmAlbrecht\binitsA. and \bauthor\bsnmSilbermann, \bfnmBernd\binitsB. (\byear1999). \btitleIntroduction to Large Truncated Toeplitz Matrices. \bpublisherSpringer, \blocationNew York. \biddoi=10.1007/978-1-4612-1426-7, mr=1724795 \bptokimsref \endbibitem
- Cho (2009) {barticle}[mr] \bauthor\bsnmCho, \bfnmEungchun\binitsE. (\byear2009). \btitleInner product of random vectors. \bjournalInt. J. Pure Appl. Math. \bvolume56 \bpages217–221. \bidissn=1311-8080, mr=2571302 \bptokimsref \endbibitem
- Dabney and Storey (2007) {barticle}[pbm] \bauthor\bsnmDabney, \bfnmAlan R.\binitsA. R. and \bauthor\bsnmStorey, \bfnmJohn D.\binitsJ. D. (\byear2007). \btitleOptimality driven nearest centroid classification from genomic data. \bjournalPLoS ONE \bvolume2 \bpagese1002. \biddoi=10.1371/journal.pone.0001002, issn=1932-6203, pmcid=1991588, pmid=17912341 \bptokimsref \endbibitem
- Davies and Higham (2000) {barticle}[mr] \bauthor\bsnmDavies, \bfnmPhilip I.\binitsP. I. and \bauthor\bsnmHigham, \bfnmNicholas J.\binitsN. J. (\byear2000). \btitleNumerically stable generation of correlation matrices and their factors. \bjournalBIT \bvolume40 \bpages640–651. \biddoi=10.1023/A:1022384216930, issn=0006-3835, mr=1799307 \bptokimsref \endbibitem
- Fisher (1936) {barticle}[author] \bauthor\bsnmFisher, \bfnmR. A.\binitsR. A. (\byear1936). \btitleThe use of multiple measurements in taxonomic problems. \bjournalAnnals of Eugenics \bvolume7 \bpages179–188. \bptokimsref \endbibitem
- Golan and Rosset (2011) {barticle}[pbm] \bauthor\bsnmGolan, \bfnmDavid\binitsD. and \bauthor\bsnmRosset, \bfnmSaharon\binitsS. (\byear2011). \btitleAccurate estimation of heritability in genome wide studies using random effects models. \bjournalBioinformatics \bvolume27 \bpagesi317–i323. \biddoi=10.1093/bioinformatics/btr219, issn=1367-4811, pii=btr219, pmcid=3117387, pmid=21685087 \bptokimsref \endbibitem
- Guo, Hastie and Tibshirani (2007) {barticle}[pbm] \bauthor\bsnmGuo, \bfnmYaqian\binitsY., \bauthor\bsnmHastie, \bfnmTrevor\binitsT. and \bauthor\bsnmTibshirani, \bfnmRobert\binitsR. (\byear2007). \btitleRegularized linear discriminant analysis and its application in microarrays. \bjournalBiostatistics \bvolume8 \bpages86–100. \biddoi=10.1093/biostatistics/kxj035, issn=1465-4644, pii=kxj035, pmid=16603682 \bptokimsref \endbibitem
- Hafdahl (2007) {barticle}[author] \bauthor\bsnmHafdahl, \bfnmAdam\binitsA. (\byear2007). \btitleCombing correlation matrices: Simulation analysis of improved fixed-effects methods. \bjournalJournal of Educational and Behavioral Statistics \bvolume32 \bpages180–205. \bptokimsref \endbibitem
- Halmos (1982) {bbook}[mr] \bauthor\bsnmHalmos, \bfnmPaul Richard\binitsP. R. (\byear1982). \btitleA Hilbert Space Problem Book, \bedition2nd ed. \bseriesGraduate Texts in Mathematics \bvolume19. \bpublisherSpringer, \blocationNew York. \bidmr=0675952 \bptokimsref \endbibitem
- Hardin and Wilson (2009) {barticle}[author] \bauthor\bsnmHardin, \bfnmJ.\binitsJ. and \bauthor\bsnmWilson, \bfnmJ.\binitsJ. (\byear2009). \btitleA note on oligonucleotide expression values not being normally distributed. \bjournalBiostatistics \bvolume10 \bpages446–450. \bptokimsref \endbibitem
- Hardin, Garcia and Golan (2013) {bmisc}[auto] \bauthor\bsnmHardin, \bfnmJohanna\binitsJ., \bauthor\bsnmGarcia, \bfnmStephan Ramon\binitsS. R. and \bauthor\bsnmGolan, \bfnmDavid\binitsD. (\byear2013). \bhowpublishedSupplement to “A method for generating realistic correlation matrices.” DOI:\doiurl10.1214/13-AOAS638SUPP. \bptokimsref \endbibitem
- Holmes (1989) {barticle}[mr] \bauthor\bsnmHolmes, \bfnmR. B.\binitsR. B. (\byear1989). \btitleOn random correlation matrices. II. The Toeplitz case. \bjournalComm. Statist. Simulation Comput. \bvolume18 \bpages1511–1537. \biddoi=10.1080/03610918908812837, issn=0361-0918, mr=1046545 \bptokimsref \endbibitem
- Holmes (1991) {barticle}[mr] \bauthor\bsnmHolmes, \bfnmR. B.\binitsR. B. (\byear1991). \btitleOn random correlation matrices. \bjournalSIAM J. Matrix Anal. Appl. \bvolume12 \bpages239–272. \biddoi=10.1137/0612019, issn=0895-4798, mr=1089158 \bptokimsref \endbibitem
- Hong (1999) {barticle}[author] \bauthor\bsnmHong, \bfnmSehee\binitsS. (\byear1999). \btitleGenerating correlation matrices with model error for simulation studies in factor analysis: A combination of the Tucker–Koopman–Linn model and Wijsman’s algorithm. \bjournalBehavior Research Methods, Instruments & Computers \bvolume31 \bpages727–730. \bptokimsref \endbibitem
- Horn and Johnson (1990) {bbook}[mr] \bauthor\bsnmHorn, \bfnmRoger A.\binitsR. A. and \bauthor\bsnmJohnson, \bfnmCharles R.\binitsC. R. (\byear1990). \btitleMatrix Analysis. \bpublisherCambridge Univ. Press, \blocationCambridge. \bidmr=1084815 \bptokimsref \endbibitem
- Hu, Qiu and Glazko (2010) {barticle}[author] \bauthor\bsnmHu, \bfnmRui\binitsR., \bauthor\bsnmQiu, \bfnmXing\binitsX. and \bauthor\bsnmGlazko, \bfnmGalina\binitsG. (\byear2010). \btitleA new gene selection procedure based on the covariance distance. \bjournalBioinformatics \bvolume25 \bpages348–354. \bptokimsref \endbibitem
- Huang, Tong and Zhao (2010) {barticle}[mr] \bauthor\bsnmHuang, \bfnmSong\binitsS., \bauthor\bsnmTong, \bfnmTiejun\binitsT. and \bauthor\bsnmZhao, \bfnmHongyu\binitsH. (\byear2010). \btitleBias-corrected diagonal discriminant rules for high-dimensional classification. \bjournalBiometrics \bvolume66 \bpages1096–1106. \biddoi=10.1111/j.1541-0420.2010.01395.x, issn=0006-341X, mr=2758497 \bptokimsref \endbibitem
- Joe (2006) {barticle}[mr] \bauthor\bsnmJoe, \bfnmHarry\binitsH. (\byear2006). \btitleGenerating random correlation matrices based on partial correlations. \bjournalJ. Multivariate Anal. \bvolume97 \bpages2177–2189. \biddoi=10.1016/j.jmva.2005.05.010, issn=0047-259X, mr=2301633 \bptokimsref \endbibitem
- Kaufman and Rousseeuw (1990) {bbook}[mr] \bauthor\bsnmKaufman, \bfnmLeonard\binitsL. and \bauthor\bsnmRousseeuw, \bfnmPeter J.\binitsP. J. (\byear1990). \btitleFinding Groups in Data: An Introduction to Cluster Analysis. \bpublisherWiley, \blocationNew York. \biddoi=10.1002/9780470316801, mr=1044997 \bptokimsref \endbibitem
- Kim and van de Wiel (2008) {barticle}[pbm] \bauthor\bsnmKim, \bfnmKyung In\binitsK. I. and \bauthor\bparticlevan de \bsnmWiel, \bfnmMark A.\binitsM. A. (\byear2008). \btitleEffects of dependence in high-dimensional multiple testing problems. \bjournalBMC Bioinformatics \bvolume9 \bpages114. \biddoi=10.1186/1471-2105-9-114, issn=1471-2105, pii=1471-2105-9-114, pmcid=2375137, pmid=18298808 \bptokimsref \endbibitem
- Kraj et al. (2008) {barticle}[author] \bauthor\bsnmKraj, \bfnmPiotr\binitsP., \bauthor\bsnmSharma, \bfnmAshok\binitsA., \bauthor\bsnmGarge, \bfnmNikhil\binitsN., \bauthor\bsnmPodolsky, \bfnmRobert\binitsR. and \bauthor\bsnmMcIndoe, \bfnmRichard A.\binitsR. A. (\byear2008). \btitleParaKMeans: Implementation of a parallelized K-means algorithm suitable for general laboratory use. \bjournalBMC Bioinformatics \bvolume9 \bpages200. \bptokimsref \endbibitem
- Kraus and Kestler (2010) {barticle}[pbm] \bauthor\bsnmKraus, \bfnmJohann M.\binitsJ. M. and \bauthor\bsnmKestler, \bfnmHans A.\binitsH. A. (\byear2010). \btitleA highly efficient multi-core algorithm for clustering extremely large datasets. \bjournalBMC Bioinformatics \bvolume11 \bpages169. \biddoi=10.1186/1471-2105-11-169, issn=1471-2105, pii=1471-2105-11-169, pmcid=2865495, pmid=20370922 \bptokimsref \endbibitem
- Langfelder and Horvath (2008) {barticle}[author] \bauthor\bsnmLangfelder, \bfnmPeter\binitsP. and \bauthor\bsnmHorvath, \bfnmSteve\binitsS. (\byear2008). \btitleWGCNA: An R package for weighted correlation network analysis. \bjournalBMC Bioinformatics \bvolume9 \bpages559. \bptokimsref \endbibitem
- Langfelder, Zhang and Horvath (2008) {barticle}[author] \bauthor\bsnmLangfelder, \bfnmPeter\binitsP., \bauthor\bsnmZhang, \bfnmBin\binitsB. and \bauthor\bsnmHorvath, \bfnmSteve\binitsS. (\byear2008). \btitleDefining clusters from a hierarchical cluster tree: The Dynamic Tree Cut package for R. \bjournalBioinformatics \bvolume24 \bpages719–720. \bptokimsref \endbibitem
- Lee et al. (2011) {barticle}[pbm] \bauthor\bsnmLee, \bfnmSang Hong\binitsS. H., \bauthor\bsnmWray, \bfnmNaomi R.\binitsN. R., \bauthor\bsnmGoddard, \bfnmMichael E.\binitsM. E. and \bauthor\bsnmVisscher, \bfnmPeter M.\binitsP. M. (\byear2011). \btitleEstimating missing heritability for disease from genome-wide association studies. \bjournalAm. J. Hum. Genet. \bvolume88 \bpages294–305. \biddoi=10.1016/j.ajhg.2011.02.002, issn=1537-6605, pii=S0002-9297(11)00020-6, pmcid=3059431, pmid=21376301 \bptokimsref \endbibitem
- Lee et al. (2012) {bmisc}[pbm] \bauthor\bsnmLee, \bfnmS. Hong\binitsS. H., \bauthor\bsnmDeCandia, \bfnmTeresa R.\binitsT. R., \bauthor\bsnmRipke, \bfnmStephan\binitsS., \bauthor\bsnmYang, \bfnmJian\binitsJ., \borganizationSchizophrenia Psychiatric Genome-Wide Association Study Consortium (PGC-SCZ), \borganizationInternational Schizophrenia Consortium (ISC), \borganizationMolecular Genetics of Schizophrenia Collaboration (MGS), \bauthor\bsnmSullivan, \bfnmPatrick F.\binitsP. F., \bauthor\bsnmGoddard, \bfnmMichael E.\binitsM. E., \bauthor\bsnmKeller, \bfnmMatthew C.\binitsM. C., \bauthor\bsnmVisscher, \bfnmPeter M.\binitsP. M. and \bauthor\bsnmWray, \bfnmNaomi R.\binitsN. R. (\byear2012). \bhowpublishedEstimating the proportion of variation in susceptibility to schizophrenia captured by common SNPs. Nat. Genet. 44 247–250. \bptokimsref \endbibitem
- Lewandowski, Kurowicka and Joe (2009) {barticle}[mr] \bauthor\bsnmLewandowski, \bfnmDaniel\binitsD., \bauthor\bsnmKurowicka, \bfnmDorota\binitsD. and \bauthor\bsnmJoe, \bfnmHarry\binitsH. (\byear2009). \btitleGenerating random correlation matrices based on vines and extended onion method. \bjournalJ. Multivariate Anal. \bvolume100 \bpages1989–2001. \biddoi=10.1016/j.jmva.2009.04.008, issn=0047-259X, mr=2543081 \bptokimsref \endbibitem
- Liu and Daniels (2006) {barticle}[mr] \bauthor\bsnmLiu, \bfnmXuefeng\binitsX. and \bauthor\bsnmDaniels, \bfnmMichael J.\binitsM. J. (\byear2006). \btitleA new algorithm for simulating a correlation matrix based on parameter expansion and reparameterization. \bjournalJ. Comput. Graph. Statist. \bvolume15 \bpages897–914. \biddoi=10.1198/106186006X160681, issn=1061-8600, mr=2297634 \bptokimsref \endbibitem
- Maher (2008) {barticle}[pbm] \bauthor\bsnmMaher, \bfnmBrendan\binitsB. (\byear2008). \btitlePersonal genomes: The case of the missing heritability. \bjournalNature \bvolume456 \bpages18–21. \biddoi=10.1038/456018a, issn=1476-4687, pii=456018a, pmid=18987709 \bptokimsref \endbibitem
- Marsaglia and Olkin (1984) {barticle}[mr] \bauthor\bsnmMarsaglia, \bfnmGeorge\binitsG. and \bauthor\bsnmOlkin, \bfnmIngram\binitsI. (\byear1984). \btitleGenerating correlation matrices. \bjournalSIAM J. Sci. Statist. Comput. \bvolume5 \bpages470–475. \biddoi=10.1137/0905034, issn=0196-5204, mr=0740861 \bptokimsref \endbibitem
- Mezzich and Solomon (1980) {bbook}[author] \bauthor\bsnmMezzich, \bfnmJuan E.\binitsJ. E. and \bauthor\bsnmSolomon, \bfnmHerbert\binitsH. (\byear1980). \btitleTaxonomy and Behavioral Science. \bpublisherAcademic Press, \blocationSan Diego, CA. \bptokimsref \endbibitem
- Muller (1959) {barticle}[author] \bauthor\bsnmMuller, \bfnmMervin\binitsM. (\byear1959). \btitleA note on a method for generating points uniformly on N-dimensional spheres. \bjournalCommunications of the ACM \bvolume2 \bpages19–20. \bptokimsref \endbibitem
- Nelson and Goldsman (2001) {barticle}[author] \bauthor\bsnmNelson, \bfnmBarry L.\binitsB. L. and \bauthor\bsnmGoldsman, \bfnmDavid\binitsD. (\byear2001). \btitleComparisons with a standard in simulation experiments. \bjournalManagement Science \bvolume47 \bpages449–463. \bptokimsref \endbibitem
- Ng and Joe (2010) {barticle}[mr] \bauthor\bsnmNg, \bfnmChi Tim\binitsC. T. and \bauthor\bsnmJoe, \bfnmHarry\binitsH. (\byear2010). \btitleGenerating random and Toeplitz correlation matrices. \bjournalJ. Multivariate Anal. \bvolume101 \bpages1532–1545. \biddoi=10.1016/j.jmva.2010.01.013, issn=0047-259X, mr=2609512 \bptokimsref \endbibitem
- Pang, Tong and Zhao (2009) {barticle}[mr] \bauthor\bsnmPang, \bfnmHerbert\binitsH., \bauthor\bsnmTong, \bfnmTiejun\binitsT. and \bauthor\bsnmZhao, \bfnmHongyu\binitsH. (\byear2009). \btitleShrinkage-based diagonal discriminant analysis and its applications in high-dimensional data. \bjournalBiometrics \bvolume65 \bpages1021–1029. \biddoi=10.1111/j.1541-0420.2009.01200.x, issn=0006-341X, mr=2756489 \bptokimsref \endbibitem
- Rae (1997) {barticle}[author] \bauthor\bsnmRae, \bfnmGordon\binitsG. (\byear1997). \btitleA FORTRAN 77 program for generating sample correlation matrices. \bjournalEduc. Psychol. Meas. \bvolume57 \bpages189–192. \bptokimsref \endbibitem
- Rand (1971) {barticle}[author] \bauthor\bsnmRand, \bfnmW. M.\binitsW. M. (\byear1971). \btitleObjective criteria for the evaluation of clustering methods. \bjournalJ. Amer. Statist. Assoc. \bvolume66 \bpages846–850. \bptokimsref \endbibitem
- Tai and Pan (2007) {barticle}[pbm] \bauthor\bsnmTai, \bfnmFeng\binitsF. and \bauthor\bsnmPan, \bfnmWei\binitsW. (\byear2007). \btitleIncorporating prior knowledge of gene functional groups into regularized discriminant analysis of microarray data. \bjournalBioinformatics \bvolume23 \bpages3170–3177. \biddoi=10.1093/bioinformatics/btm488, issn=1367-4811, pii=btm488, pmid=17933851 \bptokimsref \endbibitem
- Tritchler, Parkhomenko and Beyene (2009) {barticle}[pbm] \bauthor\bsnmTritchler, \bfnmDavid\binitsD., \bauthor\bsnmParkhomenko, \bfnmElena\binitsE. and \bauthor\bsnmBeyene, \bfnmJoseph\binitsJ. (\byear2009). \btitleFiltering genes for cluster and network analysis. \bjournalBMC Bioinformatics \bvolume10 \bpages193. \biddoi=10.1186/1471-2105-10-193, issn=1471-2105, pii=1471-2105-10-193, pmcid=2708160, pmid=19549335 \bptokimsref \endbibitem
- Witten and Tibshirani (2009) {barticle}[mr] \bauthor\bsnmWitten, \bfnmDaniela M.\binitsD. M. and \bauthor\bsnmTibshirani, \bfnmRobert\binitsR. (\byear2009). \btitleCovariance-regularized regression and classification for high dimensional problems. \bjournalJ. R. Stat. Soc. Ser. B Stat. Methodol. \bvolume71 \bpages615–636. \biddoi=10.1111/j.1467-9868.2009.00699.x, issn=1369-7412, mr=2749910 \bptokimsref \endbibitem
- Yang et al. (2010) {barticle}[pbm] \bauthor\bsnmYang, \bfnmJian\binitsJ., \bauthor\bsnmBenyamin, \bfnmBeben\binitsB., \bauthor\bsnmMcEvoy, \bfnmBrian P.\binitsB. P., \bauthor\bsnmGordon, \bfnmScott\binitsS., \bauthor\bsnmHenders, \bfnmAnjali K.\binitsA. K., \bauthor\bsnmNyholt, \bfnmDale R.\binitsD. R., \bauthor\bsnmMadden, \bfnmPamela A.\binitsP. A., \bauthor\bsnmHeath, \bfnmAndrew C.\binitsA. C., \bauthor\bsnmMartin, \bfnmNicholas G.\binitsN. G., \bauthor\bsnmMontgomery, \bfnmGrant W.\binitsG. W., \bauthor\bsnmGoddard, \bfnmMichael E.\binitsM. E. and \bauthor\bsnmVisscher, \bfnmPeter M.\binitsP. M. (\byear2010). \btitleCommon SNPs explain a large proportion of the heritability for human height. \bjournalNat. Genet. \bvolume42 \bpages565–569. \biddoi=10.1038/ng.608, issn=1546-1718, mid=NIHMS337920, pii=ng.608, pmcid=3232052, pmid=20562875 \bptokimsref \endbibitem
- Yang et al. (2011) {barticle}[author] \bauthor\bsnmYang, \bfnmJ.\binitsJ., \bauthor\bsnmLee, \bfnmS. H.\binitsS. H., \bauthor\bsnmGoddard, \bfnmM. E.\binitsM. E. and \bauthor\bsnmVisscher, \bfnmP. M.\binitsP. M. (\byear2011). \btitleGCTA: A tool for genome-wide complex trait analysis. \bjournalAmerican Journal of Human Genetics \bvolume88 \bpages76–82. \bptokimsref \endbibitem
- Yeung and Ruzzo (2001) {barticle}[pbm] \bauthor\bsnmYeung, \bfnmK. Y.\binitsK. Y. and \bauthor\bsnmRuzzo, \bfnmW. L.\binitsW. L. (\byear2001). \btitlePrincipal component analysis for clustering gene expression data. \bjournalBioinformatics \bvolume17 \bpages763–774. \bidissn=1367-4803, pmid=11590094 \bptokimsref \endbibitem
- Zhang, Boscardin and Belin (2006) {barticle}[mr] \bauthor\bsnmZhang, \bfnmXiao\binitsX., \bauthor\bsnmBoscardin, \bfnmW. John\binitsW. J. and \bauthor\bsnmBelin, \bfnmThomas R.\binitsT. R. (\byear2006). \btitleSampling correlation matrices in Bayesian models with correlated latent variables. \bjournalJ. Comput. Graph. Statist. \bvolume15 \bpages880–896. \biddoi=10.1198/106186006X160050, issn=1061-8600, mr=2297633 \bptokimsref \endbibitem
- Zhang and Horvath (2005) {barticle}[mr] \bauthor\bsnmZhang, \bfnmBin\binitsB. and \bauthor\bsnmHorvath, \bfnmSteve\binitsS. (\byear2005). \btitleA general framework for weighted gene co-expression network analysis. \bjournalStat. Appl. Genet. Mol. Biol. \bvolume4 \bpagesArt. 17, 45 pp. (electronic). \biddoi=10.2202/1544-6115.1128, issn=1544-6115, mr=2170433 \bptokimsref \endbibitem
- Zuber and Strimmer (2009) {barticle}[pbm] \bauthor\bsnmZuber, \bfnmVerena\binitsV. and \bauthor\bsnmStrimmer, \bfnmKorbinian\binitsK. (\byear2009). \btitleGene ranking and biomarker discovery under correlation. \bjournalBioinformatics \bvolume25 \bpages2700–2707. \biddoi=10.1093/bioinformatics/btp460, issn=1367-4811, pii=btp460, pmid=19648135 \bptokimsref \endbibitem