Ultra-Compact Dwarfs in the Fossil Group NGC 113211affiliation: Based on observations made with the NASA/ESA Hubble Space Telescope, obtained at the Space Telescope Science Institute, which is operated by AURA, Inc., under NASA contract NAS5-26555. These observations are associated with program 10558.
Abstract
Eleven Ultra-Compact Dwarf (UCD) and 39 extended star cluster candidates are found to be associated with the galaxy NGC 1132. This giant elliptical galaxy is the remnant of a fossil group. UCD and extended star cluster candidates are identified through the analysis of their structural parameters, colors, spatial distribution, and luminosity using deep Hubble Space Telescope observations in two filters: the F475W (Sloan ) and F850LP (Sloan ). The median effective radius of these UCDs is pc. Two types of UCDs are identified in the vicinity of NGC 1132, one type shares the same color and luminosity of the brightest globular clusters and traces the onset of the mass-size relation. The second kind of UCD is represented by the brightest UCD candidate, a M32-type object, with an effective radius of pc, located at kpc from the nucleus of NGC 1132. This UCD candidate is likely the remaining nucleus of a minor merger with the host galaxy. With the exception of a particularly blue UCD candidate, UCDs are found to extend the mass-metallicity relation found in globular clusters to higher luminosities. The results of this work support the growing body of evidence showing that UCDs are not circumscribed to galaxy clusters as previously thought. UCDs are likely to be a common occurrence in all environments. The milder tidal field of a fossil group, when compared to a galaxy cluster, allows UCDs and extended star clusters to survive up to present time at small galactocentric distances.
Subject headings:
galaxies: star clusters - galaxies: elliptical and lenticular, cD - galaxies: clusters: general - galaxies: dwarf - galaxies: groups: individual (NGC 1132)1. Introduction
Ultra-Compact Dwarfs are low mass stellar systems with properties in between those of bright globular clusters and the most compact dwarf elliptical galaxies. Since their discovery UCDs have been linked to galaxy clusters. Initially found in the Fornax cluster (Hilker et al. 1999; Drinkwater et al. 2000) UCDs have been reported in Virgo, Centaurus, Hydra, Coma and the more distant clusters Abell S040 and Abell 1689 (Hasegan et al. 2005; Evstigneeva et al. 2008; Chilingarian & Mamon 2008; Mieske et al. 2004, 2007; Wehner & Harris 2007; Misgeld et al. 2008; Madrid et al. 2010; Blakeslee & Barber DeGraaff 2008).
The search for UCDs has been focused in galaxy clusters and observations seeking to discover UCDs in other environments are critically needed to understand their formation process and to determine how common these low mass stellar systems truly are. Only recent accounts of UCDs outside galaxy clusters with spectroscopic confirmation exist in the literature. Evstigneeva et al. (2007) search for UCDs in six galaxy groups using ground based data and found only one definite candidate in the Dorado group. Romanowsky et al. (2009) describe UCDs in the galaxy group of NGC 1407 while Hau et al. (2009) find a UCD located in the vicinity of the Sombrero Galaxy, a low density environment. Da Rocha et al. (2011) give a detailed account of the UCDs present in two Hickson compact groups. Recently, and after discovering UCDs in field (NGC 4546) and group (NGC 3923) environments Norris & Kannappan (2011) claim the ubiquity of UCDs in galaxies with populous globular cluster systems (GCS).
A search for UCDs is undertaken in the isolated giant elliptical NGC 1132. This galaxy is likely the only remnant of a merged galaxy group, or fossil group. Fossil groups have a defining characteristic gap of two magnitudes between the brightest galaxy and the second brightest galaxy. The temperature, metallicity, and luminosity of the X-ray halo surrounding NGC 1132 are similar to those of galaxy groups (Mulchaey & Zabludoff 1999). Analysis of the Millenium Simulation (Springel et al. 2005) show that fossil groups assembled their dark matter halos early, accumulating 80% of the present day mass 4 Gyr ago (Dariush et al. 2007). The absence of parent galaxies and thus lack of substructure in fossil groups has been debated as a possible challenge to the CDM paradigm, similar to the missing galaxy problem of the Local Group (Sales et al. 2007 and references therein).
Fossil groups are dynamically evolved environments and due to their early assembly and their fast evolution the dominant galaxy has had time to accrete the most massive surrounding galaxies through dynamical friction (Mulchaey & Zabludoff 1999). Dwarf galaxies are exempt from the consequences of dynamical friction given that this effect is proportional to the mass of the satellite galaxy. Also, given that ram pressure stripping is milder in a fossil group than in the core of a galaxy cluster, UCDs formed by downsizing dwarf galaxies (Bekki et al. 2003) are expected to survive up to the present day in fossil groups.
This work uses the same method employed by Madrid et al. 2010 (hereafter Paper I) to determine the presence of UCDs in the Coma Cluster. The brightest UCD candidates reported in Paper I have been spectroscopically confirmed by Chiboucas et al. (2010) using the Keck telescope. The fainter end of the luminosity distribution of UCD candidates presented in Paper I lacks spectroscopy confirmation simply due to the onerous challenge of obtaining their spectra at the Coma distance.
Collobert et al. (2006) give a redshift of for NGC 1132, and distance modulus of (m-M)=34.86 mag equivalent to a luminosity distance of 99.5 Mpc using H0=71 km.s-1Mpc-1, , and (Wright 2006).
2. Data and reductions
The observations of NGC 1132 are carried out with the Advanced Camera for Surveys Wide Field Channel (ACS/WFC) on 2006 August 22. The data is acquired in two bands: , similar to Sloan , and , Sloan (Mack et al. 2003). Four exposures are obtained in each band for a total exposure time of 4446 in and 6885 in . The pixel scale of the ACS/WFC is /pixel (23pc/pixel) and the physical scale of the field of view is kpc at the distance of NGC 1132. The same physical scale is covered in the study of Paper I.
Eight flatfielded science images (flt.fits) are retrieved from the public archive hosted at the Space Telescope Science Institute. These files are pre-processed through the standard pipeline that corrects bias, dark current, and flatfield (Sirianni et al. 2005). The pyraf task multidrizzle is used to combine the different exposures within the same filter, remove cosmic rays, and perform distortion correction.
Detection of sources is carried out with SExtractor (Bertin & Arnouts 1996) using a detection threshold of 3 above the background. A careful round of visual inspection allows for the discarding of contaminants such as background galaxies. As recently shown by the Galaxy Zoo project the human eye remains a powerful tool to discriminate between different types of galaxy morphology (Lintott et al. 2011).
As in Paper I the empirical point spread function (PSF) is created by running the pyraf tasks pstselect, psf, and seepsf. These tasks respectively select bright unsaturated stars from the image, build the PSF by fitting an analytical model (Moffat function), and subsample the PSF as required by the software used to determine the structural parameters.
3. Analysis
3.1. Structural Parameters
Structural parameters are determined using ISHAPE (Larsen 1999). This specialized software convolves the PSF with an analytical model of the surface brightness profile of slightly resolved stellar structures such as globular clusters and yields their effective radius, ellipticity, position angle, signal-to-noise ratio, and an estimate of the goodness of fit. An important parameter to consider when studying low mass stellar systems in different environments is the effective radius or half-light radius (). A King profile (King 1962, 1966) with a concentration parameter, or tidal to core radius, of c=30 is the most suitable analytical model for fitting the surface brightness profile of globular clusters and UCDs (see Paper I). The structural parameters of 1649 point-like sources are derived in both bands. The values of structural parameters quoted hereafter are those corresponding to the band given its longer exposure time. This filter is also a better tracer of the mass of globular clusters and UCDs.
3.2. Photometry
Photometry is performed using an aperture of 4 pixel in radius with the task phot within the daophot package of pyraf, aperture correction is applied using the formulas of Sirianni et al. (2005). Photometric measurements are obtained for all 1649 stellar objects identified as globular clusters and UCD candidates in the ACS images of NGC 1132.
Foreground extinction for NGC 1132 is mag (from NED), the specific extinction corrections applied to each HST filter are obtained following the prescriptions of Sirianni et al. (2005) which give mag and mag. Up-to-date photometric zeropoints for ACS/WFC are obtained from the STScI website: , . These zeropoints yield magnitudes in the Vega magnitude system.
3.3. Selection Criteria
UCDs are selected based on their color, magnitude and structural parameters. A metallicity break found by Mieske et al. (2006) at the onset of the luminosity-size relation sets at the luminosity cutoff to distinguish between simply bright globular clusters and UCDs. At the distance of NGC 1132 this luminosity requirement translates to 22.3 mag, this value is obtained using calcphot within the synphot package of stsdas (Laidler et al. 2005). In color, UCD candidates must be in the same range defined by the globular cluster system, this is shown in the next section to be
In size, UCDs are conventionally, but arbitrarily, defined as stellar systems having an effective radius between 10 and 100 parsecs (see Paper I and references therein). UCDs must be consistently resolved in both bands, at the distance of 100 Mpc this condition is satisfied for sources with pc with the deep images analyzed in this work.
In photometric studies, and as a safeguard against contamination by background galaxies, the ellipticity of UCDs is expected to be between and (Blakeslee & Barber de Graff 2008, Paper I). All UCD candidates fall within that range of ellipticity. Additionally, a signal-to-noise ratio of is a requirement for obtaining a reliable estimate of structural parameters with ISHAPE (Harris 2009).
4. Results
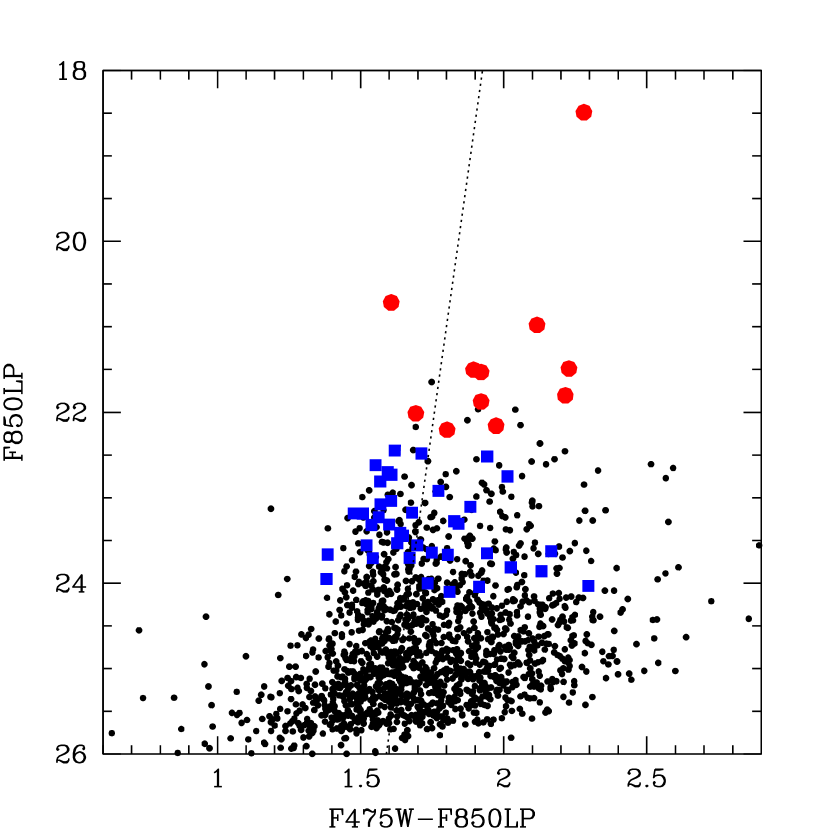
The Color-Magnitude Diagram (CMD) of the globular cluster system associated with NGC 1132 is used to define the parameter space where UCDs are expected to be present, a detailed analysis of this CMD is not the aim of this paper. For most globular clusters ( of them) their colors are in the range and their magnitudes between as shown in Figure 1. This broad color range translates into a metallicity range of given by the color-metallicity transformation of Peng et al. (2006). The deduced metallicity range is in agreement with previous metallicity estimates of UCDs (Mieske et al. 2004, Evstigneeva et al. 2007).
The vast majority of 1649 globular clusters and UCD candidates identified in the ACS images remain unresolved or their is too low to obtain a truly reliable estimate of their structural parameters. However, 11 sources satisfy the color, magnitude, size, and criteria outlined above to be classified as UCD candidates. The effective radii of these 11 UCD candidates range from 77.1 pc, for the largest and brightest candidate, to 8.5 pc. The median effective radius for UCDs is pc with a standard deviation of pc. Excluding the brightest candidate brings these numbers to pc and pc. All 11 UCD candidates have a and are plotted as red dots in the color-magnitude diagram of Figure 1. In color and magnitude most UCDs overlap with the brightest globular clusters, the very same is the case for UCDs in the core of the Coma cluster, i. e. they share the same parameter space of the brightest globular clusters associated with NGC 4874 (Paper I).
4.1. A M32 equivalent
The brightest UCD candidate is a M32-like object located, in projection, 6.6 kpc away from the center of the galaxy. Its effective radius is pc, its magnitude , or two magnitudes brighter than the second brightest UCD candidate, and its is color particularly red . In the framework of a dual formation mechanism for UCDs proposed by Da Rocha et al. (2011) and Norris & Kannappan (2011) this candidate is the remaining nucleus of a stripped companion of NGC 1132 due to the clear gap of two magnitudes between the brightest globular clusters and this UCD. This object is similar to SDSS J124155.3+114003.7, the UCD reported by Chilingarian & Mamon (2008) at a distance of 9 kpc from M59.
As stated by Norris & Kannappan (2011) no globular cluster system has a luminosity function continuously extending up to such high luminosity. As shown in Paper I, not even the extremely rich globular cluster system of NGC 4874 in the core of the Coma cluster has members with magnitudes similar to the brightest UCD candidate. This object was catalogued by the Two Micron All Sky Survey as 2MASS-02525121-0116193, its K band magnitude is mag (Skrutskie et al. 2006).
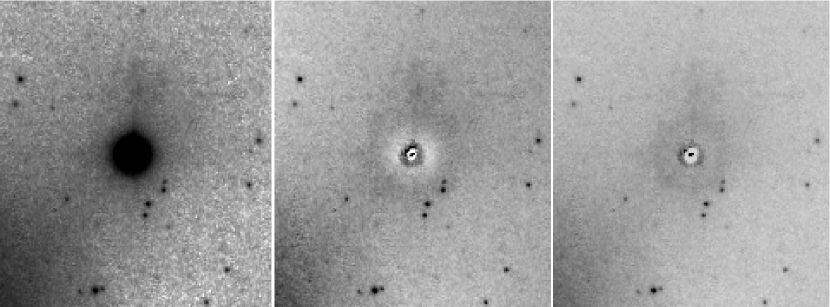
A size estimate for the M32 counterpart was also carried out with galfit (Peng et al. 2002) using a Sersic model with an initial Sersic index of (Sersic 1968). Using galfit the best fit for this object has a reduced =1.008 and yields , and pc. The original image of the brightest UCD and the residual after model subtraction with both galfit and ishape is given in Figure 2. The best fit of two different analytical models and different software leaves a small residual in the core. Similar residuals are found by Price et al. (2009) studying several compact elliptical galaxies in the core of the Coma Cluster. The brightest UCD candidate is comparable, but slightly smaller than the compact elliptical galaxies studied by Price et al. (2009) which have effective radii of pc. This object is also fainter than the Price compact ellipticals which have magnitudes ranging from to mag. Photometric and structural parameters of the eleven UCD candidates are presented in Table 1.
4.2. Extended Star Clusters
An additional 39 sources are positively resolved in both bands and have effective radii between 8.2 pc and 59.7 pc, with a median pc. While these sources have the size characteristic of UCDs their magnitudes fall short of the minimum threshold for the selection criteria. These extended stellar systems have received several denominations, here we refer to them as extended star clusters. Extended star clusters are plotted as blue squares on the CMD of Figure 1. Even if these extended star clusters are not as bright as UCDs, in luminosity some of these objects are comparable to Centauri.
5. Spatial Distribution
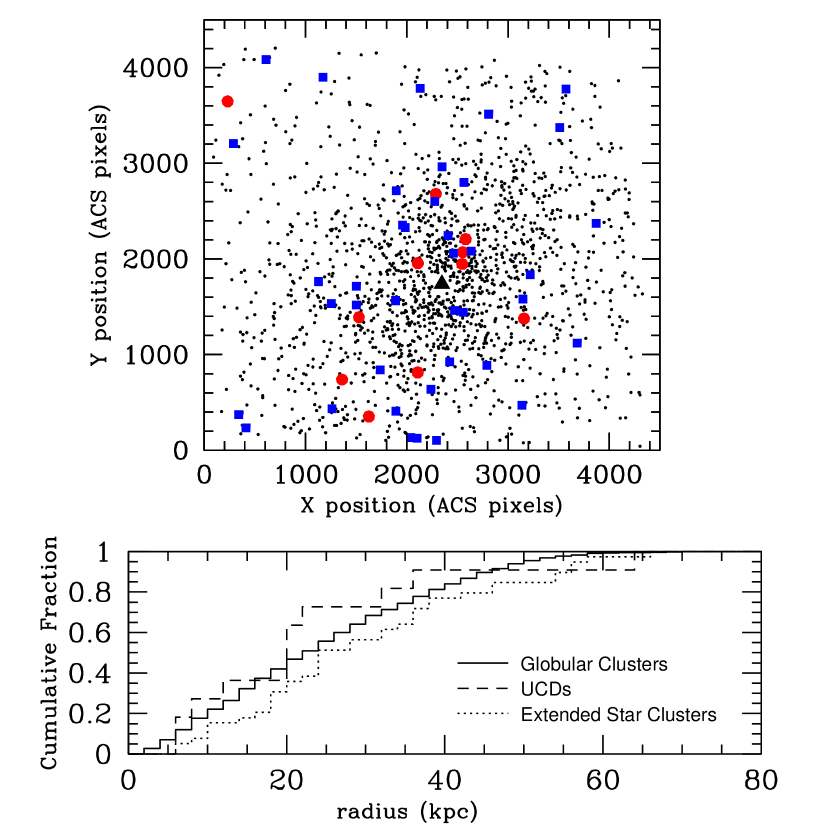
The position of globular clusters, extended star clusters, and UCDs on the ACS frame are plotted in the top panel of Figure 3. All these low-mass stellar systems congregate towards the central elliptical arguing against background contamination, this is also shown in the bottom panel. Five UCDs and seven extended star clusters are found within the inner 12 kpc (in projection) to the center of the galaxy. In Paper I no UCDs were found within the inner 15 kpc of the center of NGC 4874. As noted in the introduction a milder tidal field and ram pressure stripping within a fossil group can allow UCDs and extended star clusters to survive up to the present day at small galactocentric distances.
| (pc) | S/N | Color | ||
|---|---|---|---|---|
| 77.1 | 0.09 | 1168 | 18.49 | 2.28 |
| 23.2 | 0.11 | 323 | 20.72 | 1.61 |
| 13.3 | 0.22 | 287 | 20.98 | 2.12 |
| 9.6 | 0.16 | 164 | 21.49 | 2.23 |
| 19.8 | 0.37 | 213 | 21.50 | 1.89 |
| 16.7 | 0.05 | 190 | 21.53 | 1.92 |
| 8.5 | 0.25 | 166 | 21.80 | 2.22 |
| 13.0 | 0.10 | 153 | 21.88 | 1.92 |
| 9.2 | 0.08 | 133 | 22.01 | 1.69 |
| 9.6 | 0.12 | 89 | 22.16 | 1.97 |
| 9.9 | 0.33 | 95 | 22.21 | 1.80 |
Note. — Column 1: effective radius in pc measured in the F850LP band; Column 2: ellipticity; Column 3: signal-to-noise ratio; Column 4: F850LP magnitude; Column 5: F475W-F850LP color.
6. Magnitude-Size relation, Mass-Metallicity relation
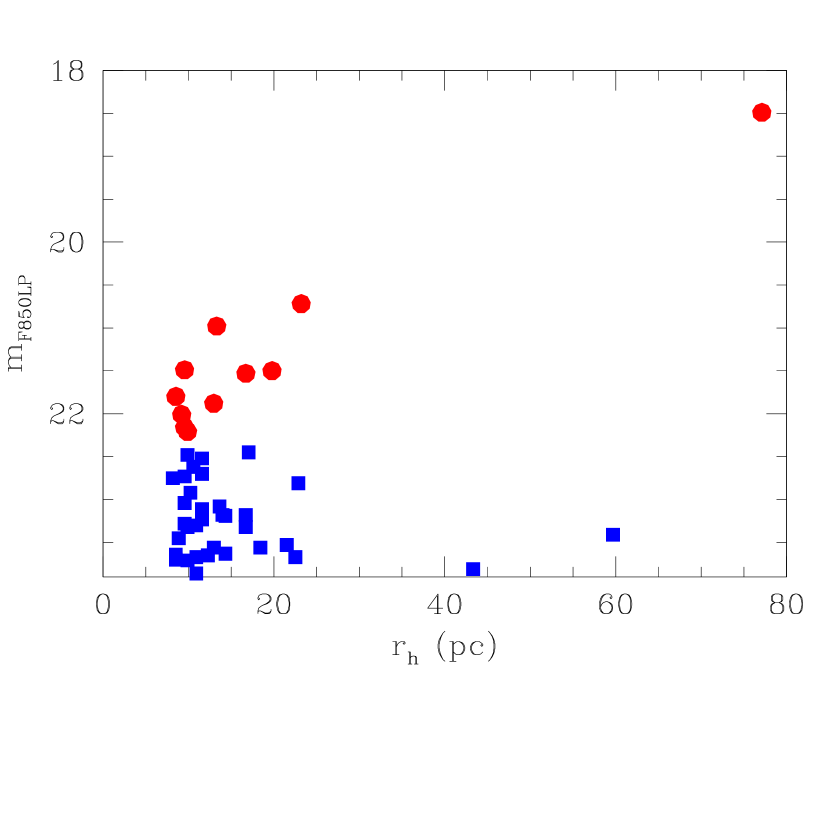
One of the defining characteristics of UCDs is their magnitude-size relation. UCDs are the smallest stellar systems that show a correlation between luminosity (or mass) and size (Hasegan et al. 2005), with masses of these objects are indeed at the onset of this relation. In Figure 4 the magnitude-size relation for the 11 UCD candidates plotted as red cirlces is evident. Magnitude and for the 11 UCDs in Figure 4 have a Spearman rank correlation coefficient of . The correlation is not perfect (i. e. ) due to the scatter characteristic of such plots. No magnitude-size correlation is found for extended star clusters, with , these objects are plotted as blue squares in Figure 4. The effective radius of globular clusters with masses below do not show any correlation with luminosity either, with a coefficient of derived by McLaughlin (2000), that is, almost completely uncorrelated (i. e. ).
A second correlation for stellar systems with masses of and above is the mass-metallicity relation (MMR, Harris et al. 2006, Strader et al. 2006). UCDs also obey this relation. The MMR is evident in two simple ways in the CMD of Figure 1. At the distance of NGC 1132 ( Mpc) the paradigmatic bimodality of GCS is blurred, however if we consider the measurements presented by Da Rocha et al. (2011) for GCS of compact groups at lower redshift the color of the metal-poor subpopulation of globular clusters is . In the CMD of Figure 1 blue globular clusters do not extend to luminosities higher than . With only one exception, no clusters or extended objects are found to have the colors of blue globular clusters and luminosities higher than . The second brightest UCD, located 20.6 kpc away from the galaxy center, is exceptionally blue (F475W-F850LP)=1.61 and stands out of the MMR.
A second manifestation of the MMR quantified in a simple way is the median color of UCDs and
extended star clusters. Self-enrichment models (Bailin & Harris 2009) predict that more massive
(and bigger) objects migrate in color towards the red. UCDs that are more massive than extended
globular clusters have indeed redder colors on average. The median color for UCDs is
with while the median color for extended globular clusters
is . The brightest UCD candidate is also the reddest with a
color of , this is in agreement with the findings of
Norris & Kannappan (2011). In contrast, the largest extended globular cluster with
has a blue color with . UCDs extend the MMR to brighter magnitudes
than the end of the globular cluster luminosity function.
7. Discussion
In Paper I and in this study two highly evolved environments with fundamentally different densities are probed: the Core of the Coma Cluster, the richest galaxy cluster of the nearby Universe and an isolated elliptical galaxy in a fossil group. Both systems exhibit similar characteristics of their UCD population with the exception that UCDs are present at small galactocentric distance (projected) in the fossil group and not in the galaxy cluster.
The presence of UCDs at the bright tip of the globular cluster systems of elliptical galaxies appears independent of environment. Given also the evidence given by the works cited in Section 1 on the presence of UCDs outside galaxy clusters it is natural to believe that UCDs are commonly present in all environments. The results of this work support the thesis put forward by Norris & Kannappan (2011) on the ubiquity of UCDs in galaxies with populous globular cluster systems irrespective of environment.
Only the superior resolution of the Hubble Space Telescope allows for the determination of the structural parameters of UCDs in the local Universe. Evstigneeva et al. (2007) searched for UCDs in five galaxy groups to no avail using ground based data. The fact that UCDs escaped detection for almost a decade while HST was operational is not a coincidence. HST can resolve UCDs only at relatively low redshift (D tens to hundreds of Mpc) however at these distances first and second generation instruments onboard HST (e.g. WFPC2) have small field of views that only cover physical scales of kpc. UCDs are difficult to find within the innermost 10 kpc of the host galaxy (Paper I, Bekki et al. 2003, Da Rocha et al. 2011) not only due to the crowding produced by starlight but also due to the destructive effects of the tidal field of the host galaxy (Bekki et al. 2003). An artificial maximum luminosity cutoff usually used in globular cluster studies has also certainly contributed to under-reporting of UCDs in the past (Norris & Kannappan 2011).
Spectroscopic confirmation of the UCD candidates presented in this work is needed and will be actively sought with a 10m telescope.
References
- Bailin (2009) Bailin, J. & Harris, W. E. 2009, ApJ, 695, 1082
- Bertin (1996) Bertin, E., & Arnouts, S. 1996, A&AS, 117, 393
- Blakeslee & Barber de Graaff (2008) Blakeslee, J. P. & Barber de Graaff, R. 2008, AJ, 136, 2295
- Bekki et al. (2003) Bekki, K., Couch, W. J., Drinkwater, M. J., & Shioya, Y. 2003, MNRAS, 344, 399
- Collobert et al. (2006) Collobert, M., Sarzi, M., Davies, R. L., Kuntschner, H. & Colless, M. 2006, MNRAS, 370, 1213
- Chiboucas (2010) Chiboucas, K. et al. 2010, ApJ, 723, 251
- Chilingarian (2008) Chilingarian I. V. & Mamon, G. A. 2008, MNRAS, 385, L83
- Da Rocha (2011) Da Rocha, C., Mieske, S., Georgiev, I. Y., Hilker, M., Ziegler, B. L., & Mendes de Oliviera, C. 2011, A&A, 525, A86
- Dariush (2007) Dariush, A., Khosroshahi, H. G., Ponman, T. J., Pearce, F., Raychaudhury, S., & Hartley, W. 2007, MNRAS, 382, 433
- Drinkwater (2000) Drinkwater, M. J. et al. 2000, PASA, 17, 227
- Evstigneeva et al. (2007) Evstigneeva, E. A., Drinkwater, M. J., Jurek, R., Firth, P., Jones, J. B., Gregg, M. D., & S. Phillipps, S. 2007, MNRAS, 378, 1036
- Evstigneeva et al. (2007) Evstigneeva, E. A., Gregg, M. D., Drinkwater, M. J., & Hilker, M 2007, AJ, 133, 1722
- Evstigneevaetal (2008) Evstigneeva, E. A. et al. 2008, AJ, 136, 461
- Harris et al. (2006) Harris, W. E., Whitmore, B. C., Karakla, D., Okon, W., Baum, W. A., Hanes, D. A., & Kavelaars, J. J. 2006, ApJ, 636, 90
- Harris (2009) Harris, W. E. 2009, ApJ, 699, 254
- Hasegan et al. (2005) Hasegan, M., et al. 2005, ApJ, 627, 203
- Hau (2009) Hau, G. K., et al. 2009, MNRAS, 394, L97
- Hilker (1999) Hilker, M., et al. 1999, A&AS, 134, 75
- King (1962) King, I. R. 1962, AJ, 67, 471
- King (1966) King, I. R. 1966, AJ, 71, 64
- Laidler et al (2005) Laidler, V. et al. 2005, Synphot User’s Guide, Version 5.0 (Baltimore, MD: STScI)
- Larsen (1999) Larsen, S. S. 1999, A&AS, 139, 393
- Lintott et al. (2011) Lintott, C. et al. 2011, MNRAS, 410, 166
- Mack (2003) Mack, J. et al. 2003, ACS Data Handbook, Version 2.0, Baltimore, STScI
- McLaughlin (2000) McLaughlin, D. E. 2000, ApJ, 539, 618
- Madrid et al. (2010) Madrid, J. P., et al. 2010, ApJ, 722, 1707 (Paper I)
- Mieske (2004) Mieske, S., et al. 2004, AJ, 128, 1529
- Mieske (2006) Mieske, S., et al. 2006, AJ, 131, 2442
- Mieske (2007) Mieske, S., et al. 2007, A&A, 472, 111
- Misgeld (2008) Misgeld, I., Mieske, S., & Hilker, M. 2008, A&A, 486, 697
- Mulchaey & Zabludoff (1999) Mulchaey, J. S. & Zabludoff, A. I. 1999, ApJ, 514, 133
- Norris & Kannappan (2011) Norris, M. A. & Kannappan, S. J. 2011, astro-ph 1102.0001
- Peng et al (2002) Peng, C. Y., Ho, L. C., Impey, C. D., Rix, H-W. 2002, AJ, 124, 266
- Peng et al (2006) Peng, E. W. et al. 2006, ApJ, 639, 95
- Peng et al (2009) Peng, E. W. et al. 2009, ApJ, 703, 42
- Price (2009) Price, J. et al. 2009, MNRAS, 397, 1816
- Romanowsky (2009) Romanowsky, A. J. et al. 2009, AJ, 137, 4956
- Sales et al (2007) Sales, L. V., Navarro, J. F., Lambas, D. G., White, S. D. M., Croton, D. J. 2007, MNRAS, 382, 1901
- Sersic (1968) Sérsic, J.L. 1968, Atlas de Galaxias Australes (Córdoba: Obs. Astronóm.)
- Sirianni (2005) Sirianni, M., et al. 2005, PASP, 117, 1049
- Skrutskie (2006) Skrutskie, M., F., et al. 2006, AJ, 131, 1163
- Springel et al. (2005) Springel, V., et al. 2005, Nature, 435, 629
- Strader et al. (2006) Strader, J., Brodie, J. P., Spitler, L., & Beasley, M. A. 2006, AJ, 132, 1593
- Wehner (2007) Wehner, E. M. H. & Harris, W. E. 2007, ApJ, 668, L35
- Wright (2006) Wright, E. L. 2006, PASP, 118, 1711