Spatial distribution and evolution of the stellar populations and candidate star clusters in the Blue Compact Dwarf I Zwicky 18111Based on observations with the NASA/ESA Hubble Space Telescope, obtained at the Space Telescope Science Institute, which is operated by AURA Inc., under NASA contract NAS 5-26555.
Abstract
The evolutionary properties and spatial distribution of I Zwicky 18 stellar populations are analyzed by means of HST/ACS deep and accurate photometry. The comparison of the resulting Colour-Magnitude diagrams with stellar evolution models indicates that stars of all ages are present in all the system components, including objects possibly up to 13 Gyr old, intermediate age stars and very young ones. The Colour-Magnitude diagrams show evidence of thermally pulsing asymptotic giant branch and carbon stars. Classical and ultra-long period Cepheids, as well as long period variables have been measured. About 20 objects could be unresolved star clusters, and are mostly concentrated in the North-West (NW) portion of the Main Body (MB). If interpreted with simple stellar population models, these objects indicate a particularly active star formation over the past hundred Myr in IZw 18.
The stellar spatial distribution shows that the younger ones are more centrally concentrated, while old and intermediate age stars are distributed homogeneously over the two bodies, although more easily detectable at the system periphery. The oldest stars are best visible in the Secondary Body (SB) and in the South East (SE) portion of the MB, where crowding is less severe, but are present also in the rest of the MB, although measured with larger uncertainties. The youngest stars are a few Myr old, are located predominantly in the MB and mostly concentrated in its NW portion. The SE portion of the MB appears to be in a similar, but not as young evolutionary stage as the NW, while the SB stars are older than at least 10 Myr. There is then a sequence of decreasing age of the younger stars from the Secondary Body to the SE portion of the MB to the NW portion.
All our results suggest that IZw18 is not atypical compared to other BCDs.
Subject headings:
galaxies: evolution — galaxies: stellar content — galaxies: dwarfs — galaxies: individual (IZw18)1. Introduction
I Zwicky 18 (also Mrk 116 or UGCA 166, hereafter IZw18) is the most intriguing Blue Compact Dwarf (BCD) galaxy in the local Universe. It became famous right after its discovery, when Searle & Sargent (1972) measured from its emission-line spectrum an oxygen abundance [O/H]= –1.14 dex, only 7 of the solar value, indicating an almost unprocessed gas content. The first studies on its color and composition (Sargent & Searle, 1970; Searle & Sargent, 1972; Searle et al., 1973) emphasized its almost primordial evolutionary status. IZw18 shows very blue colors, UB and BV (van Zee et al., 1998), suggesting the presence of a very young stellar population, with a current star formation rate (SFR) much higher than the past mean value. The total mass of IZw18 from the rotation curve at a radius of 1012′′ is estimated to be M⊙ (e.g., Davidson & Kinman, 1985; Petrosian et al., 1997; van Zee et al., 1998), where the neutral gas corresponds to 70 of the total mass, but only M⊙ of HI is associated with the optical part of the galaxy (e.g., Lequeux & Viallefond, 1980; van Zee et al., 1998).
Subsequent spectroscopic studies in IZw18 (Lequeux et al., 1979; Davidson & Kinman, 1985; Dufour et al., 1988; Pagel et al., 1992; Skillman & Kennicutt, 1993; Kunth et al., 1994; Stasińska & Leitherer, 1996; Garnett et al., 1997; Izotov & Thuan, 1998) have confirmed its extreme metal deficiency around 1/301/50 of Z⊙. Nowadays IZw18 remains the star forming galaxy with the second lowest metallicity and the lowest helium content known (Izotov et al., 2009). This makes the system a fundamental point in the derivation of the primordial helium abundance (Izotov et al., 1994; Olive et al., 1997; Izotov & Thuan, 1998) and in the study of the properties of chemically unevolved galaxies.
When discovered by Zwicky (1966), IZw18 was described as “two galaxies separated by 5′′.6 and interconnected by a narrow luminous bridge”, surrounded by two “very faint flares” at 24′′ northwest. Subsequent CCD ground–based images (Davidson et al., 1989; Dufour & Hester, 1990) revealed a more complex structure: the two galaxies turned out to be two star–forming regions of the same galaxy (usually indicated as NW and SE components), while the two flares are just the most prominent of a few nebulosities surrounding IZw18. These minor systems are roughly aligned toward the northwest and were initially considered at the same distance, but subsequent spectroscopic studies showed that only one component (referred to as component C in Davidson et al., 1989) is at the same distance as IZw18 and is physically associated with the main body (Dufour et al., 1996a; Petrosian et al., 1997; van Zee et al., 1998). The other diffuse objects have been recognized as background galaxies (see, e.g., Dufour et al., 1996b). In the following we will refer to IZw18 and to component C respectively as main body (MB) and secondary body (SB) of IZw18. Both bodies have been resolved into single stars for the first time by HST with the Wide Field Planetary Camera 2 (WFPC2) by Hunter & Thronson (1995) and Dufour et al. (1996b).
The observational features described above triggered the key question over the nature of IZw18: is it a young galaxy which is presently experiencing its first burst of star formation, or is it an old system which has already formed stars in the past? HST studies by different authors have tried to characterize the evolutionary status of IZw18, with rather discordant results, but with a clear trend intriguingly reminiscent of Oscar Wilde’s Dorian Gray’s picture: the more one looks at it, the older it appears. Aloisi et al. (1999), using HST/WFPC2 data, were the first to detect Asymptotic Giant Branch (AGB) stars in the galaxy, and thus to demonstrate that IZw18 is as old as at least several hundred Myr, and possibly much older. Izotov & Thuan (2004) failed to detect red giant branch (RGB) stars with HST observations made by the Advanced Camera for Surveys (ACS), and thus concluded that the galaxy is at most 500 Myr old. However, both Momany et al. (2005) and Tosi et al. (2007), from independent re-analyses of the same ACS data set, suggested that IZw18 should be older than at least 1-2 Gyr, since it did appear to contain also Red Giant Branch (RGB) stars. Our own time-series HST/ACS photometry (GO 10586, Aloisi et al., 2007, hereafter Al07), has allowed us to shed light on the situation, thanks to the combined information from the color-magnitude diagram (CMD) and the lightcurves of the Cepheids we were able to measure.
In fact, Al07 not only characterized the RGB and identified its Tip (TRGB) at mag, but, more importantly, detected for the first time a few Cepheids whose lightcurves allowed to independently and more reliably pin down the galaxy’s distance to the couple Mpc accuracy (Fiorentino et al. 2010, hereafter F10; Marconi et al. 2010). The distance to IZw18 was estimated from the Cepheids using theoretical Wesenheit relations specifically computed for the very low metal abundance of the galaxy, and by theoretically fitting the observed lightcurve of the most reliable Classical Cepheid with period 8.71 days. The Wesenheit relations provide an intrinsic distance modulus for IZw18 of (D=19.0 Mpc) adopting a canonical mass - luminosity relation, and of 31.2 0.2 (D= Mpc) when an overluminosity of 0.25 dex is assumed for each given mass (non canonical scenario). The theoretical modeling of the 8.71 days Cepheid lightcurve provides 31.4 0.1 (D=19.0 Mpc). The TRGB identified by Al07 implies an instrinsic distance modulus of 31.30 0.17, in excellent agreement with the Cepheid-based estimates. This agreement, in turn, provides independent support to our interpretation of the CMD faint red sequence as an RGB.
Hence, IZw18 is actually farther away than originally thought (for instance Aloisi et al., 1999, adopted from the literature a mean value of D=10 Mpc) and is in practice at slightly larger distance than the Virgo cluster of galaxies. This made it impossible in the past to resolve its older, hence fainter, stars, and quite challenging even with the outstanding performances of HST’s current instrumentation. Today IZw18 is one of the most distant system ever resolved into stars.
In this work, we have used the photometric catalogues of our previous works, which have been focused on determining the age (Al07) and the distance through the variable stars (F10). In this paper we describe the evolutionary properties and the spatial distribution of the resolved stellar populations and candidate star clusters of the main and secondary bodies of IZw18. In Section 2, we briefly summarize the main differences in the photometric procedures adopted by Al07 and F10. The CMDs and the spatial distribution of stars in different evolutionary phases are presented in Section 3 and 4, respectively. The results are analysed in Section 5 and summarized in Section 6.
2. The photometric data–set
The data acquisition and reduction have been extensively described by Al07 and F10. Here we only summarize their main aspects. Time series photometry of IZw18 in the F606W (broad ) and F814W () filters was obtained with the Wide Field Channel (WFC) of the ACS in 13 different epochs properly spread over a time interval of 96 days (program Id. 10586, PI Aloisi). These proprietary data were complemented by 5 F555W () and 3 F814W archival ACS/WFC images of IZw18 from HST (program Id. 9400, PI Thuan).
IZw18 is quite distant, plenty of bright stars hiding and/or contaminating the fainter ones, and plenty of gas, which complicates the photometry of individual stars. In addition, the throughput of the F606W filter is significantly affected by the contribution of ionized gas (quite abundant in the MB of IZw18) and makes the star detection and measurement more complicated. Thus, depending on the goal, one can find more appropriate to restrict the analysis of the galaxy populations to safer but fewer objects (Al07), or to more uncertain but numerous ones (F10).
In Al07, to produce the galaxy CMD, we built four coadded images by stacking all single epoch images per filter for both archival and proprietary data, separately. Then we performed PSF photometry of each of these four coadded images using the DAOPHOT/ALLSTAR package (Stetson, 1987). The calibration to the Johnson-Cousins photometric system was obtained using the transformations given by Sirianni et al. (2005). Since the goal of that paper was to demonstrate that faint red stars actually existed where none had previously been detected, the published CMD was produced following a strategy aimed at minimizing the number of false detections. As a result, it contained only the 2099 sources which were independently detected in all the four deep images (the s and s of both datasets), with good match in the position (within one pixel) and magnitude (within ) of each source in the different images, and with sharpness 0.5. These are the most reliable objects measured in each of IZw18’s bodies.
In the case of F10, to produce the lightcurves of the candidate variables, we made use of DAOPHOTII/ALLSTAR/ALLFRAME (Stetson, 1987, 1994) to get PSF photometry on each single epoch (15 and 18 images, in total between proprietary and archival data). To study the variability we relaxed the Al07 selection criteria, since variable stars are more easily distinguishable from spurious objects thanks to their brightness variation in the images at different epochs. Moreover, to collect a good sample of candidate variables at all magnitudes, we examined objects close to the detection threshold. This photometry resulted in a CMD of IZw18 which contains 6859 sources with photometric errors mag and parameter in the range from to , and reaches 30.0, i.e. more than half a magnitude deeper than Al07’s photometry. The calibration to the Johnson-Cousins photometric system was obtained using the transformations given by Sirianni et al. (2005), as for the other data set.
As shown above, there is a remarkable difference in the number of objects selected with the two approaches. To infer the properties of the stellar populations inhabiting IZw18 minimizing the effects of uncertain photometry, we will base our results on the hyper-selected Al07 catalogue. Nonetheless, we consider it useful to show some features of the larger F10 catalogue both for completeness and for comparison.
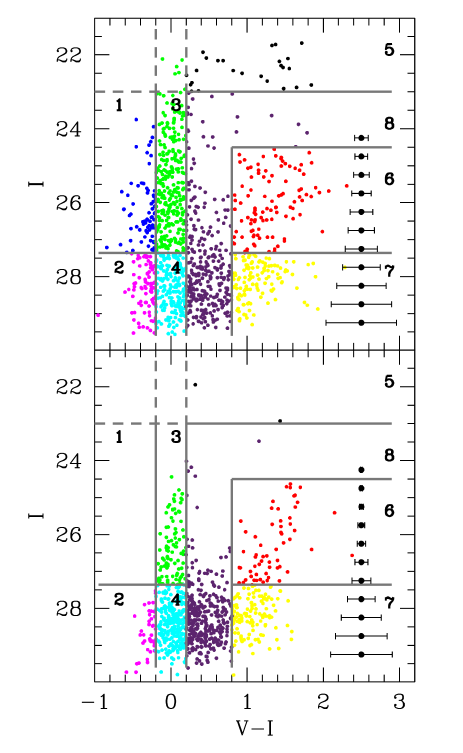
Since our aim is to analyse the evolutionary properties of IZw18’s stellar populations, we have put special care in verifying whether the selection differences affect some CMD regions more than others. We have hence divided the CMDs of the two sets in 8 zones roughly representative of different evolutionary phases. Since the TRGB was detected by Al07 at , we have adopted this magnitude as the border between bright and faint stars:
-
•
zone 1, stars in the extremely hot portion of the blue plume with and brighter than ;
-
•
zone 2: stars in the extremely hot portion of the blue plume with and fainter than ;
-
•
zone 3: stars in the “standard” blue plume, with , and brighter than ;
-
•
zone 4: stars in the “standard” blue plume, with , and fainter than ;
-
•
zone 5: objects with and any colour;
-
•
zone 6: stars with and ;
-
•
zone 7: stars with and ;
-
•
zone 8: all the remaining ones;.
The number of objects measured in each zone is reported in Table 1 for both bodies and both data sets.
| CMD | NMB | % | NMB | % | NSB | % | NSB | % |
|---|---|---|---|---|---|---|---|---|
| zone | (Al07) | (F10) | (Al07) | (F10) | ||||
| zone 1 | 76 | 6 | 649 | 13 | 0 | 0 | 0 | 0 |
| zone 2 | 84 | 7 | 917 | 20 | 43 | 5 | 108 | 5 |
| zone 3 | 277 | 23 | 820 | 17 | 93 | 9 | 98 | 4 |
| zone 4 | 186 | 16 | 707 | 15 | 262 | 29 | 584 | 28 |
| zone 5 | 34 | 3 | 51 | 1 | 2 | 1 | 2 | 1 |
| zone 6 | 105 | 8 | 210 | 4 | 60 | 6 | 110 | 5 |
| zone 7 | 126 | 11 | 349 | 8 | 120 | 13 | 375 | 18 |
| zone 8 | 305 | 26 | 1060 | 22 | 332 | 36 | 838 | 40 |
| total | 1187 | 100 | 4744 | 100 | 912 | 100 | 2115 | 100 |
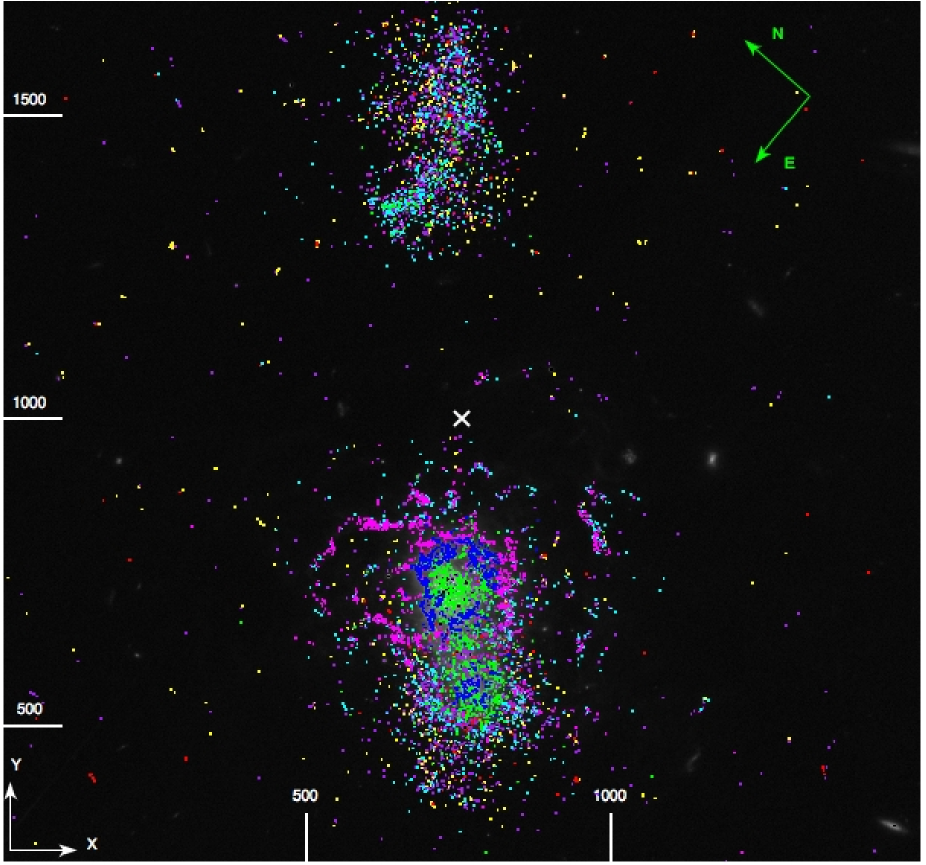
The zones are displayed on the Al07 CMDs in Figure 1. Figure 2 shows an F814W image of IZw18 with the F10 measured objects colour-coded according to the 8 CMD zones of Figure 1. We arbitrarily define as MB objects those with Y coordinate in the image smaller than 1200 px and as SB objects those with Y1200 px. In Figure 1, and all the following ones, the CMDs of the two bodies are splitted following this definition.
We have found that the two photometries agree well with each other, once we take the different selection criteria and photometric depth into account. The objects measured by both Al07 and F10 fall consistently in the same CMD zone (i.e. have the same colours and magnitudes).
The F10 objects not present in the Al07 hyper-selected catalogue fall mostly in the fainter portions of the CMDs, as expected since they can have larger photometric error. An intriguing difference is that the MB zones 1 and 2 are much more populated in F10 than in Al07 (see Table 1), with a ratio N(F10)/N(Al07)=8.5 in zone 1 and 10.9 in zone 2, significantly higher than the total MB ratio 4744/1187=4.0. Figure 2 reveals that most of the F10 objects of zones 1, 2 and 4 fall on the gas-rich regions in and around the MB. A possible cause for the discrepancy is therefore gas contamination in the F606W flux, even if in principle all photometric packages should overcome this kind of effects by subtracting the surrounding background flux to each source.
As a matter of fact, many of the objects in zone 1 and 2 show a discrepancy in -magnitude depending on the used filter, e.g. F606W or F555W. If, we restrict the selection criteria on the F10 catalogue and keep only the objects with 0.1, most of those in the CMD zone 2 and several of those in zone 1 are rejected. We thus consider as real stars on the gas filaments only the brighter ones with smaller photometric error.
Finally, we have individually and visually inspected the brighter objects of F10 zone 1 using appropriate routines, and found that some of them do appear as real stars. We consider the vast majority of the blue objects measured by F10 on the gas filaments and not present in the Al07 catalogue as likely spurious detection due to gas peaks, but we do believe that some of the brighter zone 1 detections are real stellar objects.
To be conservative, we will base all our results on the restricted Al07 catalogue.
3. Colour-magnitude diagrams
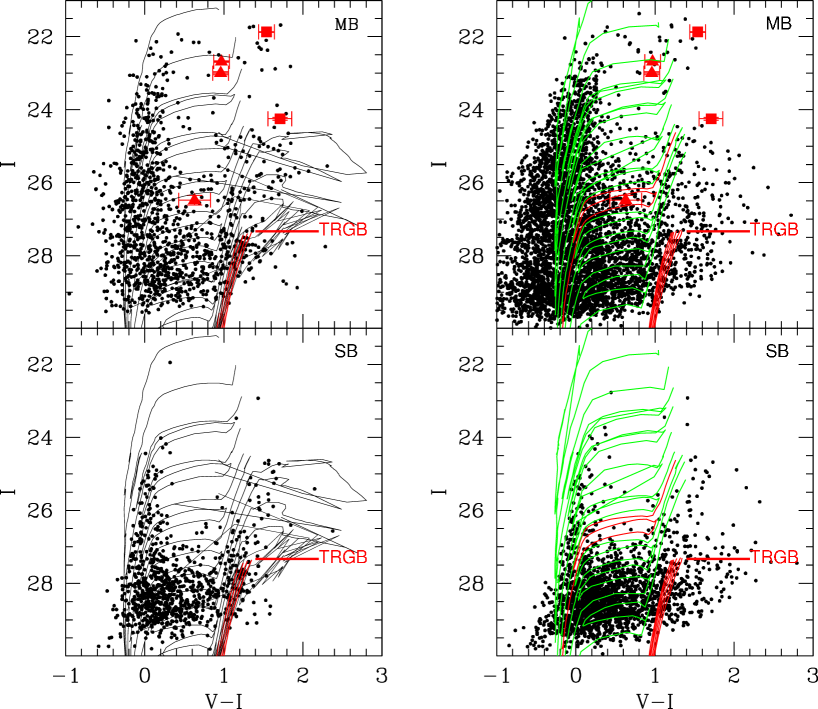
To let the reader easily figure out the involved stellar ages, the left panel of Figure 3 shows the CMDs of the hyper-selected Al07 objects with overimposed theoretical isochrones (Girardi et al., 2010). The isochrones have metallicity Z=0.0004 and are plotted adopting =31.4 (Al07 and F10) and E(B-V)=0.032 (van Zee et al., 1998). The CMDs corresponding to the less restrictively selected F10 photometry are displayed in the right panel of Figure 3, where stellar evolution tracks are also plotted to let the reader visualize what the involved star masses are. The plotted tracks, again with Z=0.0004, are the classical Padova models by Fagotto et al. (1994). We note that IZw18 is located at high galactic latitude () and therefore its CMDs do not suffer from significant contamination from foreground stars belonging to our Galaxy, meaning that is not necessary to correct for it our observed diagrams.
IZw18 is a starforming dwarf and its CMDs show all the features typical of these galaxies: a prominent blue plume with mean and a fainter and broad red plume with . Once compared with the stellar evolution tracks of Figure 3, the blue plume turns out to correspond to high- and intermediate-mass stars in the main sequence (MS) phase or at the blue edge of the blue loops covered during central He burning. These two phases are resolved by HST photometry in nearby late-type galaxies, but at the distance of IZw18 the photometric error inevitably is large enough to let them merge in just one broad sequence. Stars with colours intermediate between the blue and the red plume are either supergiants (brighter than ) or intermediate-mass stars in the blue loop phase. The brighter ones might also be unresolved star clusters.
The red plume is populated by red supergiants (), AGB () and RGB stars (). Our data allow to cover the brighter 1.5 magnitude portion of the RGB, where is 0.1 mag in and 0.2 in (Al07) and the photometric error, estimated from extensive artificial star tests (Annibali et al., 2011), is smaller than 0.3 mag in and 0.4 in (see Figure 1). The colour extension of the RGB is larger than this error and reflects, as usual, both the spreads in age and in metallicity of the resolved stars. However, given the extremely low metallicity of IZw18, in this case it is mostly the age that contributes to the RGB thickness. In other words, the reddest RGB stars are most likely low mass stars – Gyr old.
The redder red plume stars with are presumably carbon stars, not too different from those measured in the Magellanic Clouds by van der Marel & Cioni (2001). The redder objects at are most probably stars of – M⊙ in their thermal pulsing (TP) phase at the end of the AGB, since their location in the CMD is perfectly consistent with the predictions of Marigo & Girardi’s (2007) TP-AGB models. These authors show in fact that at very low metallicities (Z ) in (relatively) massive intermediate-mass stars efficient nuclear burning at the base of the convective envelope may favour the formation of C-rich models and make their tracks describe pronounced excursions towards lower effective temperatures. These excursions are recognizable in Figure 3 in the tangled, messy portions of the isochrones above the TRGB.

Not only does the MB, by definition, host a larger number of stars; it also contains a larger fraction of young, blue and bright stars than the SB. Both the luminosity and the number of the brighter stars in the SB are significantly lower than in the MB. Almost no supergiant is found in the SB and no Cepheid. Moreover, while the blue plume of the MB covers the entire range of blue massive stellar evolution tracks and youngest isochrones, that of the SB turns off the MS around , with apparently no bright star younger than 10 Myr being detected there. This is a significant difference, which reflects, as discussed already by Aloisi et al. (1999), both a different rate and a different history of star formation, with the MB being more active than the other at recent epochs, and the SB more active earlier than about 100 Myr ago, as suggested by the higher density of objects around the isochrones older than this age in the left-bottom panel of Figure 3. At the faintest magnitudes, we should also consider that crowding affects the MB more severely, preventing the detection of its faintest stars. This may be particularly the case in the NW part of the MB.
The variable stars in IZw18 have been identified by F10 exploiting our ACS time-series photometry. The intensity-averaged mean magnitudes and colors of the confirmed Cepheids are plotted as filled (red) triangles in Figure 3, while those of the confirmed Long Period Variables (LPVs) are plotted as filled (red) squares. Their position (see F10 for identifications and nomenclature) in the CMD indicates that the two bright ultra-long period Cepheids (ULPs) V1 and V15 are supergiants, unless they are hosted by unresolved star clusters making them appear brighter. The Classical Cepheid V6 with period P=8.71d is on the blue loop and is best fitted by a 6 M⊙ star (see also F10 and Marconi et al., 2010). The brighter LPV V4 is a supergiant, while the other confirmed LPV V7 lies at the bright edge of the CMD region of the TP-AGB stars and is presumably a Mira.
For a finer analysis of the evolutionary properties of IZw18 components, we have further divided the Al07 objects according to their position in the MB. Figure 4 shows the CMDs of the objects with Y coordinate in the image larger (top panel) or lower (bottom panel) than 650 px (see Figure 2). This in practice separates objects in the NW (top) part of the MB from those in the SE (bottom). The two CMDs are fairly similar to each other, although the NW one contains more objects in zone 5 and is more dispersed than the other. In particular, the red plume of the SE region is much better defined than that of the NW and allows to clearly distinguish the RGB and its Tip from the AGB. The larger spread of the NW CMD is likely due to the presence of a larger number of bright objects and thick ionized gas filaments that make the measurements of fainter (and older) stars more uncertain. It is plausible that the gas ionization is itself due to the massive luminous objects populating the NW region; so, they may represent the only real difference between the northern and southern parts of the MB. We will further discuss these objects in the next section.
In spite of the very different number of objects selected in the two data sets, once the different depths of the resulting CMDs (Figure 3) are taken into account, their stellar evolutionary phases turn out to be populated in similar proportions, both in the MB and in the SB (see Table 1). As discussed in the previous section, the only significant difference is that the MB blue plume is much more populated, bluer and thicker in the F10 CMD.
4. Spatial distribution and evolutionary properties of IZw18 resolved stars
We have analysed the spatial location of the various types of stars populating IZw18 and checked if stars of different ages are evenly or unevenly distributed. To this purpose, we have used the CMD zones of Figure 1. Thanks to the comparison with the evolutionary tracks, we can assign to each zone the following evolutionary properties:
-
•
zone 1 corresponds to massive and intermediate mass stars on the MS , younger than 10–15 Myr;
-
•
zone 2 to fainter intermediate mass stars on the MS, younger than 70 Myr;
-
•
zone 3 to massive and intermediate mass stars on the MS or at the blue edge of the blue loop phase, younger than 70 Myr;
-
•
zone 4 to fainter intermediate mass stars on the MS or at the blue edge of the blue loop phase, younger than 300 Myr;
-
•
zone 5 to supergiants, younger than 10 Myr and, possibly, to unresolved star clusters;
-
•
zone 6 to AGB stars, ages from 35 to 300 Myr;
-
•
zone 7 to RGB stars, ages from 1 to 13 Gyr;
-
•
zone 8 in most cases corresponds to intermediate-mass stars in the blue loops, but also to some supergiants, ages from 15 to 300 Myr.
The spatial distribution in the X-Y map of IZw18 of the Al07 objects measured in the two bodies and falling in each of the 8 CMD zones is reported in Figure 5.

This map shows that the SB does not contain stars in zone 1. In other words the SB has had very little, if any, star formation activity in the last few Myr. Zone 1 stars covering the whole range of magnitudes (hence with masses from 15–20 M⊙ up) are numerous in the MB and show a sort of 8-shaped spatial distribution. If we look at the fainter portion of the extremely blue stars (zone 2), we find that both bodies contain several of these objects and that in the MB they seem to delineate the same 8-shape as their brighter counterpart.
The bright stars in zone 3 have masses above 6 M⊙ and are also present in both bodies. Their spatial distribution in Figure 5 forms an irregular ellipsoidal clump of objects with significant central concentration (the MB) with a comma-shaped companion (the secondary: Zwicky’s “flare”). This is the overall familiar appearance of IZw18, since these are the stars more easily visible, although not resolvable from ground. Once again, the SB stars of zone 3 don’t reach the luminosity of the brightest ones hosted in the MB (see Figure 1) : while the whole mass and luminosity ranges are covered in the latter, only stars less luminous than exist in the former. Taking into account that any Initial Mass Function disfavours the most massive stars, we consider it more likely that the brighter blue stars in the SB are 12–15 M⊙ stars at the blue edge of the blue loop rather than more massive stars. In this case, the star formation activity in the secondary must have been quite low, or absent, in the last 10 Myr.
Fainter (lower mass) blue plume stars (zone 4) can be either MS stars with masses between 6–20 M⊙ or stars at the blue edge of the blue loop with mass in the range 3–5 M⊙ (see the tracks in right panel of Figure 3). They are present in both bodies, and are more abundant in the SB than in the MB, where they are not found in the central regions and have a spatial distribution complementary to that of their brighter counterpart of zone 3. This is clearly due to the severe crowding affecting the MB and, particularly, its inner regions, where the many bright stars completely hide fainter ones. In the SB the recent star formation activity has been less intense, crowding is less severe, and faint stars are much more easily detectable.
The lower activity of the SB at recent epochs is also confirmed by the objects of zone 5. As apparent from Figure 5, we find only 2 such bright objects in the SB (one of which is quite far away and may actually be a background system), and 31 in the MB. The latter are fairly confined in the inner regions, and most often in the NW portion of the MB. They significantly contribute to the severe crowding affecting the central area. If interpreted in terms of individual stars, these objects are supergiants and confirm that the central region of the MB has experienced a strong star forming activity in the last 10 Myr or so.
Admittedly, some of these very bright objects might be not individual stars but unresolved star clusters. We discuss this possibility in Section 4.1.
The objects falling in the CMD zone 6 are (see the tracks in Figure 3) AGB stars with mass lower than 9 M⊙, and age (see the isochrones in the same Figure) in principle between 35 Myr and 13 Gyr, but in practice peaked at, at least, several hundreds Myr, once the stellar lifetimes and phase durations are taken into account. They include the TP-AGB and carbon stars with 4-5 M⊙ (horizontal finger at 25.5 in the CMDs) predicted by Marigo & Girardi (2007) for these low metallicities and the carbon stars at 26.4 discussed by Al07. Zone 6 objects are equally present and evenly distributed in both bodies, although missed in the most crowded portions of the MB.
The RGB stars are in zone 7: objects with mass below 1.8-2.0 M⊙ and age between 1 and Gyr. The RGB is notoriously affected by the age-metallicity degeneracy, i.e. the ambiguity that stars with the same brightness and colour can be older and metal poorer or younger and metal richer. Hence, without independent spectroscopic metallicity measurements one cannot assign the age to RGB stars simply from their position in the CMD. For this reason the photometric identification of the RGB normally puts only a lower limit of 1-2 Gyr (i.e. the minimum time required by low-mass stars to reach that phase) to the age of the examined stellar population. However, in the case of IZw18, its extremely low metallicity somewhat relaxes the effect of the age-metallicity degeneracy, since the redder RGBs cannot be metal rich objects and therefore must be old. In these conditions, the colour extension of IZw18 RGB, which is broader than the photometric error and covers the whole range of isochrone ages, can be taken as a signature of the presence of stars possibly as old as 13 Gyr. RGB stars are faint and therefore their detection is strongly affected by crowding and photometric performances. This is why only with the ACS has it been finally possible to resolve and measure them: not even HST was able to reach the RGB, with the less sensitive WFPC2. The red giants are evenly distributed in the SB and visible only in the outer regions of the MB, due to the excessive crowding of its inner parts. It is interesting to notice that the MB RGBs are located along a semi-arc in the system periphery. We ascribe this asymmetry to the presence of thick gas filaments in the regions where RGBs are not detected: overlapping filaments can clearly hide such faint objects. We thus believe that RGB stars can actually be evenly distributed also in the MB.
Finally, zone 8 collects all the remaining objects, with a large range of brightness and colour, and different ages and evolutionary phases. Those with 24.5 are stars in the 3–10 M⊙ mass range in the central helium burning phase and with ages between 30 and 300 Myr. The brighter ones are 10–15 M⊙ mass stars in any post-MS evolutionary phase, with age of the order of 15–30 Myr. These mixed objects are evenly distributed in both bodies, with the only exception of the two most crowded NW and SE spots of the MB, where they are missing. Interestingly, like the objects of zones 2, 4 and 7, they are found in similar numbers in the two bodies. Even considering the effect of the different crowding, this suggests that as far as low and intermediate mass stars are concerned, the SB is not significantly less populated than the MB.
As for the variable stars, the two ULPs V1 and V15 are located in the NW portion of the MB, while the classical Cepheid V6 and the two LPVs V4 and V7 are in the SE portion (see F10 figure 5). Interestingly, all the confirmed variables belong to the MB: of the 34 good candidate variables examined by F10, almost half (15) were actually detected in, or around, the SB, but for none of them satisfactory lightcurves and periods were derived. Ground-based observations of the brighter variables are being performed to better characterize their pulsation and evolutionary properties. In particular, further data on the ULPs will allow us to verify if they are the extension to higher masses of Classical Cepheids and, in case, to calibrate them as extremely useful primary indicators of cosmological interest.
Finally, we emphasize that no star is found in the region between the MB and the SB, either in the Al07 or the F10 catalogues. That region looks completely transparent, with only background galaxies being detected there. This shows that the two bodies are completely separated. They are members of a two-body system, but have no star connecting each other. If tidal interactions are at work, they don’t appreciably affect the stellar populations of the two components.
4.1. Cluster candidates
At 19 Mpc, ACS/WFC photometry cannot recognize round regularly shaped clusters whose sizes fall within the Point Spread Function. In this section we consider the possibility that zone 5 objects are actually not individual stars but unresolved star clusters, and discuss the implications on IZw18’s evolutionary status.
With an intrinsic distance modulus of =31.4, the objects of zone 5 have an absolute bolometric magnitude brighter than -8.4, certainly consistent with typical cluster luminosities. Actually, the brightest objects, with , hence , would be “populous” clusters, according to the definitions by Larsen & Richtler (2000) and Billett et al. (2002). These bigger, more massive clusters are fairly common in starburst dwarfs, such as NGC 1705 (Billett et al., 2002; Annibali et al., 2009), NGC 1569 (Hunter et al., 2000; Origlia et al., 2001) and NGC 4449 (Annibali et al., 2011), and tend to be centrally concentrated, just like these brightest objects of IZw18. Hence, also if taken as star clusters, the objects of zone 5 would confirm a higher star formation activity in the MB than in the SB.
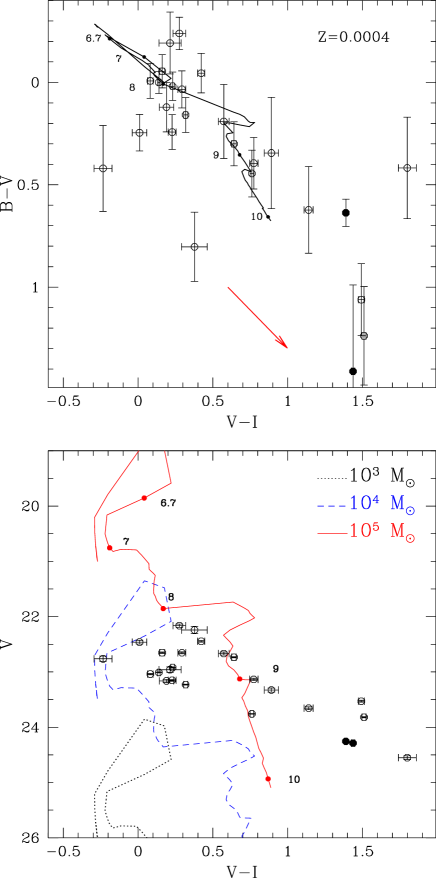
To infer the evolutionary properties of unresolved clusters, two photometric bands are insufficient. Fortunately IZw18 was observed also in the B band with the WFPC2 by Dufour et al. (1996b). We cross-correlated the 31 + 2 objects in Zone 5 with the WFPC2 (F435W, F555W) photometry presented by Aloisi et al. (1999). The cross-correlation provides 23 + 2 objects photometrized in F439W, F555W and F814W. A visual inspection in our images of the objects missed by the cross-correlation shows that they are all located in the most crowded MB region, and thus their position measurement is highly uncertain, also because of blending effects. The WFPC2 magnitudes were transformed into Johnson-Cousins and magnitudes using the transformations by Holtzman et al. (1995).
In Fig. 6 we show the versus color-color diagram and the versus color-magnitude diagram for zone 5 objects. The data are compared with the Padova simple stellar populations (SSPs) with metallicity Z0.0004, ages from 1 Myr to 13 Gyr, and masses of , , and (Girardi et al., 2010). Zone 5 objects have colors in the range –, and colors in the range –, and are compatible with SSP ages from a few Myr to a Hubble time. The two objects with , 0.8, and , 0.4, are located in the most crowded region of the main body, and therefore their colors suffer larger uncertanties. The objects concentrated around can be either Myr old clusters or clusters in the red loop of the models at ages around Myr.
We notice that there are some objects with which are redder than the oldest SSPs. We can exclude that they are background galaxies because they are all concentrated within IZw18’s MB, except for two of them, which are more “peripheral”. Another possibility is that these objects are highly reddened young embedded clusters; however, in this case they should have (see reddening vector in Figure 6), and thus absolute magnitudes brighter than . Such high luminosities would imply a super star cluster (SSC) classification according to the definition by Billett et al. (2002). However, it is unlikely that IZw18 host so many SSCs, considering that NGC 1569, the dwarf with the highest known current SFR, presents only 4 of them (Hunter et al., 2000; Origlia et al., 2001). Several studies have discussed stochastic effects on the integrated colors of clusters (e.g. Silva-Villa & Larsen, 2011; Maíz Apellániz, 2009). Stochasticity in the IMF sampling of a low-mass cluster can heavily change the observed colors with respect to predictions, and in particular, red supergiants make appear the cluster colors redder. Cerviño & Luridiana (2004) investigated this issue and derived a luminosity limit under which stochastic effects are important. Comparing the luminosities of our clusters redder than with their predictions for ages older than 100 Myr, we found that our cluster luminosities are well above that limit. Therefore, the most likely explanation is that these objects are supergiants with ages younger than 20 Myr, implying that the MB has been forming stars at very recent epochs.

For the zone 5 objects with we have inferred ages and masses using the Padova models. This was done minimizing the difference between model and data colors (BV, VI, and BI) according to a criterion, varying the age between 1 Myr and 13 Gyr. We accounted for a Galactic reddening of E(B-V)0.032, but did not solve for possible internal extinction, because of the small number of bands (3) and the relatively short wavelength range covered by our data. Following the prescriptions of Avni (1976), the 1 errors were derived as the limits of the 0.68 confidence level region defined by . Cluster masses were obtained from the mass-to-light ratios of the best-fitting models in the I band. The results are presented in a mass versus age diagram in Fig. 7. Cluster ages span the whole Hubble time, even if we notice that the majority of clusters have ages younger than a few hundred Myr. Cluster masses range from to . The observed correlation between cluster ages and masses is an obvious effect of the magnitude limit adopted for zone 5.
We notice that our analysis provides 5 “old” (age1 Gyr) clusters, with masses between and , and totaling . This implies that 3% of the stellar mass in IZw 18 is in the form of old clusters, which sounds unlikely given the fact that this ratio has been found to be considerably lower in other dwarf irregulars with evidence for significant SF at ages 1 Gyr (e.g., 0.3% in NGC 4449, Annibali et al. 2011). This suggests that the majority of the candidate old clusters in IZw18 are instead resolved supergiants.
Concluding, our analysis seems to suggest that the majority of the objects in zone 5 are indeed individual stars, even if we can not exclude that some of them are unresolved stars clusters. Nevertheless, even in this scenario, our analysis provides evidence for a particularly active SF over the past hundred Myr.
5. Discussion of the Results
The evolutionary properties derived above for the stars measured in IZw18 are similar to those of other metal-poor starbursting dwarfs. For instance, once the difference in distance modulus is taken into account, magnitudes and colours of the various types of stars on the red plume of IZw18 are in perfect agreement with those of the corresponding stars in SBS1415+437, the other very metal-poor BCD whose stellar populations have been resolved by HST/ACS (Aloisi et al., 2005). Indeed, the CMD of SBS1415+437, whose intrinsic distance modulus is 30.66, shows an unmistakable TRGB at and the horizontal finger typical of carbon stars at (Aloisi et al., 2005). SBS1415+437 has a red plume more populated than IZw18, as if it had been more active in previous epochs. In turn, the blue plume of IZw18’s MB is more prominent than that of SBS1415+437, suggesting that its current and recent star formation activity is proportionally higher.
The results described in the previous sections allow us to draw a qualitative picture of the evolution of the MB and SB. Both components contain old and young stars in all evolutionary phases, but it is apparent that the two stellar systems are distinct from each other and have had different histories. The quantitative star formation history (SFH) of the two bodies of IZw18 will be derived from the CMDs using the synthetic CMD method (see e.g. Cignoni & Tosi, 2010, and references therein) and will be presented in a forthcoming paper (Annibali et al., 2011).
5.1. The Main Body
The spatial distribution of stars in different evolutionary phases displayed in Figures 2 and 5 suggests that the MB is indeed one single system and not “two galaxies separated and interconnected by a narrow luminous bridge” as originally thought by Zwicky (1966). We can however understand how he was misled by the 8-shaped distribution of the young blue stars.
Young massive stars (zones 1 and 3 of Figure 1) cover the entire MB. Zone 3 stars are concentrated on the NW and SE star forming regions, following the traditional scheme of starburst dwarfs, where massive young stars usually group together and are concentrated in the inner regions, although not necessarily at the very center of the galaxy. The NW region contains a larger number of bright massive zone 3 objects than the SE region. This suggests a more recent/higher star formation activity in the NW clump.
Zone 1 stars seem (see Figure 5) intriguingly to avoid the areas where zone 3 stars are located. Is this because they are different objects? Since they are redder, zone 3 stars might be more evolved or more metal rich than zone 1 stars. We rather believe that either zone 1 stars lie on gas filaments and are slightly blue-shifted by residual gas contamination increasing the F555W flux, or that differential reddening slightly affects zone 3 objects. Throughout this paper we have only considered the foreground Galactic reddening, , but IZw18 does contain a lot of gas and presumably dust and molecules, although in quantities limited by its low metallicity (Cannon et al., 2002). It is thus plausible that absorbing interlopers are more abundant in the innermost, star forming regions and that they make the stars of those regions appear redder. In this framework, zone 3 stars are the same kind of objects as zone 1 stars, only affected by internal extinction of the order of 0.1.
Lower mass young stars (zones 2 and 4) could help in discriminating between the above interpretations, but they are faint and are much more severely affected by crowding than by any other effect. Indeed, although likely to exist also where massive young stars are found, they are only detectable where the latter don’t outshine them. As discussed in the previous sections, in F10’s catalogue many of these objects lie on the gas filaments protruding from the NW spur. While the vast majority of these faint F10 detections on the filaments are likely to be gas peaks misinterpreted as stars, we do believe that some of the brighter ones, which appear as actual stellar sources when individually and visually inspected in the images, are indeed very young stars or unresolved star clusters (see also Chandar et al., 2005). This leads to speculate that star formation is occurring at least in the portions of the filaments closest to the MB. Unfortunately, we don’t know whether these filaments are only made of ionized gas or also of neutral one, since the current resolution of HI data (F. Fraternali private communication, Lelli et al. in preparation) doesn’t allow one to resolve them. Neither do we know whether the filaments are infalling, outflowing or comoving with respect to the MB. From van Zee’s et al. (1998, their figure 6) comparison of the and HI distributions, the filaments appear to be a distinct feature of the ionized gas, but the HI resolution is definitely insufficient. It is thus difficult to assess if star formation is physically plausible there; certainly it is extremely unlikely that it occurs in hot, possibly outflowing bubbles, such as many of IZw18 ionized filaments (Martin, 1996).
Also the massive objects of zone 5 are centrally concentrated, as usually found in starburst dwarfs. Whether they are resolved supergiants or unresolved star clusters, they are the signature of strong star formation activity. The evidence that they are more abundant in the NW than in the SE clump suggests that the activity in the former is higher than in the latter. The NW clump is also known to contain Wolf-Rayet stars (see e.g. Hunter & Thronson, 1995; Izotov & Thuan, 1998). Yet, from emission line spectroscopy, Izotov & Thuan (1998) suggested it to be not as young as the SE clump: 10 Myr the former and 5 Myr the latter (and 20 Myr the SB). The CMDs of Figure 4 do not seem to confirm their suggestion. Rather, our CMDs suggest that the star formation activity in the NW is more recent than in the SE. The circumstance that, of the variable stars reliably characterized by F10, the two massive ULP Cepheids V1 and V15 are located in the NW region, while the lower mass Classical Cepheid V6 and the fainter LPV V7 are located in the SE region, favours the view that the NW on average contains younger stars than the SE.
All the lower mass evolved stars are likely to be evenly distributed in the MB. RGB stars seem to be located more externally than AGBs, but this is most probably a selection effect. We ascribe their apparent confinement in the outer regions to the severe central crowding which prevents their detections. Similarly, we interpret their asymmetrical horseshoe distribution as due to the extinction from the thick gas filaments of the northern areas (see Cannon et al., 2002, for the spatial distribution of dust). There is no doubt that faint objects are more easily detected in the SE external portions of the MB.
The resulting overall scenario of the MB consists of a system with two active, distinct regions of current star formation, one (the NW one) stronger and younger than the other. These two active clumps are embedded in a fairly homogeneous body of stars of all ages, from a few Myr to several (possibly 13) Gyr.
5.2. The Secondary Body
The SB is in a rather different situation. As mentioned above, the weaker emission lines of its spectrum already led Izotov & Thuan (1998) to suggest that it is older than the MB emission regions. WFPC2 photometry allowed Aloisi et al. (1999) to quantitatively assess that its recent SFR is much lower than in the MB. The ACS photometry confirms these results.
Our CMDs show that the SB does contain young blue plume stars, but they are more likely stars at least 10 Myr old on the blue loop phase. Stars more massive than do not seem to be still alive. The SB also appears to contain much less ionized gas than the MB: a further confirmation of its low recent activity.
On the other hand, low and intermediate mass stars are at least as numerous in the SB as in the MB, with the objects of zone 4 (low mass MS stars) even outnumbering those in the MB (see Table 1). This is a strong indication that at epochs earlier than 100 Myr ago, the SB must have been actively forming stars as, or more than, the MB333A deeper and more detailed analysis of the relative star formation activity in both bodies, taking into acount completeness will be present in Annibali et al. (2011).. If we compare the CMD of the MB SE region (Figure 4) with that of the SB (Figure 3), we see that the two red plumes are similar, both in the RGB and the AGB sequences. The blue plume, although containing similar numbers of stars, clearly shows that those in the SB are more evolved than those in the SE, that reach brighter magnitudes and bluer colours. The AGB and the RGB of the SB are well defined. The colour extension of the latter, combined with the small metallicity range of the system, indicates that stars with the oldest possible ages (13 Gyr) are present.
We conclude that the SB has started its star formation activity up to Gyr ago, and has remained active since then, at rates comparable with those in the MB until relatively recently. However, in the most recent epochs (i.e. later than 10 Myr ago) its SFR has dropped to values significantly lower than in the MB.
6. Summary and conclusions
We have studied the evolutionary properties and spatial distribution of the stars resolved in IZw18 by HST/ACS proprietary and archival photometry. To this aim we have analysed both the Al07 and the F10 catalogues and found consistent results, independently of the different selection criteria adopted in the two approaches. Nonetheless, to be conservative, we have based our conclusions on the Al07 most restrictively selected catalogue.
The comparison of the CMDs resulting from the ACS photometry with stellar evolution models (tracks and isochrones) indicates that stars of all ages are present in the two bodies. In spite of the impossibility of reaching the oldest MS turn-off in a galaxy 19 Mpc away, the extremely low metallicity of IZw18 relaxes the age-metallicity degeneracy and makes the red edge of the RGB a signature of the presence of stars up to possibly 13 Gyr old. The oldest detectable stars are best visible in the SB and the SE portion of the MB, where crowding is less severe, but are present also in the rest of the MB, although measured with larger uncertainties.
We have found that the stars are homogeneously distributed over the two bodies, with the younger ones more centrally concentrated, as always found in starburst dwarfs, and the older/fainter ones spread out to the system periphery, also because of selection effects in their detectability. From the maps of the stars spatial distribution (Figure 5) we conclude that old and intermediate age stars are actually distributed homogeneously over the two bodies.
Summarizing the results presented by Al07 and F10 and those obtained here, the main properties of IZw18 stellar populations are:
-
•
The distance independently estimated from the TRGB (Al07) and the Cepheids (F10) is Mpc.
-
•
As far as stars are concerned, the SB is completely separated from the MB: no star is detected between the two bodies. If tidal interactions are at work, they don’t appreciably affect the distribution of the stellar populations of the two components.
-
•
IZw18 contains stars in all the evolutionary phases visible at its distance: massive and intermediate mass stars on the MS, blue and red supergiants, AGB and TP-AGB stars, carbon stars, RGB stars. Hence, it hosts stars of all ages, from a few Myr up to possibly 13 Gyr.
-
•
The MB hosts two bright star forming regions (NW and SE), embedded in a common and homogeneous environment of older stars. Some stars may have been recently formed on the gas filaments protruding from the NW portion of the MB.
-
•
While old and intermediate age stars are present in similar amounts in the MB and in the SB, the youngest stars are only found in the MB and mostly concentrated in its NW region. The SE region has also been active recently, but at a lower current rate; the SB has had definitely less star formation than the MB in the last tens of Myr.
-
•
Of the 34 candidate variable stars studied by F10, 19 and 15 are in, or around, the MB and the SB respectively. All the confirmed ones are however in the MB: the two ULP Cepheids in the NW region; the Classical Cepheid and the two LPVs in the SE region.
-
•
At IZw18’s distance, star clusters are not distinguishable from point-like sources. It is thus possible that some of the brightest objects in the main body are actually clusters and not individual stars. Comparing their colors with simple stellar population models, we find that the candidate clusters would span ages from a few Myr to a Hubble time, with the majority of them being younger than 200 Myr. However, the fraction of stellar mass in old (age1 Gyr) clusters would be significantly higher than what found in other dwarfs, suggesting that the majority of the candidate old clusters are instead resolved stars. The reddest () brightest objects cannot be unresolved clusters and must be supergiants with ages younger than 20 Myr.
These results show that IZw18 is not unique in the sky, but shares the evolutionary properties typical of BCDs and, more in general, of late-type dwarfs (see Tolstoy et al., 2009, for a review). It is not experiencing now its first burst of star formation, but has been forming stars over many Gyrs, most likely over the whole Hubble time. This implies that its extremely low metallicity cannot be explained by a low chemical enrichment due to extremely recent star formation. At best, one may hope that the SFR has been low until relatively recently (see e.g. Legrand, 2000), although the conspicuous presence of stars of all ages does not make this likely.
The same problem obviously concerns all the other metal-poor BCDs where stars many Gyr old have been found, like SBS1415+437 (Aloisi et al., 2005). We recall that no genuinely young galaxy has been found yet by anybody. All the galaxies whose stellar content has been resolved so far contain stars as old as the lookback time allowed by the available instrumentation, whatever their morphological type and metallicity (see e.g. Tosi, 2009; Cignoni & Tosi, 2010, and references therein). Hence, since stellar nucleosynthesis has had plenty of time to pollute them, the only ways to explain the low observed metallicity of these galaxies are either to dilute sufficiently their insterstellar medium by accretion of primordial or very metal poor gas, or to remove the stellar nucleosynthesis products through galactic winds triggered by supernova explosions, or both. Chemical evolution models of late-type dwarfs and BCDs have shown long ago (Matteucci & Tosi, 1985; Pilyugin, 1993; Marconi et al., 1994) that infall of metal poor gas alone is not sufficient to reproduce the low metallicity of starburst dwarfs, and that galactic winds must be invoked too.
Observational evidence for galactic winds has been found for a handful of starburst dwarfs (Bomans et al., 2007; Grimes et al., 2009), and IZw18 is indeed one of those where the outflowing (Martin 1996) ionized gas associated with the most recent SF activity may indeed have a speed higher than the escape velocity and be able to remove metals from the system. It would be crucial to get detailed information also on the cold gas, see how it is spatially distributed, and what its kinematics is.
Understanding the chemical and dynamical evolution of IZw18 represents a key step to approach the evolution of all dwarf galaxies as well as that of more massive systems which may have formed from the assembly of small objects like it.
References
- Aloisi et al. (1999) Aloisi, A., Tosi, M., & Greggio, L. 1999, AJ, 118, 302
- Aloisi et al. (2005) Aloisi, A., van der Marel, R. P., Mack, J., Leitherer, C., Sirianni, M., & Tosi, M. 2005, ApJ, 631, L45
- Aloisi et al. (2007) Aloisi, A., et al. 2007, ApJ, 667, L151 Marel, R. P., Mack, J., Leitherer, C., Sirianni, M., & Tosi, M. 2005, ApJ, 631, L45
- Annibali et al. (2009) Annibali, F., Tosi, M., Monelli, M., Sirianni, M., Montegriffo, P., Aloisi, A., & Greggio, L. 2009, AJ, 138, 169
- Annibali et al. (2011) Annibali, F., Tosi, M., Aloisi, A. & van der Marel, R. P., 2011, AJ, submitted
- Avni (1976) Avni, Y. 1976, ApJ, 210, 642
- Billett et al. (2002) Billett, O. H., Hunter, D. A., & Elmegreen, B. G. 2002, AJ, 123, 1454
- Bomans et al. (2007) Bomans, D. J., van Eymeren, J., Dettmar, R.-J., Weis, K., & Hopp, U. 2007, New AR, 51, 141
- Cannon et al. (2002) Cannon, J. M., Skillman, E. D., Garnett, D. R., & Dufour, R. J. 2002, ApJ, 565, 931
- Cerviño & Luridiana (2004) Cerviño, M., & Luridiana, V. 2004, A&A, 413, 145
- Chandar et al. (2005) Chandar, R., Leitherer, C., Tremonti, C. A., Calzetti, D., Aloisi, A., Meurer, G. R., & de Mello, D. 2005, ApJ, 628, 210
- Cignoni & Tosi (2010) Cignoni, M., & Tosi, M. 2010, Advances in Astronomy, 2010,
- Davidson & Kinman (1985) Davidson, K., & Kinman, T. D. 1985, ApJS, 58, 321
- Davidson et al. (1989) Davidson, K., Kinman, T. D., & Friedman, S. D. 1989, AJ, 97, 1591
- Dufour et al. (1988) Dufour, R. J., Garnett, D. R., & Shields, G. A. 1988, ApJ, 332, 752
- Dufour & Hester (1990) Dufour, R. J., & Hester, J. J. 1990, ApJ, 350, 149
- Dufour et al. (1996a) Dufour, R. J., Esteban, C., & Castaneda, H. O. 1996a, ApJ, 471, L87
- Dufour et al. (1996b) Dufour, R. J., Garnett, D. R., Skillman, E. D., & Shields, G. A. 1996b, From Stars to Galaxies: the Impact of Stellar Physics on Galaxy Evolution, 98, 358
- Fagotto et al. (1994) Fagotto, F., Bressan, A., Bertelli, G., & Chiosi, C. 1994, A&AS, 104, 365
- Fiorentino et al. (2010) Fiorentino, G., et al. 2010, ApJ, 711, 808
- Garnett et al. (1997) Garnett, D. R., Skillman, E. D., Dufour, R. J., & Shields, G. A. 1997, ApJ, 481, 174 363, 142
- Girardi et al. (2010) Girardi, L., et al. 2010, ApJ, 724, 1030
- Grimes et al. (2009) Grimes, J. P., et al. 2009, ApJS, 181, 272
- Holtzman et al. (1995) Holtzman, J. A., Burrows, C. J., Casertano, S., Hester, J. J., Trauger, J. T., Watson, A. M., & Worthey, G. 1995, PASP, 107, 1065
- Hunter & Thronson (1995) Hunter, D. A., & Thronson, H. A., Jr. 1995, ApJ, 452, 238
- Hunter et al. (2000) Hunter, D. A., O’Connell, R. W., Gallagher, J. S., & Smecker-Hane, T. A. 2000, AJ, 120, 2383
- Izotov et al. (1994) Izotov, Y. I., Thuan, T. X., & Lipovetsky, V. A. 1994, ApJ, 435, 647
- Izotov & Thuan (1998) Izotov, Y. I., & Thuan, T. X. 1998, ApJ, 497, 227
- Izotov & Thuan (2004) Izotov, Y. I., & Thuan, T. X. 2004, ApJ, 616, 768
- Izotov et al. (2009) Izotov, Y. I., Guseva, N. G., Fricke, K. J., & Papaderos, P. 2009, A&A, 503, 61
- Kunth et al. (1994) Kunth, D., Lequeux, J., Sargent, W. L. W., & Viallefond, F. 1994, A&A, 282, 709
- Larsen & Richtler (2000) Larsen, S. S., & Richtler, T. 2000, A&A, 354, 836
- Legrand (2000) Legrand, F. 2000, New AR, 44, 345
- Lequeux et al. (1979) Lequeux, J., Peimbert, M., Rayo, J. F., Serrano, A., & Torres-Peimbert, S. 1979, A&A, 80, 155
- Lequeux & Viallefond (1980) Lequeux, J., & Viallefond, F. 1980, A&A, 91, 269
- Maíz Apellániz (2009) Maíz Apellániz, J. 2009, ApJ, 699, 1938
- Marconi et al. (1994) Marconi, G., Matteucci, F., & Tosi, M. 1994, MNRAS, 270, 35
- Marconi et al. (2010) Marconi, M., et al. 2010, ApJ, 713, 615
- Marigo & Girardi (2007) Marigo, P., & Girardi, L. 2007, A&A, 469, 239
- Martin (1996) Martin, C. L. 1996, ApJ, 465, 680
- Matteucci & Tosi (1985) Matteucci, F., & Tosi, M. 1985, MNRAS, 217, 391
- Momany et al. (2005) Momany, Y., et al. 2005, A&A, 439, 111
- Olive et al. (1997) Olive, K. A., Steigman, G., & Skillman, E. D. 1997, ApJ, 483, 788
- Origlia et al. (2001) Origlia, L., Leitherer, C., Aloisi, A., Greggio, L., & Tosi, M. 2001, AJ, 122, 815
- Pagel et al. (1992) Pagel, B. E. J., Simonson, E. A., Terlevich, R. J., & Edmunds, M. G. 1992, MNRAS, 255, 325
- Petrosian et al. (1997) Petrosian, A. R., Boulesteix, J., Comte, G., Kunth, D., & Lecoarer, E. 1997, A&A, 318, 390
- Pilyugin (1993) Pilyugin, L. S. 1993, A&A, 277, 42
- Sargent & Searle (1970) Sargent, W. L. W., & Searle, L. 1970, ApJ, 162, L155
- Searle & Sargent (1972) Searle, L., & Sargent, W. L. W. 1972, ApJ, 173, 25
- Searle et al. (1973) Searle, L., Sargent, W. L. W., & Bagnuolo, W. G. 1973, ApJ, 179, 427
- Silva-Villa & Larsen (2011) Silva-Villa, E., & Larsen, S. S. 2011, A&A, 529, A25
- Sirianni et al. (2005) Sirianni, M., et al. 2005, PASP, 117, 1049
- Skillman & Kennicutt (1993) Skillman, E. D., & Kennicutt, R. C., Jr. 1993, ApJ, 411, 655 2005, PASP, 117, 1049
- Stasińska & Leitherer (1996) Stasińska, G., & Leitherer, C. 1996, ApJS, 107, 661
- Stetson (1987) Stetson, P. B. 1987, PASP, 99, 191
- Stetson (1994) Stetson, P. B. 1994, PASP, 106, 250
- Tolstoy et al. (2009) Tolstoy, E., Hill, V., & Tosi, M. 2009, ARA&A, 47, 371
- Tosi et al. (2007) Tosi, M., Aloisi, A., Mack, J., & Maio, M. 2007, IAU Symposium, 235, 65
- Tosi (2009) Tosi, M. 2009, IAU Symposium, 258, 61
- van der Marel & Cioni (2001) van der Marel, R. P., & Cioni, M.-R. L. 2001, AJ, 122, 1807
- van Zee et al. (1998) van Zee, L., Westpfahl, D., Haynes, M. P., & Salzer, J. J. 1998, AJ, 115, 1000
- Zwicky (1966) Zwicky, F. 1966, ApJ, 143, 192