On the origin of intergranular jets
Abstract
We observe that intergranular jets, originating in the intergranular
space surrounding individual granules, tend to be associated with granular
fragmentation, in particular, with the formation and evolution of a bright
granular lane (BGL) within individual granules. The BGLs have recently been
identified as vortex tubes by Steiner et al. We further discover the
development of a well-defined bright grain located between the BGL and the dark
intergranular lane to which it is connected. Signatures of a BGL may reach
the lower chromosphere and can be detected in off-band H images. Simulations
also indicate that vortex tubes are frequently associated with small-scale
magnetic fields. We speculate that the intergranular jets detected in the NST
data may result from the interaction between the turbulent small-scale fields
associated with the vortex tube and the larger-scale fields existing in the
intergranular lanes. The intergranular jets are much smaller and weaker than all
previously known jet-like events. At the same time, they appear much more
numerous than the larger events, leading us to the speculation that the total
energy release and mass transport by these tiny events may not be negligible in
the energy and mass-flux balance near the temperature minimum atop the
photosphere. The study is based on the photospheric TiO broadband (1.0 nm)
filter data acquired with the 1.6 m New Solar Telescope (NST) operating at the
Big Bear Solar Observatory. The data set also includes NST off-band H images
collected through a Zeiss Lyot filter with a passband of 0.025 nm.
1 Introduction
The New Solar Telescope (NST Goode et al., 2010a) of Big Bear Solar Observatory enabled us to resolve previously unknown, even finer chromospheric features in blue shifted off-band H images (Goode et al., 2010b). These absorbtion features, arising from the dark intergranular lanes, are granular in extent, short-lived, and show jet-like upflows (Doppler shifted to the blue). Their presence in the far blue shifted images indicates fast plasma upflows. Their origin seems neither to be unequivocally tied to concentrations of photospheric bright points nor predominantly associated with the vertex formed by three (or more) granules. A visual inspection of NST data revealed that they frequently originate from an intergranular lane separating two granules. This is also the location where magnetic fields occur (e.g., Berger& Title, 2001; Ishikawa et al., 2008). The projection of these jet-like features onto the image plane may reach of typical length of 1 Mm, while maintaining their width at 0.2 Mm during a typical lifetime of 30-60s (some as long as 4 min).
Jets and associated chromospheric dynamics may play an important role in chromospheric and coronal heating. Observations of active regions offered some explanations for upflows observed in UV, such as coronal reconnection (Brooks et al., 2008; Harra et al., 2008; Baker et al., 2009), emerging flux (Harra et al., 2010), as well as intermittency at the edges of active regions (He et al., 2010), and active region expansion (Murray et al., 2010). In quiet Sun areas and in coronal holes, the situation is less well-understood, mainly because of limited spatial resolution. Difficulties also arise from the fact that the chromosphere is a quite complex layer with the complexity arising mainly from the temperature and density distribution.
In this study, we demonstrate that the small-scale intergranular jet-like events are clearly associated with the vortex tubes, predicted by Steiner et al. (2010). The study is based on the NST photospheric (TiO) and chromospheric (H ) images and the comparison with model predictions.
2 Observations
A small coronal hole (CH) located at N03E12 was observed using the NST (Goode et al., 2010a, b) with adaptive optics on August 31, 2010 from 17:40 to 18:16 UT. This CH first appeared on the solar disk on August 30 and then it slowly expanded and gradually migrated in a southward direction. According to an SDO/AIA 192Å image taken at 17:46:56 UT, the CH appeared to be magnetically connected to the neighboring NOAA AR 11101 by a set of dark loops.
Two distinct NST data sets were acquired simultaneously with a broad-band filter imager (BFI) using a TiO 1.0 nm filter centered at 705.7 nm and a narrow-band filter imager (NFI) utilizing an H Zeiss Lyot filter with a passband of 0.025 nm. The pixel sizes for the NFI and BFI data were 0.0375” and 0.075”, respectively, and the field of view of both instruments was 77”.
All time series were corrected for dark current and flat field, and then speckle reconstructed employing the KISIP speckle reconstruction code (Wöger & von der Lühe, 2007). Each reconstructed image was derived from the 70 best 1 ms exposures (20 ms in the case of H Zeiss data), acquired in quick succession within a 7 s burst.
The resulting TiO data have a cadence of 10 s. During the observations, the Lyot filter was switching between three wavelengths. In this observing mode, 4 consecutive images were taken at H-0.1 nm, and one image was taken at H line center and H+0.07 nm, respectively. Therefore, the groups of 4 H-0.1 nm images follow each other with a 30 s interval, while the cadence within a group is 10 s. The resulting H line center and H+0.07 nm images are available with a 65 sec cadence. All images in the data sets were rigidly co-aligned using cross-correlation and then de-stretched to remove distortions due to residual seeing effects of the Earth’s atmosphere. The final time series contained 183 TiO images and 103 H-0.1 nm images and the FOV was 34”.
3 Results
In order to link photospheric dynamics to chromospheric activity, TiO and H data sets were accurately co-aligned and combined images were produced, where TiO granulation is overlayed with H-0.1 nm jet-like features.
We used this composite data set to search for sources of small-scale intergranular jet-like events (Goode et al., 2010b). Each intergranular event was identified as follows: 1) it should be a narrow, elongated structure, 2) it should be present in several consecutive images; 3) one end of the streak should originate in an intergranular lane; 4) the opposite end should be evolving (i.e., extending, shrinking, showing variations in darkening); we thus found that intergranular events are very often associated with rapidly evolving granules, more precisely, with instances in which granule fragments are pushed into the intergranular lane. A more detailed analysis of granular evolution led us to conclude that intergranular events are most often associated with what was identified by Steiner et al. (2010) as a vortex tube. At the same time, not every vortex tube event was accompanied by a chromospheric jet.
3.1 Development and Evolution of Bright Granular Lanes
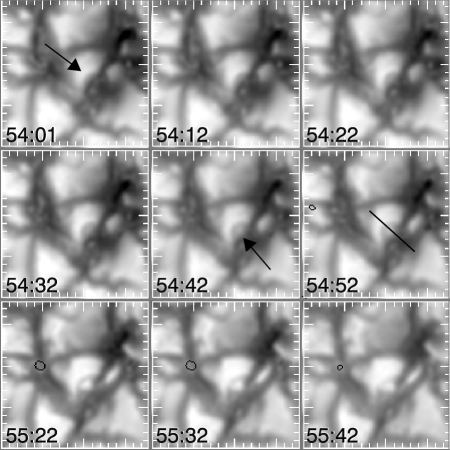
Figure 1 shows the evolution of a bright granular lane (BGL), which was associated with very weak chromospheric activity. The arrow in the 54:01 panel points to a BGL, which usually indicates the development of a vortex tube. The BGL first forms near the edge of a granule (indicated in the 54:01 frame), and then it is displaced toward the granule’s center and one or several bright grains appear in its place (indicated in the 54:42 frame). The estimated speed of the BGL displacement may reach up 2 km s-1. Steiner et al. (2010) proposed that the BGL is the most apparent signature of a horizontally oriented vortex tube, with up-flows in the BGL and downflows in the intergranular space.
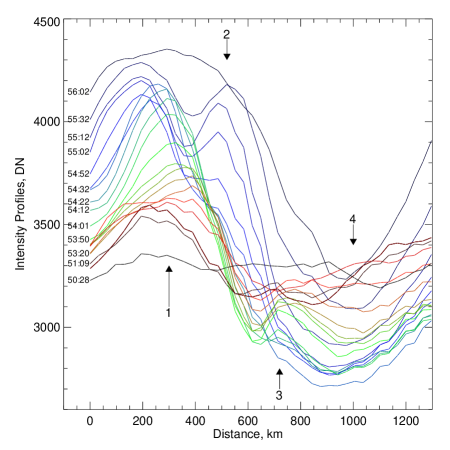
Figure 2 shows the evolution of intensity profiles along the line segment shown in the 54:52 panel of Figure 1. The profiles detail all stages of the vortex tube’s development. The red profiles reflect an early stage (17:50 – 17:54 UT) of development (arrow 1), during which the BGL had a low, broad profile. Between 17:54 and 17:55 UT (green and dark blue profiles) one side of the BGL (at ) rapidly intensified and the peak of the bright structure was shifting toward the center of the granule (i.e., toward km). After 17:54:30 UT, we observe the growth of a bright grain (indicated by arrow 2, see also the 54:42 frame in Figure 1). By 17:55:30 UT, the intensity of the grain nearly matched that of the BGL, and later those two structures formed one broad bright patch at the edge of the host granule. Since neither the BGL nor the grain showed any sense of displacement toward each other, we speculate that the apparent merging of these two intensity structures could be due to their horizontal expansion. Finally, after 17:56 UT the bright patch began to fade and several minutes later the corresponding intensity profile (not shown in the figure) was close to the pre-event profile at 17:50 UT.
The observed time profiles of the BGL are in a very good agreement with the synthesized intensity profile presented by Steiner et al. (2010). In particular, the 17:54:52 profile, where the bright grain is seen as a plateau at , is the best match to the snapshot shown in Fig. 5 of Steiner et al. (2010). According to the model data, the plateau normally develops into a structure reminiscent of the grain described here. Also, both the observed size of the vortex tube, measured from the BGL to the intergranular lane (0.8 Mm) and the distance between the BGL and the grain (0.3 Mm) closely match the model data.
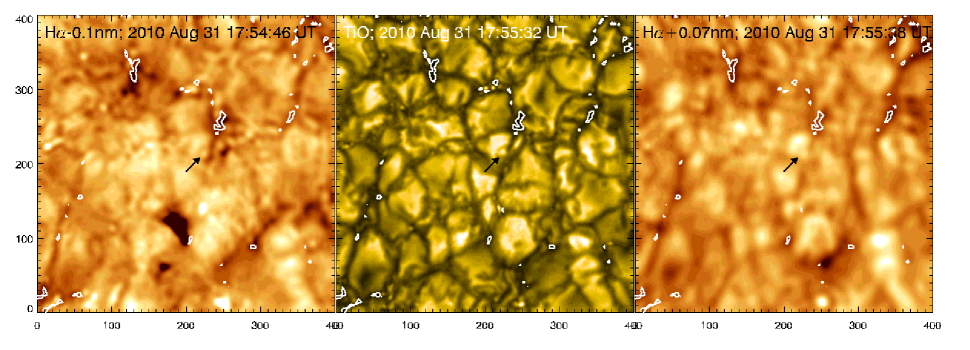
Figure 3 shows three images of the above event as seen in H and TiO spectral lines. The left panel is a H -0.1 nm image, while the right panel shows a H +0.07 nm image taken nearly 1 min later. The middle panel is a TiO image at 17:55:32U UT. The faint white contours are the same in all three images and they are intended to facilitate the comparison between all three panels. The contours encircle the darkest TiO features, and they also show that the co-aliment between the TiO and H data sets is not worse than 3 pixels or 0”.11. Note that the short ticks separate 10 pixel intervals. The field of view of these images is 15”15” or 1111 Mm. We note that both the BGL and the grain can be identified in all three images, which means that the vortex-tube signatures are present in the lower chromosphere. Also, this event was associated with a faint chromospheric darkening in the blue H nm, image (left panel), not present in the red shifted, H nm, image (right panel), which indicates that the absorption features accompanying vortex-tube events are chromospheric upflows.
The event shown in Figures 1 and 3 can be characterized as an exemplary event, meaning that the BGL has a nearly ideal semi-circular shape. The majority of observed BGLs are less ideal and they may appear as a nearly straight line with (sometimes) jagged edges, especially in cases when two or three bright grains are present.
3.2 Chromospheric Activity Associated with Bright Granular Lanes
At the peak of the BGL development, one or two jet-like darkenings, co-spatial with the BGL, may appear in the blue-shifted H images. These absorption features seem to originate in the intergranular lane adjacent to the bright grain. Figures 4-5 show three examples of chromopheric activity (i)-(iii) associated with the formation of a BGL.
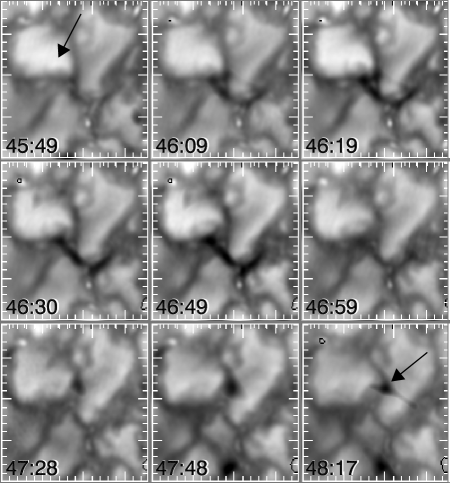
The first event began at 17:45:59 UT and lasted for about 100 s until 17:47:08 UT (Figure 4). The arrow in the 45:49 panel indicates the location of a BGL, which assumed a crescent-like shape and moved toward the center of a granule revealing a bright grain. A single strand dark jet-like feature (i) began to develop at the same time and its intensity peaked at about 17:46:49 UT, while the 47:28 frame shows that chromospheric feature gone. The BGL features had faded out by about the same time. The two bottom rows of Figure 4 show a second small-scale event immediately following the first one. Frame 48:17 clearly shows that the newly developed feature is reminiscent of an inverted “Y” jet reported by Shibata et al. (2007). This inverted “Y” feature (ii) had one footpoint co-spatial with the fading BGL, while the other one appeared to be rooted in the adjacent intergranular lane.
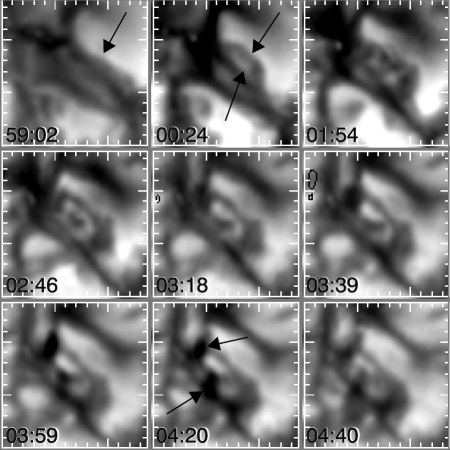
Figure 5 is an example of an extended BGL, where its shape is oblong rather than semi-circular. Similarly to other events, this BGL lane (arrows in the 59:02 and 00:24 frames) shifted to the center of the granule giving way to a bright grain (lower arrow in the 00:24 panel), which is elongated in the direction of the BGL along the intergranular lane. Starting at 17:03:50 UT, two small chromospheric darkenings (iii) began to intensify on either side of the elongated grain (04:20 frame) and these features lasted for about 50 s.
The three types of events (i)-(iii) discussed above are the most frequently observed types. Other, although less numerous, BGL-jet events may include 2 or 3 H absorption features, two simultaneous BGLs in one host granule and well-defined grains elongated in the direction perpendicular to the BGL and the intergranular lane.
4 Conclusions and Discussion
Using NST TiO and H observations, we discovered that small-scale intergranular jets, first described in Goode et al. (2010b), are associated with bright granular lanes (BGLs) developing inside photospheric granules. The BGLs are thought to be a signature of vortex tubes and they were first found in solar and simulation data by Steiner et al. (2010). We summarize our new findings as follows: i) our conservative estimate is that more than half of a total of 100 well identified tiny intergranular jets are co-spatial and co-temporal with the occurrence of BGLs, although not each BGL event is accompanied with small-scale chromospheric activity; ii) along with the BGL, a vortex tube also develops a well-defined bright grain located between the BGL and the dark intergranular lane; and iii) vortex-tube signatures may reach the lower chromosphere and can be detected in off-band H images. The bright grain, described here, appears to correspond to the plateau in the model intensity profile presented in Figure 5 in Steiner et al. (2010).
According to the simulation data, the darkish space between the bright grain and the BGL coincides with the axis of the vortex tube. The interpretation is that due to low pressure and temperature, the opacity above the vortex tube is reduced thus allowing us to peer deeper into its relatively cooler interior. What is the bright grain then? Is it part of the vortex tube? Does this interpretation hold when we consider the fact that the vortex tube can reach the chromosphere? As it follows from simulations, the associated magnetic field, is generally wrapped up in such a way, that the field is mainly aligned with the flow, i.e., it is rather perpendicular to the vortex tube axis. The high-speed flow above the vortex tube reaches up to the top of the photosphere with velocities up to 8 km s-1 and sweeps the magnetic field in the horizontal direction to the intergranular lane. It may be that this field collides with the nearby intergranular field of possibly opposing polarity, which has the potential to cause some chromospheric activity.
We do not know, however, if BGL events seen in images of granulation possess magnetic fields strong enough to cause detectable chromospheric activity. Polarization measurements with the baloon-borne solar telescope SUNRISE failed to detect magnetic field signal associated with a vortex tube (Steiner et al., 2010). A brief review of published Hinode/SP data (e.g., Centeno et al., 2007; Lites et al., 2008; Ishikawa et al., 2010; Gömöry et al., 2010) indicates that Hinode/SP intensity maps may have insufficient spatial resolution to reliably discern a BGL event, so that no reliable conclusions on the association between a BGL and the magnetic field can be made. Nevertheless, Centeno et al. (2007, left panel in their Figure 1) studied a flux-emergence event associated with a particular pattern in the intensity maps that could be interpreted as an evolving BGL. Orozco Suárez et al. (2008) presented data for two flux-emergence events, where increased circular polarization polarization was co-spatial with enhanced brightness within a granule. Zhang et al. (2009) reported that granules tend to fragment when magnetic fields emerge within them. Simulations by Tortosa-Andreu & Moreno-Insertis (2009) seem to confirm the latter by showing that surface temperature structures change as field emerges. On the other hand, Gömöry et al. (2010) argue that an emerging loop leaves no detectable brightness pattern on the host granule.
Stenflo (2011) underscored the possible existence of two distinct populations of the solar magnetic fields: i) strong, or collapsed, fields predominantly located in the intergranular lanes and manifested via photospheric bright points and ii) weak, or uncollapsed, flux occupying both intergranular lanes and bright granules with a weak preference for the bright granular cells. The uncollapsed population is thought to represent weaker turbulent fields with spatial scales too small to be fully resolved with today’s state-of-the-art instrumentation. In this case, we suggest that the intergranular jets, associated with the development of BGLs, may be a manifestation of these weaker turbulent fields, the bulk of which apparently remains hidden at spatial scales below 200 km (Stenflo, 2011). The intergranular jets are much smaller and weaker than all previously known jet-like events. At the same time, they appear much more numerous than the larger events, leading us to the speculation that the total energy released by these tiny events may not be negligible in the total energy balance.
Authors thank BBSO observers and the instrument team for their contribution to this study. VY work was partly supported under NASA GI NNX08AJ20G and LWS TR&T NNG0-5GN34G grants. VA acknowledges partial support from NSF grant ATM-0716512. PG, VA and VY are partially supported by NSF (AGS-0745744), NASA (NNY 08BA22G). PG is partially supported by AFOSR (FA9550-09-1-0655). OS acknowledges insightful discussions on small-scale filament formation within the ISSI International Team lead by I.N. Kitiashvili at ISSI (International Space Science Institute) in Bern.
References
- Baker et al. (2009) Baker, D., van Driel-Gesztelyi, L., Mandrini, C. H., Démoulin, P., & Murray, M. J. 2009, ApJ, 705, 926
- Berger& Title (2001) Berger, T. E., & Title, A. M. 2001, ApJ, 553, 449
- Brooks et al. (2008) Brooks, D. H., Ugarte-Urra, I., & Warren, H. P. 2008, ApJ, 689, L77
- Centeno et al. (2007) Centeno, R., et al. 2007, ApJ, 666, L137
- Gömöry et al. (2010) Gömöry, P., Beck, C., Balthasar, H., Rybák, J., Kučera, A., Koza, J., & Wöhl, H. 2010, Astron. Astrophys., 511, A14
- Goode et al. (2010a) Goode, P. R., Coulter, R., Gorceix, N., Yurchyshyn, V., & Cao, W. 2010a, Astronomische Nachrichten, 88, 789
- Goode et al. (2010b) Goode, P. R., Yurchyshyn, V., Cao, W., Abramenko, V. I., Andic, A., Ahn, K., & Chae, J. 2010b, ApJ, 714, L31
- Harra et al. (2010) Harra, L. K., Magara, T., Hara, H., Tsuneta, S., Okamoto, T. J., & Wallace, A. J. 2010, Sol. Phys., 263, 105
- Harra et al. (2008) Harra, L. K., Sakao, T., Mandrini, C. H., Hara, H., Imada, S., Young, P. R., van Driel-Gesztelyi, L., & Baker, D. 2008, ApJ, 676, L147
- He et al. (2010) He, J., Marsch, E., Tu, C., Guo, L., & Tian, H. 2010, Astron. Astrophys., 516, A14
- Ishikawa et al. (2010) Ishikawa, R., Tsuneta, S., & Jurčak, J. 2010, ApJ, 713, 1310
- Ishikawa et al. (2008) Ishikawa, R., et al. 2008, Astron. Astrophys., 481, L25
- Lites et al. (2008) Lites, B. W., et al. 2008, ApJ, 672, 1237
- Murray et al. (2010) Murray, M. J., Baker, D., van Driel-Gesztelyi, L., & Sun, J. 2010, Sol. Phys., 261, 253
- Orozco Suárez et al. (2008) Orozco Suárez, D., Bellot Rubio, L. R., del Toro Iniesta, J. C., & Tsuneta, S. 2008, Astron. Astrophys., 481, L33
- Shibata et al. (2007) Shibata, K., et al. 2007, Science, 318, 1591
- Steiner et al. (2010) Steiner, O., et al. 2010, ApJ, 723, L180
- Stenflo (2011) Stenflo, J. O. 2011, Astron. Astrophys., 529, A42+
- Tortosa-Andreu & Moreno-Insertis (2009) Tortosa-Andreu, A., & Moreno-Insertis, F. 2009, Astron. Astrophys., 507, 949
- Wöger & von der Lühe (2007) Wöger, F., & von der Lühe, O. 2007, Appl. Opt., 46, 8015
- Zhang et al. (2009) Zhang, J., Yang, S., & Jin, C. 2009, Research in Astronomy and Astrophysics, 9, 921