The cosmological size and velocity dispersion evolution of massive early-type galaxies
Abstract
We analyze 40 cosmological re-simulations of individual massive galaxies with present-day stellar masses of in order to investigate the physical origin of the observed strong increase in galaxy sizes and the decrease of the stellar velocity dispersions since redshift . At present 25 out of 40 galaxies are quiescent with structural parameters (sizes and velocity dispersions) in agreement with local early type galaxies. At z=2 all simulated galaxies with (11 out of 40) at z=2 are compact with projected half-mass radii of 0.77 (0.24) kpc and line-of-sight velocity dispersions within the projected half-mass radius of 262 (28) kms-1 (3 out of 11 are already quiescent). Similar to observed compact early-type galaxies at high redshift the simulated galaxies are clearly offset from the local mass-size and mass-velocity dispersion relations. Towards redshift zero the sizes increase by a factor of , following with for quiescent galaxies ( for all galaxies). The velocity dispersions drop by about one-third since , following with for the quiescent galaxies ( for all galaxies). The simulated size and dispersion evolution is in good agreement with observations and results from the subsequent accretion and merging of stellar systems at which is a natural consequence of the hierarchical structure formation. A significant number of the simulated massive galaxies (7 out of 40) experience no merger more massive than 1:4 (usually considered as major mergers). On average, the dominant accretion mode is stellar minor mergers with a mass-weighted mass-ratio of 1:5. We therefore conclude that the evolution of massive early-type galaxies since and their present-day properties are predominantly determined by frequent ’minor’ mergers of moderate mass-ratios and not by major mergers alone.
Subject headings:
galaxies: elliptical – galaxies: interaction– galaxies: dynamics – galaxies: evolution – methods: numerical1. Introduction
There is growing observational evidence for the existence of a population of massive galaxies () with small sizes () and low star formation rates at redshift . These galaxies are smaller by a factor of three to five compared to present-day ellipticals at similar masses (e.g. Hyde & Bernardi, 2009) and their effective stellar densities are at least one order of magnitude higher (Daddi et al., 2005; Trujillo et al., 2006; Longhetti et al., 2007; Toft et al., 2007; Trujillo et al., 2007; Zirm et al., 2007; Buitrago et al., 2008; van Dokkum et al., 2008; Cimatti et al., 2008; Franx et al., 2008; Saracco et al., 2009; Bezanson et al., 2009; Damjanov et al., 2009, 2011). Deep observations down to low surface brightness limits (H 28 mag arcsec-2) show no evidence for faint, previously missed, stellar envelopes (Carrasco et al., 2010; Szomoru et al., 2010) and measurements of higher velocity dispersions seem to independently confirm previous high mass estimates (van der Wel et al., 2005, 2009; Cenarro & Trujillo, 2009; van Dokkum et al., 2009; Cappellari et al., 2009; Martinez-Manso et al., 2011).
Quiescent (red & dead) galaxies make up about half of the general high redshift (z 2) population of massive galaxies and most of them (90%) are found to be compact (Kriek et al., 2006; van Dokkum et al., 2006, 2008; Williams et al., 2009). In the local Universe, galaxies of similar mass and size are extremely rare (Trujillo et al., 2009) or do not exist at all (Taylor et al., 2010). This indicates that present-day early-type galaxies were not fully assembled at and underwent significant structural evolution until the present day. Observations of the growth of massive galaxies since selected at constant number density (van Dokkum et al., 2010) indicate that they grow inside-out. A quiescent - without significant in-situ formation of new stars - build-up of extended stellar envelopes can originate from minor mergers and was predicted from cosmological simulations (Naab et al., 2007, 2009; Oser et al., 2010) and recently, for the first time such minor mergers at high redshift might have been directly observed (van Dokkum & Brammer, 2010; Carrasco et al., 2010).
A simple picture of high redshift monolithic formation or, similarly, a binary merger of massive very gas-rich disks at z 2 - which has been suggested as a reasonable formation mechanism for compact high-redshift galaxies (Wuyts et al., 2010; Ricciardelli et al., 2010; Bournaud et al., 2011) - followed by passive evolution can be ruled out (Kriek et al., 2008; van Dokkum et al., 2008; Trujillo et al., 2009) unless the increase in size of ellipticals can be explained by secular processes such as adiabatic expansion driven by stellar mass loss and/or strong feedback (Fan et al., 2008; Damjanov et al., 2009; Fan et al., 2010). This process seems to be disfavored by observations (e.g. Hopkins et al., 2010b; Trujillo et al., 2011) and the absence of a significant young stellar population would indicate that such hypothesized secular processes would need to occur without significant star formation.
Based on high-resolution cosmological simulations of individual galaxies, Naab et al. (2007, 2009) and Oser et al. (2010) provide an explanation for the size growth and the decrease in velocity dispersion, which is consistent with the cosmological hierarchical buildup of galaxies. The compact cores of massive galaxies form during an early rapid phase of dissipational in-situ star formation at fed by cold flows (Kereš et al., 2005; Dekel et al., 2009; Oser et al., 2010) and/or gas rich mergers leading to large stellar surface densities (Weinzirl et al., 2011). At the end of this phase the observed as well as simulated galaxies are more flattened and disk-like than their low redshift counterparts (van Dokkum et al., 2008; Naab et al., 2009; van der Wel et al., 2011). They are already massive () but have small sizes of 1 kpc and velocity dispersions of 240 kms-1 (see also Joung et al., 2009), in general agreement with observations. The subsequent evolution is dominated by the addition of stars that have formed ex-situ, i.e. outside the galaxy itself (Oser et al., 2010). These accreted stars typically settle at larger radii (see also Coccato et al., 2011). The early domination of in-situ star formation and the subsequent growth by stellar mergers is in agreement with predictions from semi-analytical models (Kauffmann, 1996; Khochfar & Silk, 2006a; De Lucia et al., 2006; De Lucia & Blaizot, 2007; Guo & White, 2008; Shankar et al., 2010a, b) and the assembly scenario discussed in Kormendy et al. (2009).
In the absence of gas, stellar (i.e. collisionless) accretion and ’dry’ merging in general is an energy conserving process in the sense that none of the gravitational and binding energy in the accreted systems can be radiated away during the merging event. Therefore, while the galaxies grow in mass, they must significantly increase their sizes and, eventually, decrease their velocity dispersions during this phase, in particular if the stars are accreted in minor mergers. In massive galaxies that are embedded in a hot gaseous halos some fraction of the gravitational energy can be radiated away (Johansson et al., 2009b). Cole et al. (2000), Naab et al. (2009) and Bezanson et al. (2009) presented the simple virial arguments for why minor mergers lead to a stronger size increase and a decrease in velocity dispersion than the more commonly studied major mergers (Naab et al., 2006).
In Oser et al. (2010) we investigated this two phase scenario in more detail with a larger sample of re-simulations and found a connection between galaxy mass, size, and the assembly history (see also Khochfar & Silk, 2006a; De Lucia & Blaizot, 2007; Guo & White, 2008; Hopkins et al., 2009b; Feldmann et al., 2010). More massive present-day systems contain a larger fraction of accreted stars (up to 80 per cent) which, over time, build an outer envelope and increase the size of the systems (Naab et al., 2009; Hopkins et al., 2009a; Oser et al., 2010; Feldmann et al., 2010). This scenario receives support from recent observational findings that massive galaxies have increased their mass at radii by a factor of 4 since z=2 with the mass at smaller radii being essentially unchanged (van Dokkum et al., 2010). It is also the favored model to explain observed kinematics (Arnold et al., 2011) and metallicity gradients (Forbes et al., 2011) of globular cluster populations in nearby elliptical galaxies.
In this paper we analyze a subset of massive galaxies from the Oser et al. (2010) simulations with a particular focus on the evolution of sizes and velocity dispersions since . The paper is organized as follows: In section 2 we briefly review the simulations. The results on the evolution of size and velocity dispersion are presented in sections 3 and 4. The stellar merger histories of the resimulated galaxies are reviewed in section 5. We conclude and discuss our results in section 6.
2. High resolution simulations of individual galaxy halos
The results presented in this paper are drawn from 40 ’zoom-in’ hydrodynamic simulations of individual halos which are presented in detail in Oser et al. (2010). The halos are picked from a dark matter only simulation using a flat cosmology with parameters obtained from WMAP3 (Spergel et al., 2007): and an initial slope of the power spectrum of . From redshift zero we trace back in time all particles close to the halos of interest at any given snapshot. Those particles are then replaced with high-resolution gas and dark matter particles. The original dark matter particles are merged (depending on their distance to the re-simulated halo) to reduce the particle count and the simulation time. The new high mass resolution initial conditions are evolved from redshift z=43 to the present day using a modified version of the parallel TreeSPH code GADGET-2 (Springel, 2005) including star formation, supernovae feedback (Springel & Hernquist, 2003) and cooling for a primordial composition of hydrogen and helium. Additionally, the simulations include a redshift-dependent UV background radiation field with a modified Haardt & Madau, 1996 spectrum.
The simulated halo masses cover the range and the central galaxy masses are between at . The masses for the gas and star particles are (we spawn one star particle per gas particle), whereas the dark matter particles have a mass of . The comoving gravitational softening lengths used are for the gas and star particles and for the dark matter. At the corresponding physical softening length for stars is . The integration accuracy parameter was set to 0.005 to guarantee accurate time integration (Springel, 2005). In the following we present the results for 40 galaxies with masses larger than for direct comparison with observations. These galaxies are well resolved with particles within the virial radius (, the radius where the spherical overdensity drops below 200 times the critical density of the universe at a given redshift). Using the above simulation parameters for zoom simulations have been shown to result in galaxies with reasonable present-day properties (Naab et al., 2007; Johansson et al., 2009b; Naab et al., 2009; Oser et al., 2010). However, the fraction of available baryons converted into stars, , for galaxies in this mass range is typically 2 times higher than estimates from models that are constructed by matching observed luminosity functions to simulated halo mass functions (Guo et al., 2010; Moster et al., 2010; Behroozi et al., 2010, and references therein).
3. Redshift evolution of sizes
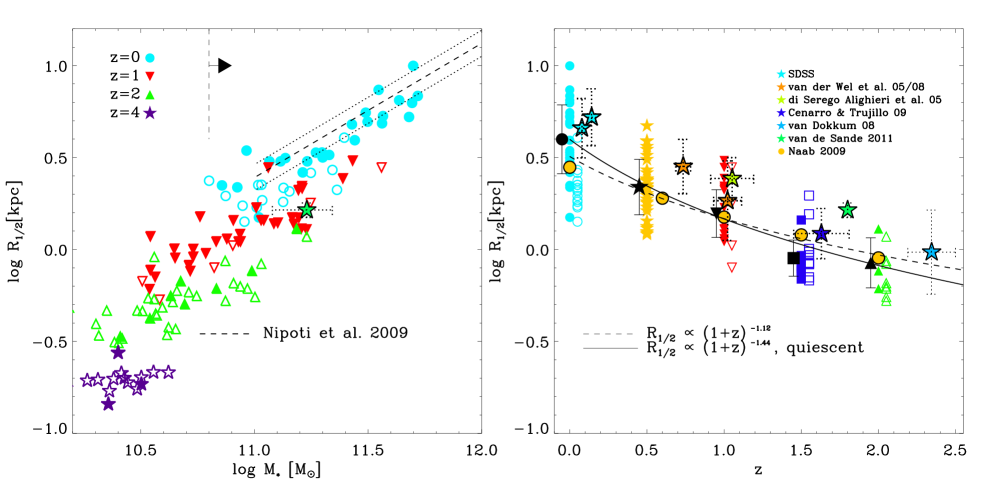
In the left panel of Fig. 1 we show the projected half-mass radii of the simulated galaxies as a function of their stellar mass at z=0 (blue circles), as well as the sizes and masses of their most massive progenitors at z=1 (red triangles), z=2 (green triangles), and z=4 (purple stars). We determine the center of the galaxies using the shrinking sphere technique described in Power et al. (2003), starting at redshift 0 with a sphere that contains all the stellar particles. In all the previous snapshots the center of the most massive progenitor is found with the same technique starting with a sphere of a radius of at least that encompasses the 50 innermost particles identified in the last processed snapshot. The sizes indicated here are the mean values of the half-mass radii of all stars within (considered the central galaxy) projected along the three principal axes of the main stellar body. We always show the median of the sizes of the galaxies that we compute from the snapshot at the target redshift as well as the two snapshots before and after this one to avoid outliers caused interacting systems. We separate the sample into quiescent galaxies (solid symbols) with specific star formation rates (Franx et al., 2008), where is the age of the Universe at each redshift. Star forming galaxies are indicated by open symbols and have . The dashed black line shows the z=0 linear fit to the SLACS sample of local early-type galaxies (Nipoti et al., 2009) with the observed scatter given by the dotted lines, which is in good agreement with the simulated galaxy sizes. Other published local mass-size relations have slightly different slopes and offsets (see e.g. Hyde & Bernardi, 2009; Guo et al., 2009; Williams et al., 2010) which does, however, not affect our general conclusions. At z=4 all progenitor galaxies are very compact with similar sizes () independent of their mass. During this phase the formation of the proto-galaxies is dominated by gas dissipation and in-situ star formation (Naab et al., 2009; Joung et al., 2009; Oser et al., 2010). By z=2 a clearly visible mass-size relation has already developed. At this epoch the most massive galaxies of our sample have experienced the most rapid size growth with half-mass radii up to for galaxies with in stellar mass, in good agreement even with the most recent observations (e.g. Ryan et al., 2010; van der Wel et al., 2011; Cassata et al., 2011). Towards z=0 the simulated galaxies continue to grow in size as well as mass. The descendants of galaxies that are already massive () at z=2 (green symbols to the right of the vertical dashed line) increase their mass by a factor of 3.5 ( of the accumulated mass is due to stellar accretion) and their projected half mass radii grow by a factor of 6.5. On average, all simulated galaxies more massive than at any given redshift grow by a factor of 2.1 in mass (see e.g. Faber et al. (2007)) and a factor of 4.6 in radius since z=2. This already indicates that the size growth cannot be the result of equal-mass dry mergers, since the ensuing size growth should be, at most, directly proportional to the mass increase (Nipoti et al., 2003, 2009; Naab et al., 2009). Overall, the size growth is differential, i.e. the most massive galaxies show the strongest size increase and the tilt of the mass-size relation increases towards lower redshifts. Fitting all galaxies with we find at z=2 and at z=0. For quiescent galaxies (with worse statistics) we find no trend for differential size growth with at z=2 and at z=0. This is in qualitative agreement with recent observations by Williams et al. (2010) who do not find observational indications for a differential size growth of quiescent galaxies.
Observed sizes of massive galaxies are found to evolve as . Depending on the selection criteria (specific star formation rate, concentration etc.) and observed redshift range the observed values of for massive ellipticals range from = -0.75 (Newman et al., 2010) to = -1.62 (Damjanov et al., 2011). Franx et al. (2008) find for all galaxies in this mass range () whereas for quiescent massive galaxies the observed size evolution is faster with . Cassata et al. (2011) obtain values from = -0.87 to = -1.42 depending on stellar mass. van der Wel et al. (2008) find a value of -0.98, when they include results from previous surveys this changes to -1.20. A similar trend () is found for UV-bright galaxies (Mosleh et al., 2011).
In the right panel of Fig. 1 we show the size evolution of galaxies more massive than (see Franx et al., 2008) since z=2. At z=4 all progenitor galaxies drop below the threshold mass, but are still resolved by particles. We added the results from Naab et al. (2009), which were obtained with the same simulation code but with a softening length fixed in physical units. The size evolution in this case is very similar to the simulations that uses a fixed comoving softening length. We also included various observational results which find slightly larger sizes at a given redshift but with a very similar evolution in time. On average there is a strong evolution in galaxy sizes: for the power law fit to all (dashed line) and only the quiescent (solid line) simulated galaxies we find a value of and , respectively. This is in good agreement with observed values - which are possibly a bit offset to higher values - and despite our statistical limitations we consider this trend robust. Possible simple explanations for an offset in size within a semi-analytical framework are discussed in Shankar et al. (2011).
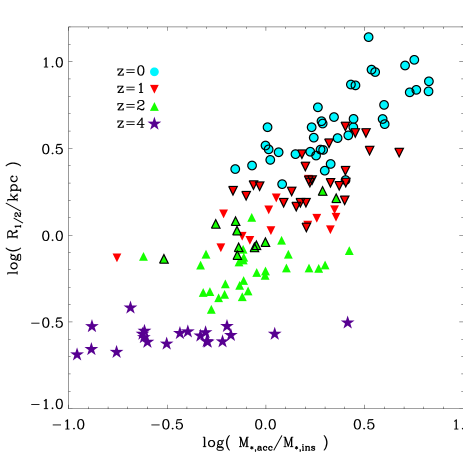
To demonstrate the physical origin for the size growth in the simulated galaxies we show in Fig. 2 the projected half-mass radii presented in Fig. 1 at different redshifts as a function of the ratio of stars accreted onto the galaxy to the stars formed in-situ in the galaxy, at the same redshifts. We consider a star particle in the simulation as formed in-situ in the galaxy if it is created inside . Black bordered symbols indicate galaxies with stellar masses larger than whose size evolution is plotted in the right panel of Fig. 1. There is a clear correlation between the relative amount of accreted stars and in-situ stars not only at redshift zero (Oser et al., 2010) but also at high redshifts (). This indicates that stellar accretion drives the size evolution of the systems as soon as the accreted stars start to dominate the total mass () at z 2 as also predicted from semi-analytical modeling (Khochfar & Silk, 2006b). At earlier times the stellar mass growth is dominated by in-situ star formation (Oser et al., 2010), i.e. the stars form out of cold gas that was able to radiate away a large fraction of its gravitational energy and thus leading to compact systems. The binding energy of the accreted stars, however, is retained and will increase the total energy content of the accreting galaxy, both by shock-heating the gas - which then can cool radiatively - as well as expanding the existing dark matter and stellar components (Johansson et al., 2009b). This in general leads to more extended systems.
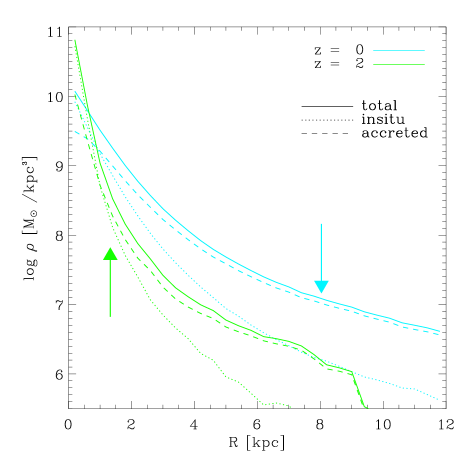
In Fig. 3 we compare the density profiles of a subsample of massive galaxies () at redshift 2 and the present day. In agreement with Naab et al. (2009) we find that within the half-mass radius the high redshift systems are dominated by stars that formed in-situ while the contribution of accreted stars to the inner mass profile is small. At the present day the stellar mass inside the effective radius is dominated by accreted stars added at radii larger than . This accretion is responsible for the strong size increase (Oser et al., 2010) and is in agreement with the results from stacked imaging for massive galaxies at a constant number density that also show an increase in surface densities predominantly in the outer regions (van Dokkum et al., 2010).
4. Redshift evolution of velocity dispersions
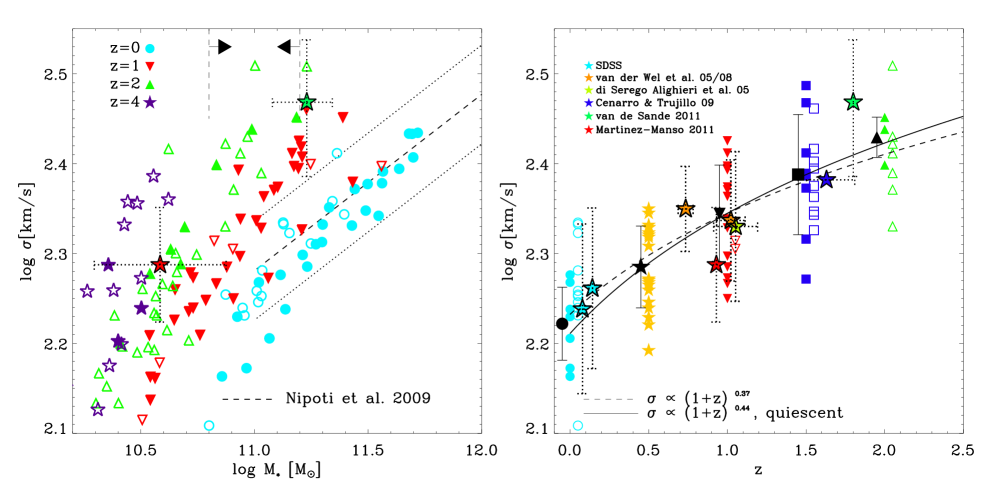
In the left panel of Fig. 4 we show the central stellar line-of-sight velocity dispersions for the simulated galaxies as a function of the stellar mass at redshift z=4 (purple stars), z=2 (green triangles), z=1 (red triangles) and z=0 (blue circles). The line-of-sight velocity dispersions have been calculated within along the three principal axes and then averaged. The mass-dispersion relation from Nipoti et al. (2009) for galaxies more massive than is indicated by the dashed line. It is evident that at a given mass range the velocity dispersions of the galaxies systematically increase with redshift. This is illustrated in the right panel of Fig. 4 where we show the evolution of the projected velocity dispersion for galaxies with masses in the range of (indicated by the vertical lines in the left panel) as a function of redshift. In this mass range the velocity dispersions drop from at z=2 to at z=0, a decrease of roughly a factor of . The evolution is statistically significant but weak (see also Hopkins et al., 2009b). The black lines show a fit for the average velocity dispersions for all (dashed line) and the quiescent (solid line) galaxies only. As for the sizes, we fit the redshift evolution of the velocity dispersions like . Again we find a slightly stronger evolution for the quiescent systems () than for all galaxies in our samples (). van de Sande et al. (2011) obtain a similar value of . Depending on selection criteria Saglia et al. (2010) find values for ranging from to . Following Cenarro & Trujillo (2009) we compare to observations of local ellipticals and measurements at higher redshift (di Serego Alighieri et al., 2005; van der Wel et al., 2005, 2008; Cenarro & Trujillo, 2009). In general we find a good agreement with the observations.
5. Stellar Merger histories
Similar to Cole et al. (2000), Naab et al. (2009) and Bezanson et al. (2009) demonstrated, using the virial theorem, how the size growth of a galaxy after a dissipationless merger event can be predicted. Assuming energy conservation and parabolic orbits (Benson, 2005; Khochfar & Burkert, 2006) the final gravitational radius of the system is given by
| (1) |
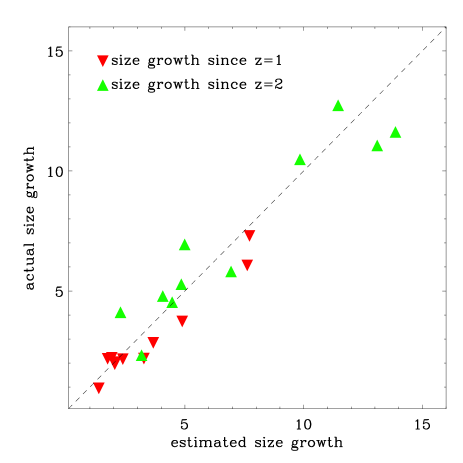
where and are the initial and final gravitational radii (before and after the merger event) which we assume to be proportional to the spherical half mass radii (Naab et al., 2009). Here, is the fractional mass increase during the merger and is the ratio of the mean square speeds of the accreted satellites and the initial system. This estimate implies that the accretion of weakly bound stellar systems () results in a particularly efficient size increase. To test the validity of this simple estimate in our full cosmological simulation we follow the stellar merger histories of our simulated galaxies. We identify every satellite merging with the most massive progenitor of the central galaxy using a FOF-finder with a minimum number of 20 stellar particles (). At all galaxies in our sample are more massive than , i.e. we resolve mergers at least down to a mass-ratio of . For the satellites as well as the host we compute the mass and the total internal velocity dispersion and with this information and Eqn. 1 we estimate the size evolution since z=2. In Fig. 5 we show the estimated size growth for all galaxies exceeding the z=2 mass limit of since redshift 2 (green triangles) and 1 (red triangles), respectively. We compare this estimated size growth to the actual size growth that we directly measure from our simulated galaxies. Considering the simplifications used in Eqn. 1 - homologous, one-component systems merging on zero energy orbits - the predicted and actual growth agree notably well. This confirms earlier findings (Naab & Ostriker, 2009) that the simple formula is a good predictor even in a full cosmological context. This approximation however can only be valid if the assembly history for is not dominated by dissipational processes which is the case for the massive systems presented here (see Oser et al., 2010 for the relevant analysis).
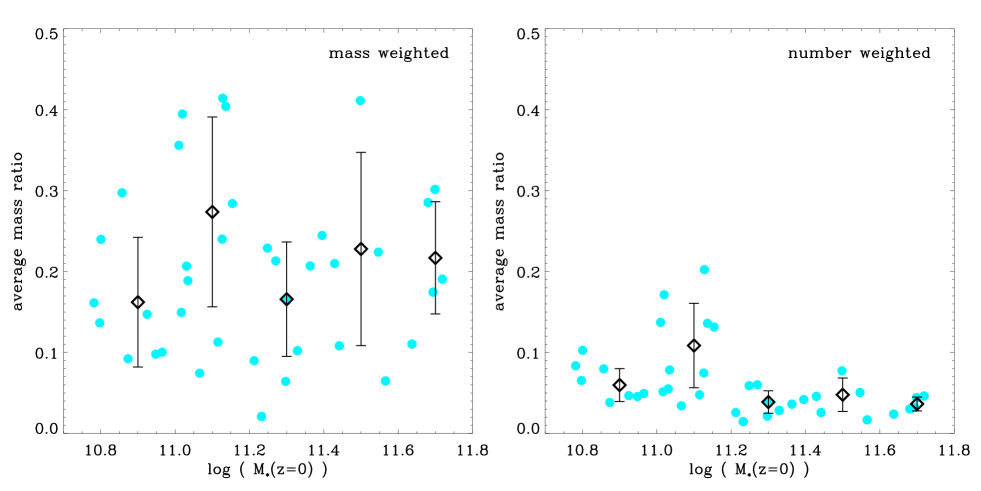
To better understand the dominant assembly mechanism of our simulated massive galaxies we have computed the average mass-weighted merger mass-ratio for every galaxy since z=2. In the left panel of Fig. 6 we show the average mass-weighted merger mass-ratio as function of present-day stellar galaxy mass (blue dots). The dependence on galaxy mass is weak. The average values in bins of 0.2 dex in mass are shown by the black diamonds with one sigma errors bars. Overall the average mass-weighted merger mass-ratio is . This makes ’minor mergers’ with mass ratios of 1:5 the dominant assembly mode, on average, for the massive simulated galaxies (see Hirschmann et al., 2011 for a representation of a typical merger tree). The tendency of this ratio to change with the mass of the host system cannot be determined by our calculations with any statistical certainty (the slope of the fitted curve is ). However, we anticipate that for very low mass galaxies major mergers would become more important. If the slope of the mass function for satellites were , then the expectation would be that the mass-weighted merger ratio would be if dynamical friction were not a dominant process and if it were dominant. Thus, for low mass parent galaxies, we would anticipate that the typical merger would be relatively ’major’ with the ratio of parent to satellite being . Here we note that a significant number of the simulated galaxies (7 out of 40, 18 per cent) do not experience any merger with a mass ratio larger than 1:4, e.g. they have experienced no major merger since z=2 at all. Estimates of merger rates for massive galaxies due to observations of disturbed systems (Jogee et al., 2009; Kaviraj et al., 2011; Lotz et al., 2011), as well as semi-analytic models lead to similar results. E.g. Khochfar & Silk (2009), Hopkins et al. (2010a) and Shankar et al. (2010a) find, that massive early-type galaxies on average encounter less than one major dry merger since their formation epoch. This confirms previous suggestions motivated by the dearth of compact galaxies in the nearby Universe, that a highly stochastical process like major mergers cannot be the main driver for the observed size evolution (Bezanson et al., 2009; Trujillo et al., 2009; Taylor et al., 2010). However, major mergers do happen and will have an impact on the early-type galaxy population. They can contribute significantly to the final stellar mass with minor mergers still dominating the size growth (Shankar et al., 2010b, 2011). The observed merger rates, which are difficult to determine, are in the range of only 1 major merger since (Bell et al., 2006; Bluck et al., 2009; Naab et al., 2006) which is consistent with our interpretation.
In the right panel of Fig. 6 we show, the more conventionally defined, average number-weighted merger mass-ratio. The merger history since z=2 is clearly dominated by minor mergers with mass-ratios smaller than 1:10. Those mergers, however, do on average not add most of the mass to the systems. There is a slight trend for more massive galaxies to experience a larger relative number of minor mergers. Over the full mass range the average number-weighted merger mass ratio is , indicating that the typical merger was indeed very minor (1:16).
6. Conclusion & Discussion
In this paper we use a sample of 40 cosmological re-simulations of individual massive galaxies to investigate the evolution of galaxy sizes and velocity dispersions with redshift. The simulated galaxies form in a two phase process (Oser et al., 2010) where the first phase at redshifts of is dominated by a dissipative assembly. This formation phase is driven by in situ star formation resulting in compact galaxies having small sizes of r 1.3 kpc. The subsequent evolution of the galaxies at redshifts of is dominated by accretion of stars in satellite stellar systems. Naab & Ostriker (2009) and Oser et al. (2010) have shown that the accreted stellar systems preferentially settle into the outer parts of the galaxies, resulting in a gradual increase in their sizes until the simulated galaxies closely follow the present-day mass-size relation. Between redshift 2 and 0 our simulated galaxies grow on average by a factor of , whereas recent semi-analytical models find a smaller size increase of (Khochfar & Silk, 2006a; Guo et al., 2011; Covington et al., 2011). At the present day 25 out of the 40 simulated galaxies are quiescent () and have structural parameters in agreement with observed local early-type galaxies. The underlying physical reason for the size growth for our simulated galaxies is stellar accretion, as can be seen in the strong positive correlation between the projected stellar half-mass radii and the fraction of accreted stellar material (Fig 2). Our detailed analysis presented in this paper confirms that the stellar material is predominantly accreted through minor mergers (Naab et al., 2009), with typical galaxy mass-ratios of . By number the merger history is dominated by even more minor mergers with mass-ratios of . A significant fraction (18 per cent) of the galaxies experience no major merger with mass-ratios larger than 1:4 since z=2 confirming previous suggestions, motivated by the lack of compact galaxies in the nearby Universe, that a highly stochastical process such as major mergers cannot be the main driver for the observed size evolution (Bezanson et al., 2009; Trujillo et al., 2009; Taylor et al., 2010). Semi-analytical models also find significant stellar mass growth due to minor mergers. These models, however, predict that for the most massive galaxies major mergers are becoming increasingly important (e.g. Baugh et al., 1996; De Lucia et al., 2006; De Lucia & Blaizot, 2007; Guo & White, 2008). This is a result of the sharp drop-off in the galaxy mass function due to AGN feedback, which is not followed in our simulations.
For galaxies with masses above our simulated size evolution is in very good agreement (Fig 1) with the observed size evolution of galaxies with similar masses at redshifts of (e.g. Franx et al., 2008). The evolution of the sizes can be well described by with for all galaxies and for quiescent galaxies only. The size growth measured from the simulations is in good agreement with simple estimates from the virial theorem assuming energy conservation during dissipationless merger events (Naab et al., 2009).
The projected velocity dispersions for simulated galaxies with masses around decrease systematically towards lower redshifts from at z=2 to at , again in good agreement with observations (e.g. Cenarro & Trujillo, 2009). Assuming an evolution as we find for all galaxies and for quiescent galaxies. Future observations might confirm this prediction.
We conclude that in the absence of dissipation and associated star formation a growth scenario dominated by minor stellar mergers, with less bound stars, is a viable physical process for explaining both the observed growth in size and the decrease in velocity dispersion of massive early-type galaxies from to the present-day. Accretion of systems not gravitationally bound to the central galaxy causes, as noted, substantial size growth. But it has another, dramatic, concomitant effect. As this mass becomes gravitationally bound, it releases a large amount of gravitational energy. This process, which has been measured in our simulations (Khochfar & Ostriker, 2008; Johansson et al., 2009b) , and termed ’gravitational heating’ can add (i.e. ) to the parent systems, causing heating of the ambient gas and reducing the central dark matter component.
Despite these successes some obvious caveats concerning our simulations remain. Most importantly our simulated galaxies are overly efficient in transforming gas into stars (Hirschmann et al., 2011) and consequently the conversion efficiency of baryons into stars, even at z=2, in the massive galaxies in our simulated sample is overestimated by roughly a factor of 2 compared to predictions from halo occupation models (Behroozi et al., 2010, and references therein). This discrepancy is most probably due to the fact that our simulations neither include strong supernova-driven winds nor AGN feedback from supermassive black holes and would be enhanced if metal-line cooling was included. Observations and modeling have shown that strong galactic winds generating significant outflows are ubiquitous at high redshifts of (e.g. Steidel et al., 2010; Genel et al., 2010) and in our simulations this aspect is missing by construction. The effect of supernova driven winds and AGN feedback is differential with respect to the masses of galaxies, with the former primarily affecting smaller galaxies (Oppenheimer et al., 2010) and the latter being increasingly important for more massive galaxies (Kormendy et al., 2009). The proper inclusion of all the above mentioned physical effects would certainly lower the overall total stellar masses (both the in-situ and the accreted component). Still, the relatively simple two-phase formation scenario provides a viable model to physically explain the observed growth in size and decrease in velocity dispersion. However, this is an issue clearly deserving further studies on the effect of AGN feedback (e.g Sazonov et al., 2004; Di Matteo et al., 2005; Springel et al., 2005; Johansson et al., 2009a; Booth & Schaye, 2009; Debuhr et al., 2010; Ostriker et al., 2010; Schaye et al., 2010), radiative feedback from stars (e.g Oppenheimer & Davé, 2006; Petkova & Springel, 2009; Hopkins et al., 2011) and feedback from supernovae type II (e.g Scannapieco et al., 2008; Schaye et al., 2010; Sales et al., 2010) and Ia (e.g Ciotti & Ostriker, 2007; Oppenheimer & Davé, 2008). Preferentially this will be investigated with the help of a large sample of zoom simulations with better statistics, as presented here, with the aim of studying how these processes would affect in detail the resulting size growth and velocity dispersion evolution of massive galaxies.
References
- Arnold et al. (2011) Arnold, J. A., Romanowsky, A. J., Brodie, J. P., Chomiuk, L., Spitler, L. R., Strader, J., Benson, A. J., & Forbes, D. A. 2011, ApJ, 736, L26+
- Baugh et al. (1996) Baugh, C. M., Cole, S., & Frenk, C. S. 1996, MNRAS, 283, 1361
- Behroozi et al. (2010) Behroozi, P. S., Conroy, C., & Wechsler, R. H. 2010, ApJ, 717, 379
- Bell et al. (2006) Bell, E. F., Naab, T., McIntosh, D. H., Somerville, R. S., Caldwell, J. A. R., Barden, M., Wolf, C., Rix, H.-W., Beckwith, S. V., Borch, A., Häussler, B., Heymans, C., Jahnke, K., Jogee, S., Koposov, S., Meisenheimer, K., Peng, C. Y., Sanchez, S. F., & Wisotzki, L. 2006, ApJ, 640, 241
- Benson (2005) Benson, A. J. 2005, MNRAS, 358, 551
- Bezanson et al. (2009) Bezanson, R., van Dokkum, P. G., Tal, T., Marchesini, D., Kriek, M., Franx, M., & Coppi, P. 2009, ApJ, 697, 1290
- Bluck et al. (2009) Bluck, A. F. L., Conselice, C. J., Bouwens, R. J., Daddi, E., Dickinson, M., Papovich, C., & Yan, H. 2009, MNRAS, 394, L51
- Booth & Schaye (2009) Booth, C. M. & Schaye, J. 2009, MNRAS, 398, 53
- Bournaud et al. (2011) Bournaud, F., Chapon, D., Teyssier, R., Powell, L. C., Elmegreen, B. G., Elmegreen, D. M., Duc, P.-A., Contini, T., Epinat, B., & Shapiro, K. L. 2011, ApJ, 730, 4
- Buitrago et al. (2008) Buitrago, F., Trujillo, I., Conselice, C. J., Bouwens, R. J., Dickinson, M., & Yan, H. 2008, ApJ, 687, L61
- Cappellari et al. (2009) Cappellari, M., di Serego Alighieri, S., Cimatti, A., Daddi, E., Renzini, A., Kurk, J. D., Cassata, P., Dickinson, M., Franceschini, A., Mignoli, M., Pozzetti, L., Rodighiero, G., Rosati, P., & Zamorani, G. 2009, ApJ, 704, L34
- Carrasco et al. (2010) Carrasco, E. R., Conselice, C. J., & Trujillo, I. 2010, MNRAS, 405, 2253
- Cassata et al. (2011) Cassata, P., Giavalisco, M., Guo, Y., Renzini, A., Ferguson, H., Koekemoer, A. M., Salimbeni, S., Scarlata, C., Grogin, N. A., Conselice, C. J., Dahlen, T., Lotz, J. M., Dickinson, M., & Lin, L. 2011, ArXiv e-prints, 1106.4308
- Cenarro & Trujillo (2009) Cenarro, A. J. & Trujillo, I. 2009, ApJ, 696, L43
- Cimatti et al. (2008) Cimatti, A., Cassata, P., Pozzetti, L., Kurk, J., Mignoli, M., Renzini, A., Daddi, E., Bolzonella, M., Brusa, M., Rodighiero, G., Dickinson, M., Franceschini, A., Zamorani, G., Berta, S., Rosati, P., & Halliday, C. 2008, A&A, 482, 21
- Ciotti & Ostriker (2007) Ciotti, L. & Ostriker, J. P. 2007, ApJ, 665, 1038
- Coccato et al. (2011) Coccato, L., Gerhard, O., Arnaboldi, M., & Ventimiglia, G. 2011, ArXiv e-prints, 1108.3834
- Cole et al. (2000) Cole, S., Lacey, C. G., Baugh, C. M., & Frenk, C. S. 2000, MNRAS, 319, 168
- Covington et al. (2011) Covington, M. D., Primack, J. R., Porter, L. A., Croton, D. J., Somerville, R. S., & Dekel, A. 2011, ArXiv e-prints
- Daddi et al. (2005) Daddi, E., Renzini, A., Pirzkal, N., Cimatti, A., Malhotra, S., Stiavelli, M., Xu, C., Pasquali, A., Rhoads, J. E., Brusa, M., di Serego Alighieri, S., Ferguson, H. C., Koekemoer, A. M., Moustakas, L. A., Panagia, N., & Windhorst, R. A. 2005, ApJ, 626, 680
- Damjanov et al. (2011) Damjanov, I., Abraham, R. G., Glazebrook, K., McCarthy, P. J., Caris, E., Carlberg, R. G., Chen, H.-W., Crampton, D., Green, A. W., Jørgensen, I., Juneau, S., Le Borgne, D., Marzke, R. O., Mentuch, E., Murowinski, R., Roth, K., Savaglio, S., & Yan, H. 2011, ArXiv e-prints, 1108.0656
- Damjanov et al. (2009) Damjanov, I., McCarthy, P. J., Abraham, R. G., Glazebrook, K., Yan, H., Mentuch, E., Le Borgne, D., Savaglio, S., Crampton, D., Murowinski, R., Juneau, S., Carlberg, R. G., Jørgensen, I., Roth, K., Chen, H., & Marzke, R. O. 2009, ApJ, 695, 101
- De Lucia & Blaizot (2007) De Lucia, G. & Blaizot, J. 2007, MNRAS, 375, 2
- De Lucia et al. (2006) De Lucia, G., Springel, V., White, S. D. M., Croton, D., & Kauffmann, G. 2006, MNRAS, 366, 499
- Debuhr et al. (2010) Debuhr, J., Quataert, E., Ma, C., & Hopkins, P. 2010, MNRAS, 406, L55
- Dekel et al. (2009) Dekel, A., Birnboim, Y., Engel, G., Freundlich, J., Goerdt, T., Mumcuoglu, M., Neistein, E., Pichon, C., Teyssier, R., & Zinger, E. 2009, Nature, 457, 451
- Di Matteo et al. (2005) Di Matteo, T., Springel, V., & Hernquist, L. 2005, Nature, 433, 604
- di Serego Alighieri et al. (2005) di Serego Alighieri, S., Vernet, J., Cimatti, A., Lanzoni, B., Cassata, P., Ciotti, L., Daddi, E., Mignoli, M., Pignatelli, E., Pozzetti, L., Renzini, A., Rettura, A., & Zamorani, G. 2005, A&A, 442, 125
- Faber et al. (2007) Faber, S. M., Willmer, C. N. A., Wolf, C., Koo, D. C., Weiner, B. J., Newman, J. A., Im, M., Coil, A. L., Conroy, C., Cooper, M. C., Davis, M., Finkbeiner, D. P., Gerke, B. F., Gebhardt, K., Groth, E. J., Guhathakurta, P., Harker, J., Kaiser, N., Kassin, S., Kleinheinrich, M., Konidaris, N. P., Kron, R. G., Lin, L., Luppino, G., Madgwick, D. S., Meisenheimer, K., Noeske, K. G., Phillips, A. C., Sarajedini, V. L., Schiavon, R. P., Simard, L., Szalay, A. S., Vogt, N. P., & Yan, R. 2007, ApJ, 665, 265
- Fan et al. (2010) Fan, L., Lapi, A., Bressan, A., Bernardi, M., De Zotti, G., & Danese, L. 2010, ApJ, 718, 1460
- Fan et al. (2008) Fan, L., Lapi, A., De Zotti, G., & Danese, L. 2008, ApJ, 689, L101
- Feldmann et al. (2010) Feldmann, R., Carollo, C. M., Mayer, L., Renzini, A., Lake, G., Quinn, T., Stinson, G. S., & Yepes, G. 2010, ApJ, 709, 218
- Forbes et al. (2011) Forbes, D. A., Spitler, L. R., Strader, J., Romanowsky, A. J., Brodie, J. P., & Foster, C. 2011, MNRAS, 413, 2943
- Franx et al. (2008) Franx, M., van Dokkum, P. G., Schreiber, N. M. F., Wuyts, S., Labbé, I., & Toft, S. 2008, ApJ, 688, 770
- Genel et al. (2010) Genel, S., Naab, T., Genzel, R., Förster Schreiber, N. M., Sternberg, A., Oser, L., Johansson, P. H., Davé, R., Oppenheimer, B. D., & Burkert, A. 2010, ArXiv e-prints
- Guo et al. (2011) Guo, Q., White, S., Boylan-Kolchin, M., De Lucia, G., Kauffmann, G., Lemson, G., Li, C., Springel, V., & Weinmann, S. 2011, MNRAS, 413, 101
- Guo et al. (2010) Guo, Q., White, S., Li, C., & Boylan-Kolchin, M. 2010, MNRAS, 404, 1111
- Guo & White (2008) Guo, Q. & White, S. D. M. 2008, MNRAS, 384, 2
- Guo et al. (2009) Guo, Y., McIntosh, D. H., Mo, H. J., Katz, N., van den Bosch, F. C., Weinberg, M., Weinmann, S. M., Pasquali, A., & Yang, X. 2009, MNRAS, 398, 1129
- Haardt & Madau (1996) Haardt, F. & Madau, P. 1996, ApJ, 461, 20
- Hirschmann et al. (2011) Hirschmann, M., Naab, T., Somerville, R., Burkert, A., & Oser, L. 2011, ArXiv e-prints, 1104.1626
- Hopkins et al. (2010a) Hopkins, P. F., Bundy, K., Croton, D., Hernquist, L., Keres, D., Khochfar, S., Stewart, K., Wetzel, A., & Younger, J. D. 2010a, ApJ, 715, 202
- Hopkins et al. (2010b) Hopkins, P. F., Bundy, K., Hernquist, L., Wuyts, S., & Cox, T. J. 2010b, MNRAS, 401, 1099
- Hopkins et al. (2009a) Hopkins, P. F., Bundy, K., Murray, N., Quataert, E., Lauer, T. R., & Ma, C.-P. 2009a, MNRAS, 398, 898
- Hopkins et al. (2009b) Hopkins, P. F., Hernquist, L., Cox, T. J., Keres, D., & Wuyts, S. 2009b, ApJ, 691, 1424
- Hopkins et al. (2011) Hopkins, P. F., Quataert, E., & Murray, N. 2011, ArXiv e-prints
- Hyde & Bernardi (2009) Hyde, J. B. & Bernardi, M. 2009, MNRAS, 394, 1978
- Jogee et al. (2009) Jogee, S., Miller, S. H., Penner, K., Skelton, R. E., Conselice, C. J., Somerville, R. S., Bell, E. F., Zheng, X. Z., Rix, H.-W., Robaina, A. R., Barazza, F. D., Barden, M., Borch, A., Beckwith, S. V. W., Caldwell, J. A. R., Peng, C. Y., Heymans, C., McIntosh, D. H., Häußler, B., Jahnke, K., Meisenheimer, K., Sanchez, S. F., Wisotzki, L., Wolf, C., & Papovich, C. 2009, ApJ, 697, 1971
- Johansson et al. (2009a) Johansson, P. H., Naab, T., & Burkert, A. 2009a, ApJ, 690, 802
- Johansson et al. (2009b) Johansson, P. H., Naab, T., & Ostriker, J. P. 2009b, ApJ, 697, L38
- Joung et al. (2009) Joung, M. R., Cen, R., & Bryan, G. L. 2009, ApJ, 692, L1
- Kauffmann (1996) Kauffmann, G. 1996, MNRAS, 281, 487
- Kaviraj et al. (2011) Kaviraj, S., Tan, K.-M., Ellis, R. S., & Silk, J. 2011, MNRAS, 411, 2148
- Kereš et al. (2005) Kereš, D., Katz, N., Weinberg, D. H., & Davé, R. 2005, MNRAS, 363, 2
- Khochfar & Burkert (2006) Khochfar, S. & Burkert, A. 2006, A&A, 445, 403
- Khochfar & Ostriker (2008) Khochfar, S. & Ostriker, J. P. 2008, ApJ, 680, 54
- Khochfar & Silk (2006a) Khochfar, S. & Silk, J. 2006a, ApJ, 648, L21
- Khochfar & Silk (2006b) —. 2006b, MNRAS, 370, 902
- Khochfar & Silk (2009) —. 2009, MNRAS, 397, 506
- Kormendy et al. (2009) Kormendy, J., Fisher, D. B., Cornell, M. E., & Bender, R. 2009, ApJS, 182, 216
- Kriek et al. (2008) Kriek, M., van der Wel, A., van Dokkum, P. G., Franx, M., & Illingworth, G. D. 2008, ApJ, 682, 896
- Kriek et al. (2006) Kriek, M., van Dokkum, P. G., Franx, M., Quadri, R., Gawiser, E., Herrera, D., Illingworth, G. D., Labbé, I., Lira, P., Marchesini, D., Rix, H.-W., Rudnick, G., Taylor, E. N., Toft, S., Urry, C. M., & Wuyts, S. 2006, ApJ, 649, L71
- Longhetti et al. (2007) Longhetti, M., Saracco, P., Severgnini, P., Della Ceca, R., Mannucci, F., Bender, R., Drory, N., Feulner, G., & Hopp, U. 2007, MNRAS, 374, 614
- Lotz et al. (2011) Lotz, J. M., Jonsson, P., Cox, T. J., Croton, D., Primack, J. R., Somerville, R. S., & Stewart, K. 2011, ArXiv e-prints, 1108.2508
- Martinez-Manso et al. (2011) Martinez-Manso, J., Guzman, R., Barro, G., Cenarro, J., Perez-Gonzalez, P., Sanchez-Blazquez, P., Trujillo, I., Balcells, M., Cardiel, N., Gallego, J., Hempel, A., & Prieto, M. 2011, ApJ, 738, L22+
- Mosleh et al. (2011) Mosleh, M., Williams, R. J., Franx, M., & Kriek, M. 2011, ApJ, 727, 5
- Moster et al. (2010) Moster, B. P., Somerville, R. S., Maulbetsch, C., van den Bosch, F. C., Macciò, A. V., Naab, T., & Oser, L. 2010, ApJ, 710, 903
- Naab et al. (2009) Naab, T., Johansson, P. H., & Ostriker, J. P. 2009, ApJ, 699, L178
- Naab et al. (2007) Naab, T., Johansson, P. H., Ostriker, J. P., & Efstathiou, G. 2007, ApJ, 658, 710
- Naab et al. (2006) Naab, T., Khochfar, S., & Burkert, A. 2006, ApJ, 636, L81
- Naab & Ostriker (2009) Naab, T. & Ostriker, J. P. 2009, ApJ, 690, 1452
- Newman et al. (2010) Newman, A. B., Ellis, R. S., Treu, T., & Bundy, K. 2010, ApJ, 717, L103
- Nipoti et al. (2003) Nipoti, C., Londrillo, P., & Ciotti, L. 2003, MNRAS, 342, 501
- Nipoti et al. (2009) Nipoti, C., Treu, T., Auger, M. W., & Bolton, A. S. 2009, ApJ, 706, L86
- Oppenheimer & Davé (2006) Oppenheimer, B. D. & Davé, R. 2006, MNRAS, 373, 1265
- Oppenheimer & Davé (2008) —. 2008, MNRAS, 387, 577
- Oppenheimer et al. (2010) Oppenheimer, B. D., Davé, R., Kereš, D., Fardal, M., Katz, N., Kollmeier, J. A., & Weinberg, D. H. 2010, MNRAS, 406, 2325
- Oser et al. (2010) Oser, L., Ostriker, J. P., Naab, T., Johansson, P. H., & Burkert, A. 2010, ApJ, 725, 2312
- Ostriker et al. (2010) Ostriker, J. P., Choi, E., Ciotti, L., Novak, G. S., & Proga, D. 2010, ApJ, 722, 642
- Petkova & Springel (2009) Petkova, M. & Springel, V. 2009, MNRAS, 396, 1383
- Power et al. (2003) Power, C., Navarro, J. F., Jenkins, A., Frenk, C. S., White, S. D. M., Springel, V., Stadel, J., & Quinn, T. 2003, MNRAS, 338, 14
- Ricciardelli et al. (2010) Ricciardelli, E., Trujillo, I., Buitrago, F., & Conselice, C. J. 2010, MNRAS, 406, 230
- Ryan et al. (2010) Ryan, Jr., R. E., McCarthy, P. J., Cohen, S. H., Yan, H., Hathi, N. P., Koekemoer, A. M., Rutkowski, M. J., Mechtley, M. R., Windhorst, R. A., O’Connell, R. W., Balick, B., Bond, H. E., Bushouse, H., Calzetti, D., Crockett, R. M., Disney, M., Dopita, M. A., Frogel, J. A., Hall, D. N. B., Holtzman, J. A., Kaviraj, S., Kimble, R. A., MacKenty, J., Mutchler, M., Paresce, F., Saha, A., Silk, J. I., Trauger, J., Walker, A. R., Whitmore, B. C., & Young, E. 2010, ArXiv e-prints
- Saglia et al. (2010) Saglia, R. P., Sánchez-Blázquez, P., Bender, R., Simard, L., Desai, V., Aragón-Salamanca, A., Milvang-Jensen, B., Halliday, C., Jablonka, P., Noll, S., Poggianti, B., Clowe, D. I., De Lucia, G., Pelló, R., Rudnick, G., Valentinuzzi, T., White, S. D. M., & Zaritsky, D. 2010, A&A, 524, A6+
- Sales et al. (2010) Sales, L. V., Navarro, J. F., Schaye, J., Vecchia, C. D., Springel, V., & Booth, C. M. 2010, MNRAS, 409, 1541
- Saracco et al. (2009) Saracco, P., Longhetti, M., & Andreon, S. 2009, MNRAS, 392, 718
- Sazonov et al. (2004) Sazonov, S. Y., Ostriker, J. P., & Sunyaev, R. A. 2004, MNRAS, 347, 144
- Scannapieco et al. (2008) Scannapieco, C., Tissera, P. B., White, S. D. M., & Springel, V. 2008, MNRAS, 389, 1137
- Schaye et al. (2010) Schaye, J., Dalla Vecchia, C., Booth, C. M., Wiersma, R. P. C., Theuns, T., Haas, M. R., Bertone, S., Duffy, A. R., McCarthy, I. G., & van de Voort, F. 2010, MNRAS, 402, 1536
- Shankar et al. (2010a) Shankar, F., Marulli, F., Bernardi, M., Boylan-Kolchin, M., Dai, X., & Khochfar, S. 2010a, MNRAS, 405, 948
- Shankar et al. (2010b) Shankar, F., Marulli, F., Bernardi, M., Dai, X., Hyde, J. B., & Sheth, R. K. 2010b, MNRAS, 403, 117
- Shankar et al. (2011) Shankar, F., Marulli, F., Bernardi, M., Mei, S., Meert, A., & Vikram, V. 2011, ArXiv e-prints, 1105.6043
- Spergel et al. (2007) Spergel, D. N., Bean, R., Doré, O., Nolta, M. R., Bennett, C. L., Dunkley, J., Hinshaw, G., Jarosik, N., Komatsu, E., Page, L., Peiris, H. V., Verde, L., Halpern, M., Hill, R. S., Kogut, A., Limon, M., Meyer, S. S., Odegard, N., Tucker, G. S., Weiland, J. L., Wollack, E., & Wright, E. L. 2007, ApJS, 170, 377
- Springel (2005) Springel, V. 2005, MNRAS, 364, 1105
- Springel et al. (2005) Springel, V., Di Matteo, T., & Hernquist, L. 2005, ApJ, 620, L79
- Springel & Hernquist (2003) Springel, V. & Hernquist, L. 2003, MNRAS, 339, 289
- Steidel et al. (2010) Steidel, C. C., Erb, D. K., Shapley, A. E., Pettini, M., Reddy, N., Bogosavljević, M., Rudie, G. C., & Rakic, O. 2010, ApJ, 717, 289
- Szomoru et al. (2010) Szomoru, D., Franx, M., van Dokkum, P. G., Trenti, M., Illingworth, G. D., Labbé, I., Bouwens, R. J., Oesch, P. A., & Carollo, C. M. 2010, ApJ, 714, L244
- Taylor et al. (2010) Taylor, E. N., Franx, M., Glazebrook, K., Brinchmann, J., van der Wel, A., & van Dokkum, P. G. 2010, ApJ, 720, 723
- Toft et al. (2007) Toft, S., van Dokkum, P., Franx, M., Labbe, I., Förster Schreiber, N. M., Wuyts, S., Webb, T., Rudnick, G., Zirm, A., Kriek, M., van der Werf, P., Blakeslee, J. P., Illingworth, G., Rix, H.-W., Papovich, C., & Moorwood, A. 2007, ApJ, 671, 285
- Trujillo et al. (2009) Trujillo, I., Cenarro, A. J., de Lorenzo-Cáceres, A., Vazdekis, A., de la Rosa, I. G., & Cava, A. 2009, ApJ, 692, L118
- Trujillo et al. (2007) Trujillo, I., Conselice, C. J., Bundy, K., Cooper, M. C., Eisenhardt, P., & Ellis, R. S. 2007, MNRAS, 382, 109
- Trujillo et al. (2011) Trujillo, I., Ferreras, I., & de La Rosa, I. G. 2011, MNRAS, 415, 3903
- Trujillo et al. (2006) Trujillo, I., Förster Schreiber, N. M., Rudnick, G., Barden, M., Franx, M., Rix, H.-W., Caldwell, J. A. R., McIntosh, D. H., Toft, S., Häussler, B., Zirm, A., van Dokkum, P. G., & Labbé, I. 2006, ApJ, 650, 18
- van de Sande et al. (2011) van de Sande, J., Kriek, M., Franx, M., van Dokkum, P. G., Bezanson, R., Whitaker, K. E., Brammer, G., Labbé, I., Groot, P. J., & Kaper, L. 2011, ApJ, 736, L9+
- van der Wel et al. (2009) van der Wel, A., Bell, E. F., van den Bosch, F. C., Gallazzi, A., & Rix, H. 2009, ApJ, 698, 1232
- van der Wel et al. (2005) van der Wel, A., Franx, M., van Dokkum, P. G., Rix, H.-W., Illingworth, G. D., & Rosati, P. 2005, ApJ, 631, 145
- van der Wel et al. (2008) van der Wel, A., Holden, B. P., Zirm, A. W., Franx, M., Rettura, A., Illingworth, G. D., & Ford, H. C. 2008, ApJ, 688, 48
- van der Wel et al. (2011) van der Wel, A., Rix, H.-W., Wuyts, S., McGrath, E. J., Koekemoer, A. M., Bell, E. F., Holden, B. P., Robaina, A. R., & McIntosh, D. H. 2011, ApJ, 730, 38
- van Dokkum & Brammer (2010) van Dokkum, P. G. & Brammer, G. 2010, ApJ, 718, L73
- van Dokkum et al. (2008) van Dokkum, P. G., Franx, M., Kriek, M., Holden, B., Illingworth, G. D., Magee, D., Bouwens, R., Marchesini, D., Quadri, R., Rudnick, G., Taylor, E. N., & Toft, S. 2008, ApJ, 677, L5
- van Dokkum et al. (2009) van Dokkum, P. G., Kriek, M., & Franx, M. 2009, Nature, 460, 717
- van Dokkum et al. (2006) van Dokkum, P. G., Quadri, R., Marchesini, D., Rudnick, G., Franx, M., Gawiser, E., Herrera, D., Wuyts, S., Lira, P., Labbé, I., Maza, J., Illingworth, G. D., Förster Schreiber, N. M., Kriek, M., Rix, H., Taylor, E. N., Toft, S., Webb, T., & Yi, S. K. 2006, ApJ, 638, L59
- van Dokkum et al. (2010) van Dokkum, P. G., Whitaker, K. E., Brammer, G., Franx, M., Kriek, M., Labbé, I., Marchesini, D., Quadri, R., Bezanson, R., Illingworth, G. D., Muzzin, A., Rudnick, G., Tal, T., & Wake, D. 2010, ApJ, 709, 1018
- Weinzirl et al. (2011) Weinzirl, T., Jogee, S., Conselice, C. J., Papovich, C., Chary, R. R., Bluck, A. F. L., Gruetzbauch, R., Buitgrago, F., Mobasher, B., Lucas, R. A., Dickinson, M., & Bauer, A. E. 2011, ArXiv e-prints, 1107.2591
- Williams et al. (2009) Williams, R. J., Quadri, R. F., Franx, M., van Dokkum, P., & Labbé, I. 2009, ApJ, 691, 1879
- Williams et al. (2010) Williams, R. J., Quadri, R. F., Franx, M., van Dokkum, P., Toft, S., Kriek, M., & Labbé, I. 2010, ApJ, 713, 738
- Wuyts et al. (2010) Wuyts, S., Cox, T. J., Hayward, C. C., Franx, M., Hernquist, L., Hopkins, P. F., Jonsson, P., & van Dokkum, P. G. 2010, ApJ, 722, 1666
- Zirm et al. (2007) Zirm, A. W., van der Wel, A., Franx, M., Labbé, I., Trujillo, I., van Dokkum, P., Toft, S., Daddi, E., Rudnick, G., Rix, H., Röttgering, H. J. A., & van der Werf, P. 2007, ApJ, 656, 66