EVLA observations of the Barnard 5 star-forming core: embedded filaments revealed
Abstract
We present a 6.5′8 Expanded Very Large Array (EVLA) mosaic observations of the (1,1) emission in the Barnard 5 region in Perseus, with an angular resolution of 6. This map covers the coherent region, where the dense gas presents subsonic non-thermal motions (as seen from single dish observations with the Green Bank Telescope, GBT). The combined EVLA and GBT observations reveal, for the first time, a striking filamentary structure (20 wide or 5,000 AU at the distance of Perseus) in this low-mass star forming region. The integrated intensity profile of this structure is consistent with models of an isothermal filament in hydrostatic equilibrium. The observed separation between the B5–IRS1 young stellar object (YSO), in the central region of the core, and the northern starless condensation matches the Jeans length of the dense gas. This suggests that the dense gas in the coherent region is fragmenting. The region observed displays a narrow velocity dispersion, where most of the gas shows evidence for subsonic turbulence, and where little spatial variations are present. It is only close to the YSO where an increase in the velocity dispersion is found, but still displaying subsonic non-thermal motions.
Subject headings:
ISM: clouds — stars: formation — ISM: molecules — ISM: individual (Perseus Molecular Complex, B5)1. Introduction
Molecular clouds (MCs) observed using low-density tracers display velocity dispersions much larger than the thermal value (e.g., Zuckerman & Evans, 1974; Larson, 1981; Myers, 1983). These supersonic motions are usually attributed to “turbulence,” and a variety of recent numerical models of turbulence can reproduce qualitatively realistic clouds. Measurements of MCs’ energy budgets show that turbulence must be dissipated in order for dense cores (where individual or small groups of stars form) to collapse and form stars.
Dense cores have been studied using (1,1) maps, which traces material with densities of a few . It has been found that dense cores show an almost constant level of non–thermal motions, within a certain “coherence” radius (Goodman et al., 1998). The term “coherent core” is used to describe the dense gas where non–thermal motions are roughly constant, and typically smaller than the thermal motions, independent of scale (see also Caselli et al., 2002).
Recent observations carried out with the 100-m Robert F. Byrd Green Bank Telescope (GBT) have allowed us to create large scale maps of (1,1) towards four star-forming regions in the Perseus Molecular Cloud: B5, IC348–SW, L1448, and L1451 (Pineda et al., 2010, 2011). One of the main results of Pineda et al. (2010) is the clear observation (for the first time) of the sharp transition (at resolution) between the coherent section of the B5 dense core and the more turbulent dense gas outside it (see also Pineda et al., 2011, for results on the other regions surveyed). However, the angular resolution of these observations did not allow us to study in great detail the spatial variations of the velocity dispersion or column density.
In this letter, we present new (1,1) observations of B5 obtained with the Expanded Very Large Array (EVLA) through the Open Shared Risk Observing (OSRO) program, see Perley et al. (2011) for a description of the EVLA project. These data are combined with previous observations from the GBT to study the dense gas traced by at high angular and spectral resolution. Here, we present results from the combined EVLA and GBT observations that enable us to analyze the kinematic properties of the dense gas traced by (1,1) and also to study the radial profile of new filamentary structure found within this core.
2. Data
Observations were carried out with the EVLA of the National Radio Astronomy Observatory on May 16th, 2010 (project 10A-181). We used the high-frequency K-band receiver and configured the WIDAR correlator to observe a 1 MHz window around the (1,1) rest frequency (23.6944950787 GHz). The correlator generated 256 channels across the window, giving a 3.90625 kHz channel separation, equivalent to at the observed frequency. This configuration covers the main hyperfine component and also one of the inner pair of satellite lines for (1,1). At this frequency the primary beam of the array is about . The array was in the compact (D) configuration, which covers baselines from 35 meters up to 1 km, and included 26 antennas. The observations covered the entire region of interest using 27 pointings. The observations were carried out under fair weather ( nepers) for 7 hours.
The bandpass and absolute flux calibrator was the quasar 3C 48, while the phase and amplitude calibrator, quasar J0336+3218, was observed every 15 minutes. The -band reference pointing checks were performed every 60 minutes using the quasar J0336+3218.
The raw-data were reduced using CASA image processing software. The signal from each baseline was inspected, and baselines showing spurious data were removed prior to imaging. Each channel was cleaned separately according to the spatial distribution of the emission. The clean map was imaged using a circular beam and corrected by the primary beam. The images were created using multi-scale clean (with scales of 4 and 12 arcsec and smallscalebias=0.2) with a robust parameter of .
Imaging of the EVLA data only produced a resulting data cube where strong negative bowls were found. These negative bowls are generated by the large scale (1,1) emission which arises from angular scales not sampled by the interferometer. We included the (1,1) single dish data obtained with the GBT (Pineda et al., 2010) as a prior (or model) during the imaging process to recover the large scale emission. The final noise achieved is 14 m per channel.
The integrated intensity map (see Figure 1) shows a few regions with negative emission, which would suggest the presence of imaging artifacts. However, careful inspection of the data confirms that the spectra towards those positions do not show any clear negative bowl associated with imaging artifacts, in fact, these regions are about the - level still consistent with the map noise.
3. Results
Left panel of Figure 1 shows the integrated intensity map obtained using the GBT at 30 resolution. Gray contours in Figure 1 show the extent of (1,1) emission. The orange contours show the regions in the GBT data within which the non-thermal velocity dispersion is sub-sonic. The blue contour shows the region observed with the EVLA and presented in the right panel, and it covers the entire central region where the sub-sonic non-thermal velocity dispersions are observed. The resulting (1,1) integrated intensity map for B5 is shown in right panel of Figure 1, and it covers a region of size 6.58.
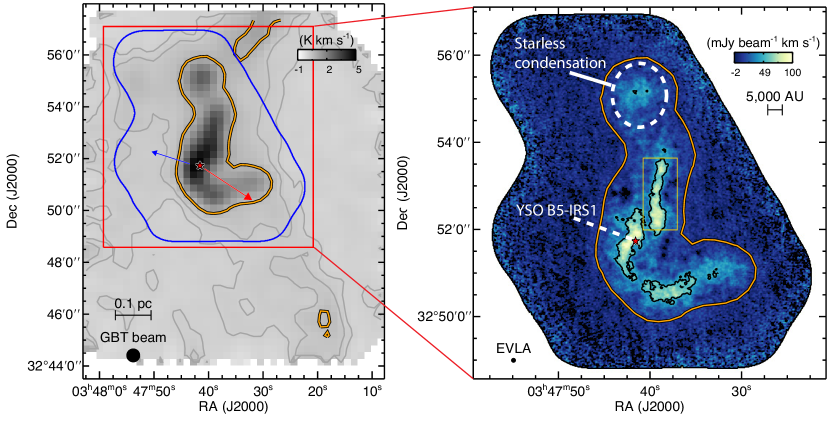
The new high resolution integrated intensity map (right panel of Figure 1) reveals that within the region of subsonic non-thermal motions found in the single dish data (orange contour) filamentary structures appear. These filaments are narrow, with widths of or 5,000 AU at the distance of Perseus (250 pc; Hirota et al., 2008).
An important feature of molecular line observations is the ability to probe the kinematics of the gas. Here we fit simultaneously all hyperfine components of the (1,1) line using a forward model previously presented by Rosolowsky et al. (2008), see also Pineda et al. (2010). This method describes the emission at every position with a centroid velocity (), velocity dispersion (), kinetic temperature (), excitation temperature () and opacity (), while also including the response of the frequency channel using a sinc profile. Since the kinetic temperature is only used to predict the (2,2) line (not observed due to the constraints in the OSRO program), it does not have any effect on the remaining parameters. We use a fixed value of the kinetic temperature of 10 K for the entire region, which is consistent with the results obtained by Pineda et al. (2011) using the single dish data. If the resulting fit does not provide an accurate velocity dispersion, (velocity dispersion narrower than the expected thermal value for gas at 6 K) or (signal-to-noise for the velocity dispersion less than 5), the fit is repeated but with a fixed value of 5 K for excitation temperature. The centroid velocity and velocity dispersion maps are shown in Figure 2.
The centroid velocity map shows little variation ( ) across the entire region, see Figure 2a. The region close to the YSO displays a velocity gradient at a position angle that is close to the outflow (shown by the arrows) but in opposite direction. The velocity dispersion map, see Figure 2b, shows vast regions where small and uniform velocity dispersion are found. It is only towards positions close to the YSO where slightly broader lines are found.
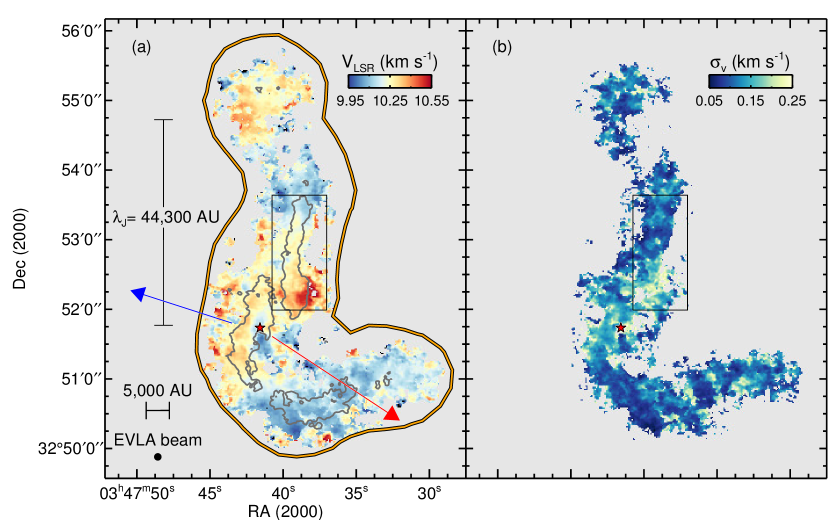
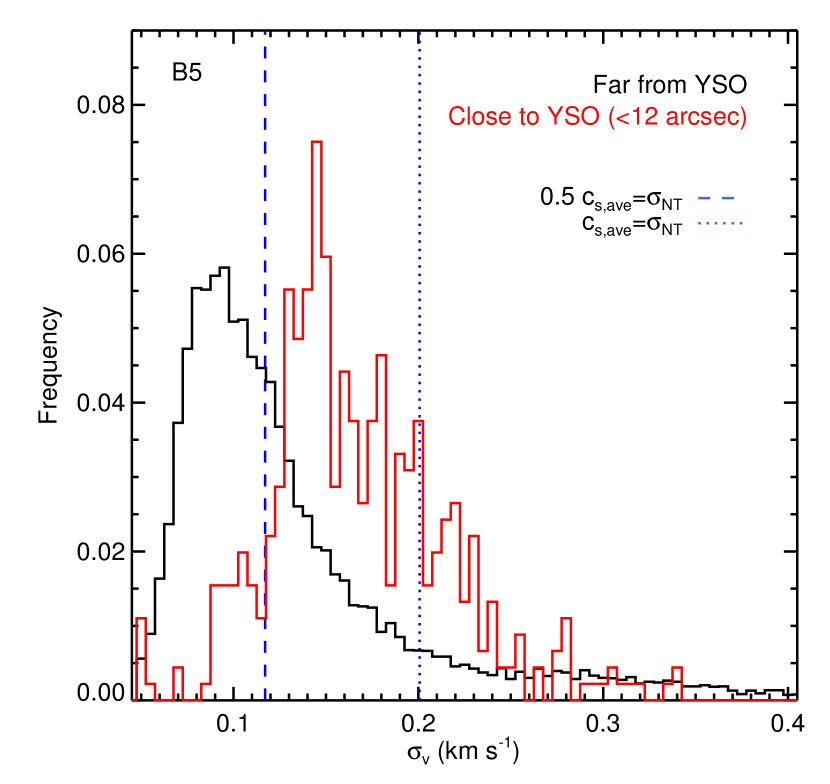
Figure 3 presents the distribution of the derived velocity dispersion towards B5. Two histograms are shown Figure 3 depending on the proximity to the YSO in B5: (a) positions close to the YSO (separated by 2 beams or less, 12) in red, and (b) all other pixels in black. For points far from the YSO the velocity dispersions are small and the velocity dispersion distribution (black histogram in Figure 3) is narrow, almost every pixel at a distance larger than 2 beams (12″) from the central YSO displays sub-sonic non-thermal motions. The velocity dispersion distribution of pixels far from the YSO, black histogram in Figure 3, peaks at a value lower than what is expected if the non-thermal component, , is equal to half the thermal velocity dispersion, . The velocity dispersion of points close to the YSO, red histogram in Figure 3, presents lines broader than the rest of the core, but they still display velocity dispersions with a subsonic non-thermal component. This increase in the velocity dispersion might be the effect of the radiation from the embedded YSO or due to the interaction between the outflow or stellar wind and the dense gas.
Herschel observations of the IC 5146 star forming region (Arzoumanian et al., 2011) revealed filamentary structure seen in the column density maps (see also André et al., 2010). Arzoumanian et al. (2011) fitted the column density profile of filaments with a cylindrical filament model,
| (1) |
where is the filament’s central density, is the cylindrical radius, is the power-law density exponent at large radii, is the radius of the density profile inner flat section, and is a finite constant factor dependent on and the filament inclination angle. They find filaments which are well fit with a density exponent in the range (see also Lada et al., 1999). These exponents do not agree with the predicted values of an isothermal filament in hydrostatic equilibrium where a steeper exponent, , is expected (Ostriker, 1964).
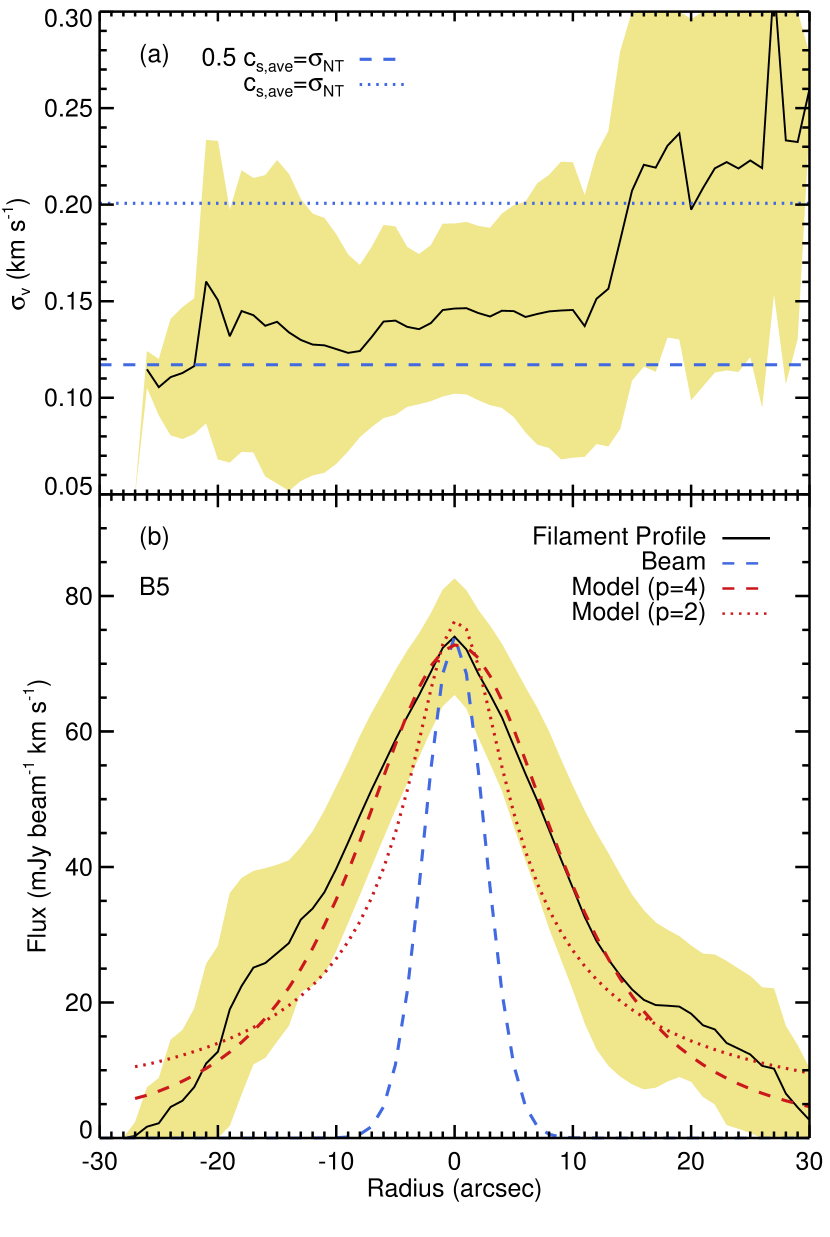
Here we focus our attention towards the filament shown in Figure 1 by the yellow box. Since this filament is almost perfectly aligned in the North-South direction we perform a series of horizontal cuts, and define the radius as the distance from the peak at a given cut. The average velocity dispersion and integrated intensity emission profiles along the filament are shown in panels (a) and (b) of Figure 4, respectively, where the spread in the distribution is shown by the yellow area. Figure 4a shows that the velocity dispersion does not change across the filament, and it is consistent with subsonic non-thermal velocity dispersions (delimited by the dotted line). Figure 4b shows the integrated intensity profile, which is much wider than the beam of the combined EVLA and GBT data (shown by the blue dash line). Since we do not observe the (2,2) with the EVLA we cannot provide a column density profile, but we use (1,1) integrated intensity as a proxy for the total column density (Rosolowsky et al., 2008; Friesen et al., 2009; Foster et al., 2009; Pineda et al., 2011). The integrated intensity profile is fitted with a model which follows equation 1, and the best fit results for and are shown in Figure 4. The figure shows that this filament in B5, in opposition to what is found by Arzoumanian et al. (2011) on larger filaments, is better fit by an isothermal hydrostatic filament model (see also Hacar et al., submitted, or Bourke et al., submitted, for other examples of objects with similar column density profiles).
4. Discussion and conclusion
The observations presented here show that subsonic non-thermal velocity dispersions display little variations across the region of coherence, and even across a filament. Also, the coherent region is far from presenting an uniform column density (as traced by the (1,1) integrated intensity), as filamentary substructures are revealed. But the presence of substructures within the region of coherence should not be surprising, the lack of turbulent support might allow external forces or Jeans-like instabilities to generate over-densities without much difficulties.
Filaments have received special attention recently. They appear as a natural outcome from turbulent simulations of molecular clouds (e.g., Klessen et al., 2004), and also from the fragmentation of a modulated layer (Myers, 2009). Recent Herschel observations have shown that filaments are commonly found in star-forming regions (André et al., 2010; Arzoumanian et al., 2011). However, these filaments present different properties than those presented here : (a) they are bigger structures, with a characteristic width of 0.1 pc; and (b) they are not well fitted by an hydrostatic and isothermal cylindrical model. The filamentary structures revealed by our observations appear to have different properties than filaments previously studied. The filaments in B5 are embedded in a dense region with subsonic turbulence, and the filament shown in Figure 4 is better fitted with the hydrostatic isothermal filament model. The differences between the filaments identified using Herschel and EVLA are due to physical differences between the structures. The Herschel identified filaments are found at low column densities and have a characteristic size of pc, which is similar to the size of the coherent structures found in single dish observations (Pineda et al., 2010; Goodman et al., 1998), but much smaller than the largest scales detected (). While the filaments revealed by the EVLA observations are substructures within the coherent region which are also at higher column densities than the structures found in Herschel. Also, since the filament width (see Figure 4b) is smaller than the EVLA primary beam and the single dish data is used to recover the extended emission then the radial profile is little affected by the spatial filtering of interferometric observations.
Fragmentation in the coherent region should occur at the Jeans length,
| (2) |
where is the temperature of the gas, is the average density, and is the mean molecular weight. For the average values of density and temperature in B5 from the dense gas ( K and , Pineda et al., 2011) the Jeans length correspond to the separation between the B5–IRS1 YSO and the starless condensation in the northern part of the region observed. Fragmentation has been argued to explain the stars separation in young star-forming regions (e.g., Hartmann, 2002; Teixeira et al., 2006, 2007) and the mass function of cores or condensations (e.g., Testi & Sargent, 1998; Motte et al., 1998; André et al., 2007). Here we show evidence for fragmentation occurring within the coherent region, which is not necessarily linked to the filament formation process.
These results support the idea that a coherent region needs to be created to form a low-mass star. It is in this coherent region where the dense gas that has lost its turbulent support accumulates, and then it can easily fragment, create a filament, and/or undergo gravitational collapse to form a star. We expect that future EVLA and ALMA observations of star forming regions will allow us to produce temperature and velocity dispersion maps which will allow us to perform a much better job on characterising the physical properties of filaments and of these coherent regions.
References
- André et al. (2007) André, P., Belloche, A., Motte, F., & Peretto, N. 2007, A&A, 472, 519
- André et al. (2010) André, P., et al. 2010, A&A, 518, L102+
- Arzoumanian et al. (2011) Arzoumanian, D., et al. 2011, A&A, 529, L6+
- Caselli et al. (2002) Caselli, P., Benson, P. J., Myers, P. C., & Tafalla, M. 2002, ApJ, 572, 238
- Foster et al. (2009) Foster, J. B., Rosolowsky, E. W., Kauffmann, J., Pineda, J. E., Borkin, M. A., Caselli, P., Myers, P. C., & Goodman, A. A. 2009, ApJ, 696, 298
- Friesen et al. (2009) Friesen, R. K., Di Francesco, J., Shirley, Y. L., & Myers, P. C. 2009, ApJ, 697, 1457
- Goodman et al. (1998) Goodman, A. A., Barranco, J. A., Wilner, D. J., & Heyer, M. H. 1998, ApJ, 504, 223
- Hartmann (2002) Hartmann, L. 2002, ApJ, 578, 914
- Hirota et al. (2008) Hirota, T., et al. 2008, PASJ, 60, 37
- Klessen et al. (2004) Klessen, R. S., Ballesteros-Paredes, J., Li, Y., & Mac Low, M. 2004, in Astronomical Society of the Pacific Conference Series, Vol. 322, The Formation and Evolution of Massive Young Star Clusters, ed. H. J. G. L. M. Lamers, L. J. Smith, & A. Nota, 299–+
- Lada et al. (1999) Lada, C. J., Alves, J., & Lada, E. A. 1999, ApJ, 512, 250
- Larson (1981) Larson, R. B. 1981, MNRAS, 194, 809
- Motte et al. (1998) Motte, F., Andre, P., & Neri, R. 1998, A&A, 336, 150
- Myers (1983) Myers, P. C. 1983, ApJ, 270, 105
- Myers (2009) —. 2009, ApJ, 700, 1609
- Ostriker (1964) Ostriker, J. 1964, ApJ, 140, 1056
- Perley et al. (2011) Perley, R. A., Chandler, C. J., Butler, B. J., & Wrobel, J. M. 2011, ArXiv e-prints
- Pineda et al. (2010) Pineda, J. E., Goodman, A. A., Arce, H. G., Caselli, P., Foster, J. B., Myers, P. C., & Rosolowsky, E. W. 2010, ApJ, 712, L116
- Pineda et al. (2011) —. 2011, ApJ, In prep.
- Rosolowsky et al. (2008) Rosolowsky, E. W., Pineda, J. E., Foster, J. B., Borkin, M. A., Kauffmann, J., Caselli, P., Myers, P. C., & Goodman, A. A. 2008, ApJS, 175, 509
- Teixeira et al. (2007) Teixeira, P. S., Zapata, L. A., & Lada, C. J. 2007, ApJ, 667, L179
- Teixeira et al. (2006) Teixeira, P. S., et al. 2006, ApJ, 636, L45
- Testi & Sargent (1998) Testi, L., & Sargent, A. I. 1998, ApJ, 508, L91
- Zuckerman & Evans (1974) Zuckerman, B., & Evans, II, N. J. 1974, ApJ, 192, L149