MEASUREMENTS OF INCLUSIVE W/Z PRODUCTION CROSS SECTIONS AT CMS AND W/Z AS A LUMINOMETER
Abstract
Leptonic decays of W/Z bosons provide the first electroweak precision measurements at the Large Hadron Collider (LHC). The results of measurements of inclusive and boson production cross sections in pp collisions at are presented [1], based on of data recorded by the Compact Muon Solenoid (CMS) detector at the LHC. The measurements, performed in the electron and muon decay channels, are combined to give and , where stands for either or . Theoretical predictions, calculated at the next-to-next-to-leading order (NNLO) in QCD using recent parton distribution functions (PDFs), are in agreement with the measured cross sections. Hence copious production of these well understood and clean signatures suggest the use of W/Z as a “standard candle” for measuring the luminosity at the LHC alongside the current Van der Meer (VdM) separation scan method.
1 Introduction
Inclusive leptonic decays of W and Z bosons are benchmark physics processes at hadron colliders. These first electroweak processes studied at the LHC allow validation of high transverse momentum electron and muon reconstruction and identification. In addition, precision measurements of the W/Z are important in testing the Standard Model more rigorously than ever before, constraining the PDF, and potentially uncovering signs of new physics that could appear through radiative corrections.
The results of the W/Z production cross section measurements with pp collisions at a center-of-mass energy of TeV provided by the LHC are reported [1]. The data were collected from April through August, 2010, by the CMS experiment, and correspond to an integrated luminosity of pb-1. The consistency of the results between the different leptonic decay channels and with the NNLO theoretical calculations suggests already considering the use of these electroweak boson decays as “Standard Candles for LHC” to calibrate the absolute luminosity alongside the Van deer Meer separation scan. Comparison of the systematic uncertainties between the two methods is provided.
The precision of the cross section measurements was limited by the systematic uncertainty on the luminosity (11%). In the very near future 111 As of the publication date of this article the luminosity uncertainty has been reduced to 4%. more detailed understanding of several of the main systematic biases will substantially reduce the uncertainty of these measurements. The statistical uncertainty will also be reduced by about a factor of 3 once the measurement is performed on the entire 2010 data set, corresponding to 36 pb-1. Conservative systematic uncertainty projections for the measurements using the full 2010 data set are provided. 222 Since the LHC Lumi Days workshop, this analysis on 36 pb-1 has been completed [2].
2 Cross Section Results for 2.9 pb-1
Results for electron and muon decay channels are reported separately, and then combined assuming lepton universality in W and Z decays. The electron and muon channels are combined by maximizing a likelihood that accounts for the individual statistical and systematic uncertainties and their correlations. For cross section measurements, correlations are only numerically relevant for theoretical uncertainties, including the PDF uncertainties on the acceptance values. For cross section ratio measurements, the correlations of lepton efficiencies are taken into account in each lepton channel, with other experimental uncertainties assumed uncorrelated; in the combination of lepton channels, fully-correlated uncertainty for the acceptance factor are assumed, with other uncertainties assumed uncorrelated.
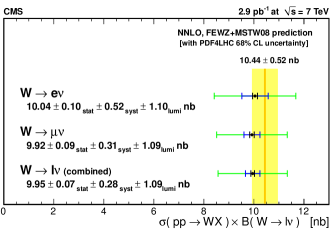
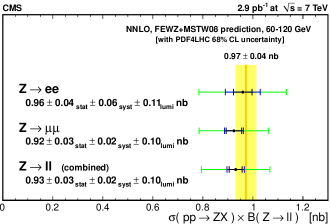
Table 1 summarizes the measured electroweak boson production cross sections, and compares them to their theoretical NNLO predictions [3, 4]. The reported Z boson production cross sections pertain to the invariant mass range GeV, and are corrected for the fiducial and kinematic acceptance but not for exchange. Each cross section result in the table carries an additional uncertainty of 11% from the luminosity that is not listed.
| Channel | (nb) | NNLO (nb) | |
|---|---|---|---|
| W | |||
| W+ | |||
| W- | |||
| Z | |||
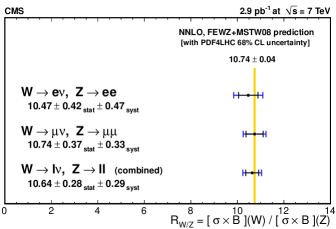
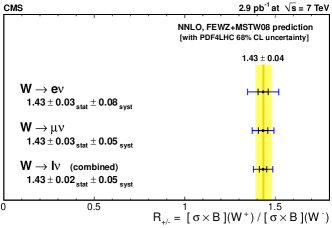
Table 2 lists the measured W/Z and W+/W- cross section ratios, which are denoted and , respectively. The measured cross section and ratio values are all in agreement with the predictions.
| Channel | (nb) | NNLO (nb) | |
|---|---|---|---|
Summaries of the measurements are given in Figures 1, 2, 3, and 4, illustrating the consistency of the measurements in the electron and muon channels, as well as the confirmation of theoretical predictions computed at the NNLO in QCD with state-of-the-art PDF sets. For each reported measurement, the statistical error is represented in black and the total experimental uncertainty, obtained by adding in quadrature the statistical and systematic uncertainties, in dark blue. For the cross section measurements, the luminosity uncertainty is added linearly to the experimental uncertainty, and is represented in green. The dark-yellow vertical line represents the theoretical prediction, and the light-yellow vertical band is the theoretical uncertainty, interpreted as a 68% confidence interval.
3 PROJECTED PRECISIONS FOR A 36 pb-1 ANALYSIS
The overall uncertainty on the W/Z cross section results will be substantially reduced when measurements are made on the full 36 pb-1 dataset, due to larger event yields, more detailed understanding, and improvements in analysis techniques. Table 3 compares the statistical and (non-luminosity) systematic errors reported for the 2.9 pb-1 analysis to conservative predictions for the 36 pb-1 analysis in the electron and muon channels. The reduction suggests using electroweak boson decays as a luminometer will be competitive with VdM scans. This will further be explored in the following section.
| (%) | 2.9 pb-1 | 36 pb-1 | 2.9pb-1 | 36 pb-1 |
|---|---|---|---|---|
| Stat | 0.6 | 0.2 | 3.8 | 1.1 |
| Syst | 5.1 | 4.0 | 6.2 | 4.2 |
| Total | 5.1 | 4.0 | 7.3 | 4.3 |
| 2.9 pb-1 | 36 pb-1 | 2.9pb-1 | 36 pb-1 | |
|---|---|---|---|---|
| Stat | 0.7 | 0.2 | 3.1 | 0.9 |
| Syst | 3.1 | 2.2 | 2.3 | 2.1 |
| Total | 3.4 | 2.2 | 3.9 | 2.3 |
4 COMPARISONS OF W/Z vs. VAN DER MEER SCAN CALIBRATION
Luminosity at CMS is calibrated via Van der Meer scans [5], where horizontal and vertical beam separation scans are performed to measure the beam sizes. The beam sizes along with the other known machine parameters determine the luminosity. The consistency of the results obtained for the cross section measurements in addition to the copious signal yields and precisely known cross sections, suggest the possibility of inverting the cross section measurements to instead use the signal yield to calibrate the luminosity. This can be demonstrated with Z bosons. Table 4 compares the current (with 2.9 pb-1) and projected (36 pb-1) systematic uncertainties of a luminosity calibration using either Z bosons (combined electron and muon channels) or VdM scans.
| VdM Scan | ||||
| 2.9 pb-1 | 36 pb-1 | 2.9pb-1 | 36 pb-1 | |
| (%) | 11 | 4 | 6 | 4-5 |
The dominant systematic uncertainty on the VdM scans is the beam current measurement. On the other hand, the dominant systematic uncertainty on the Z based calibration comes from the PDF [7]. Table 4 shows that calibrating the luminosity using Z bosons is competitive with the separation scans. It indicates a Z decay based luminosity calibration with a precision of 4-5% should be possible on a daily basis if the LHC provides CMS with approximately 30-40 pb-1 of collisions per day. Still, continued improvement of the VdM scans (in particular reducing the uncertainty on the beam current measurement) is advocated since scans can be used to constrain the proton PDF.
5 Z YIELD STABILITY FOR LUMINOSITY CALIBRATION
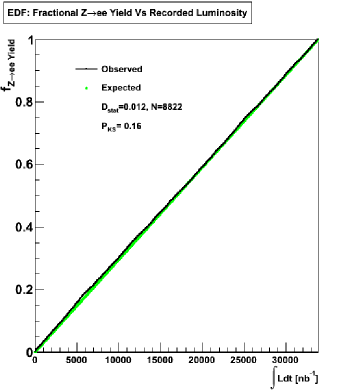
Although VdM scans currently provide the primary method to calibrate the luminosity, W/Z bosons could be used as a cross check in the coming periods of data taking. The signal yield must be continuously validated to use these decays for calibration. Irregularities in the signal yield can be uncovered using a Kolmogrov-Smirnov omnibus test [6]. These tests yield the significance or probability value of an observed or claimed deviation in a given frequency distribution from the expected distribution. In Kolmogrov-Smirnov tests, the empirical distribution function (EDF) of the signal yield is plotted vs. an orthogonal variable. The orthogonal variable could be the separation scan based luminosity or the yield of another signal. The EDF is just the fractional yield of the signal. This frequency distribution is then compared to the expected distribution (e.g. the yield increasing linearly with luminosity). The maximal vertical difference between the observed and expected distributions determines a probability . Such a test is shown in Figure 5 where the EDF of the yield observed at CMS is plotted vs. the scan based luminosity for 36 pb-1. The data is shown in black, while the expected distribution is in green. The maximal difference between the 2 distributions is labeled on the plot as and the corresponding probability value is labelled as . The observed distribution agrees well with the expectation and the high probability value indicates a stable signal yield, consistent with the hypothesis that the yield increases linearly with luminosity.
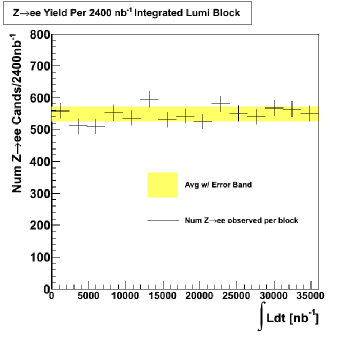
Other useful checks include plotting the signal yield vs. blocks of fixed integrated luminosity. One can then verify that this distribution is flat, having its points agreeing within errors. Such a plot is shown in Figure 6, where the yield observed at CMS is plotted in 2.4 pb-1 luminosity blocks with about 4% relative statistical error per point. The data is shown in black while the corresponding statistical error band is plotted in yellow. The distribution is flat and the yield was stable during data taking.
6 CONCLUSIONS
CMS has performed measurements of inclusive W and Z production cross sections in pp collisions at TeV using pb-1 of data recorded by the CMS detector at the LHC [1]. The W/Z and W+/W- production cross section ratios were also reported. Measurements were performed for both electron and muon decay channels, and were then combined. The measurements are internally consistent and agree well with the theoretical predictions. Conservative systematic uncertainty projections for an upcoming 36 pb-1 measurement [2] were provided 333 Errors reported in [2] are even less: 2.1% for Z production.and the feasibility of using W/Z boson decays alongside the VdM scans to calibrate the luminosity has been examined. Such a calibration is possible for 2011 high luminosity data taking, and usage of W/Z bosons as a standard candle for luminosity could happen as early as this year.
References
- [1] The CMS Collaboration, “Measurements of Inclusive W/Z Cross Section in pp Collisions at √s = 7 TeV”, 10.1007/JHEP01(2011)080, http://www.springerlink.com/content/80884781g5708422/
- [2] The CMS Collaboration, “Measurement of the W and Z inclusive production cross sections at sqrts=7 TeV with the CMS experiment at the LHC”, CMS CMS-PAS-EWK-10-005, 2010, http://cdsweb.cern.ch/record/1337017?ln=en
- [3] K. Melnikov and F. Petriello, “Electroweak gauge boson production at hadron colliders through ”, Phys. Rev. D74 (2006) 114017, arXiv:hep-ph/0609070. doi:10.1103/PhysRevD.74.114017.
- [4] K. Melnikov and F. Petriello, “The W boson production cross section at the LHC through ”, Phys. Rev. Lett. 96 (2006) 231803, arXiv:hep-ph/0603182. doi:10.1103/PhysRevLett.96.231803.
- [5] Van Der Meer, “Calibration of the Effective Beam Height in the ISR”, ISR-PO/68-31, KEK68-64
- [6] Eadie et al, “Statistical Methods in Experimental Physics”, Amsterdam: North-Holland, pp. 269–271, ISBN 0444101
- [7] Adam et al, “Theoretical Uncertainties in Electroweak Boson Production Cross Sections at 7, 10, and 14 TeV at the LHC” , JHEP 11 (2010) 074, arXiv:1006.3766