Argon Purification Studies and a Novel Liquid Argon Re-circulation System
Abstract
Future giant liquid argon (LAr) time projection chambers (TPCs) require a purity of better than 0.1 parts per billion (ppb) to allow the ionised electrons to drift without significant capture by any electronegative impurities. We present a comprehensive study of the effects of electronegative impurity on gaseous and liquid argon scintillation light, an analysis of the efficacy of various purification chemicals, as well as the Liverpool LAr setup, which utilises a novel re-circulation purification system. Of the impurities tested - Air, O2, H2O, N2 and CO2 in the range of between 0.01 ppm to 1000 ppm - H2O was found to have the most profound effect on gaseous argon scintillation light, and N2 was found to have the least. Additionally, a correlation between the slow component decay time and the total energy deposited with 0.01 ppm - 100 ppm O2 contamination levels in liquid argon has been established. The superiority of molecular sieves over anhydrous complexes at absorbing Ar gas, N2 gas and H2O vapour has been quantified using BET isotherm analysis. The efficiency of Cu and P2O5 at removing O2 and H2O impurities from 1 bar N6 argon gas at both room temperature and -130 ∘C was investigated and found to be high. A novel, highly scalable LAr re-circulation system has been developed. The complete system, consisting of a motorised bellows pump operating in liquid and a purification cartridge, were designed and built in-house. The system was operated successfully over many days and achieved a re-circulation rate of 27 litres/hour and high purity.
keywords:
Photon detectors for UV, visible and IR photons (vacuum) (photomultipliers, HPDs, others); Scintillators, scintillation and light emission processes (solid, gas and liquid scintillators); Gaseous detectors; Photon detectors for UV, visible and IR photons (gas); Noble-liquid detectors (scintillation); Cryogenic detectors1 Introduction
Purity of liquid argon (LAr) is an essential requirement for the operation of any LAr time projection chamber (TPC) detector. The ionisation electrons produced in a LAr detector, such as ArDM [1, 2, 3], a 1-ton two-phase scintillation/ionisation Dark Matter detector, must be able to drift over a distance longer than a metre, without substantial capture by electronegative impurities. The distances over which electrons will be required to be drifted will greatly increase as LAr TPCs expand in size, for example the proposed GLACIER (Giant Liquid Argon Charge Imaging ExpeRiment) neutrino TPC which will have drift distances of up to 20 metres [4, 5]. In the ICARUS LAr TPC, a maximum drift distance of 1.5 m requires a level of 0.1 parts per billion (ppb) oxygen equivalent [6], and in recent operations actual levels of 0.05 ppb were routinely achieved [7].
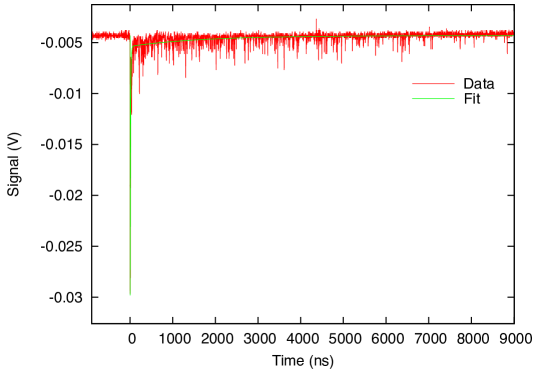
Argon scintillation emission is centred at approximately 128 nm and is characterised by two distinct decay times: a slow component, (triplet eximer), and a fast component, (single eximer) [8, 9]. To match the high quantum efficiency range of a photomultipler tube (PMT), the argon scintillation light can be shifted to visible using tetraphenyl-butadiene (TPB) [10]. A typical argon scintillation pulse at room temperature (RT) is shown in Figure 1. The decay time of the slow component, , increases with the increase of argon purity and therefore can be used as a relative measure of purity. The purest argon gas has been reported to have a of ns [8], whereas for pure liquid values of between 1100 ns and 1600 ns have been reported [11, 12]. This variation has been attributed partially to different fitting methods [13].
In addition to impeding the drifting of electrons, impurities within liquid argon can also absorb emitted UV photons or quench argon excimers, leading to a loss of light collection. The influence of various levels of Air, O2, H2O, N2, CO2 impurity concentrations on light collection in argon gas is examined in Section 2, whereas the effect of increasing O2 impurities on LAr scintillation light, using a different experimental setup, is examined in Section 6.3. Previous studies of the effect of N2 and O2 contamination in LAr have been reported in [13, 14].
The use of materials such as molecular sieves, copper and Oxisorb® reagent for gaseous argon (GAr) and LAr purification have been reported in [15, 16, 17, 18]. The purification mechanisms of molecular sieves are described and their efficiency is examined by adsorption measurements using BET (Brunauer, Emmett, Teller) isotherms [19], in Sections 3 and 4 respectively. The efficiency of copper (Cu) and phosphorous pentoxide (P2O5) at removing oxygen and water respectively is also assessed in Section 5.
Re-circulation of LAr through purification chemicals, such as those described in this paper, greatly enhances the rate and efficiency of purification. Purification of LAr has traditionally been performed by re-circulation in the gas phase followed by re-condensation. In Section 6 we present a novel re-circulation system which functions entirely in the liquid phase, and it crucially has the potential to be highly scalable, for use in kiloton detectors.
 |
2 Effects of Impurities on Argon Gas Scintillation Light
2.1 Experimental Procedure
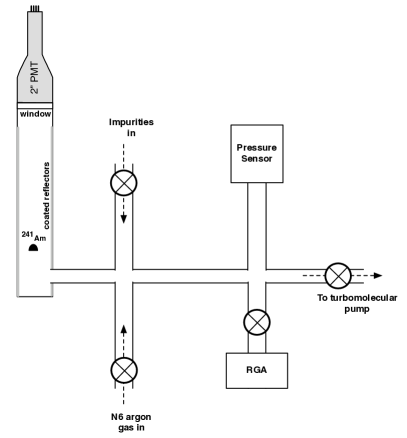
As a prelude to liquid argon purity measurements, the effect of introducing the contaminants air, oxygen, carbon dioxide, nitrogen, and water vapour into a highly purified 1 bar GAr environment (no gas flow) was measured. A schematic illustration of the experimental apparatus is shown in Figure 2. N6 argon (i.e. 1 ppm impurity level) was flowed at 2 lpm through a SAES getter which was nominally able to purify rare gases containing oxygen, water and carbon dioxide to 1 ppb levels. Each contaminant was introduced individually via a separate valve, and a residual gas analyser (RGA) connected through a bleed valve was used to measure the partial pressures of each element. The effect of the introduced impurities on GAr scintillation light was measured using a 2-inch ETL 9831KB PMT fixed externally to a viewing window at the top of a 600 mm long DN40 tube featuring 1 mg/cm2 TPB coated 3M™-foil walls and an alpha source at the base. The PMT signal was digitised at a sampling rate of 1 GS/s, using an Acqiris DP1400 digitiser. As the concentration of each impurity was varied, the PMT data was recorded and analysed for the fast component area, fast component time constant, total area, and slow component time constant.
 |
2.2 Results & Conclusions
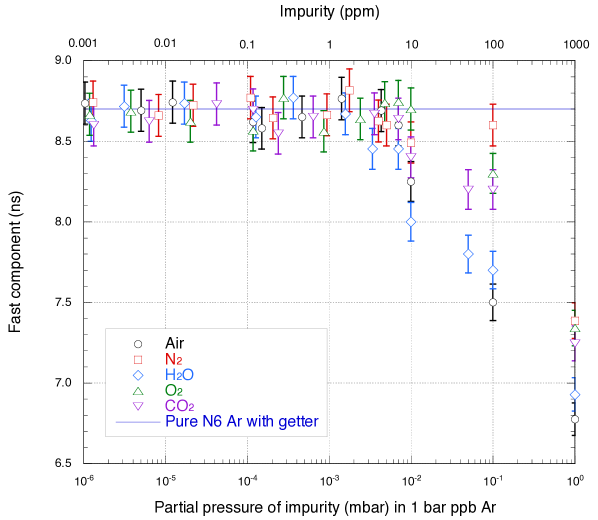
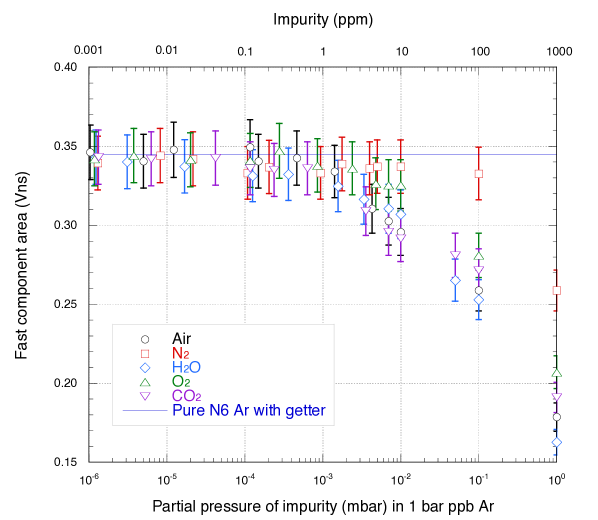
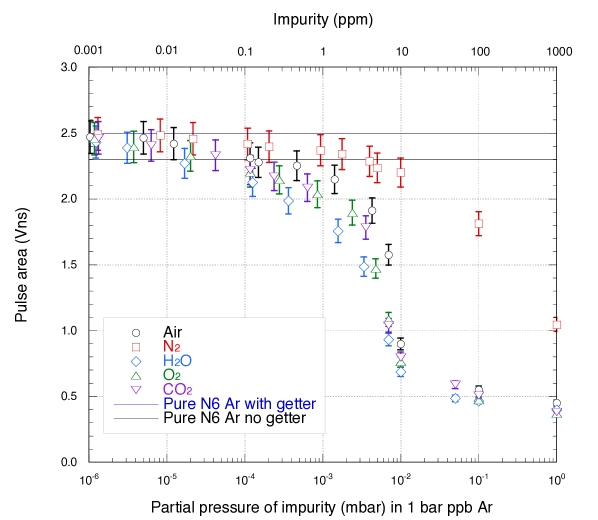
Figures 3 and 4 show that the fast component is only significantly affected by impurities at partial pressures greater than 10-2 mb. As 1 bar commercial N6 argon gas has an impurity partial pressure of 10-3 mb, the effect of impurities on the fast component is not a concern.
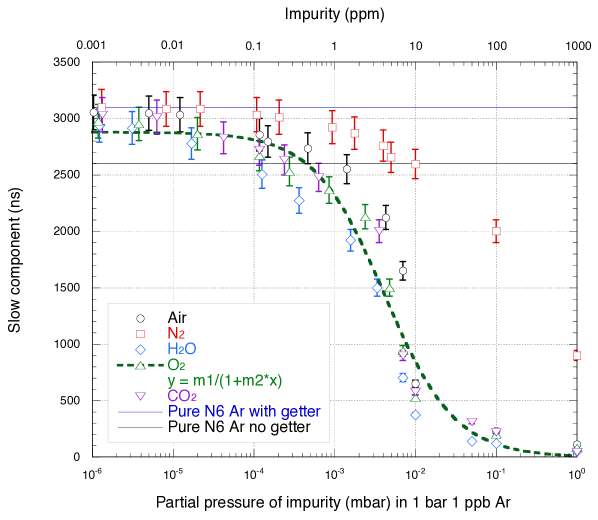
However, the slow component is much more sensitive to impurities, as can be seen in Figure 6 which shows that impurity partial pressures greater than 10-4 mb result in a significant decrease in the slow component decay time and a reduction in the total pulse area as shown in Figure 5.
Water was found to be very marginally the most significant impurity, followed by carbon dioxide and oxygen. Nitrogen was found to be the most benign impurity within argon gas, although it is most likely a VUV absorber rather than a quencher of the triplet state.
The quenching effect of impurities on the slow component of the argon gas scintillation light can approximately be described by a Birks’ law type function:
| (1) |
where, ′ is the asymptotic value of for zero impurities and k is a constant. The fitting of the O2 data (Figure 6), yields ′ = 2878 ns80 ns and k = 0.240.03.
 |
 |
 |
 |
3 Molecular Sieves
Molecular sieves contain small pores. Molecules small enough to pass through the pores are trapped while larger molecules are not. This property is called size or steric exclusion. Activated carbon, alumina (aluminium oxide), silica gel and zeolites are examples of molecular sieves [20]. Whilst all, especially activated carbon, are relatively inexpensive and suited to capturing large organic molecules, the latest molecular sieves such as zeolites are made of complex crystallographic structures of Na, K, Ca, Al, Si which do not collapse when dehydrated [21]. By selecting the optimal blend, molecular sieves can be graded to capture molecules with sizes between 3 Å and 10 Å. In addition to steric exclusion, zeolites have an extra property called thermodynamic selectivity. This is a measure of preferential absorption of certain components over others when all components are able to enter the pores. A broad majority of gas separations by zeolites occur because of this property. Thermodynamic selectivity is achievable because the adsorption of a particular gas is favourable over another on the accessible cationic sites within the crystal [22]. The adsorption capacity and selectivity depends on several parameters such as the size, shape, and structure of the zeolite cavity, cationic charge density, concentrations of cations, polarizability, and the dipole and quadrupole moment of the guest adsorbate molecules. In general, molecules with a stronger quadrupole moment and higher polarizability will be adsorbed more strongly. For example the larger quadropole moment of N2 relative to O2 was identified as being responsible for the N2 selectivity of many zeolites [23]. Molecular sieves can be used to purify argon based on the size/steric exclusion and thermodynamic selectivity properties.
4 Adsorption of N2, Ar and H2O
Measurement of the enthalpy of adsorption, total capacity, and effective surface area of interaction, for argon gas, nitrogen gas and water vapour on a range of molecular sieves and anhydrous complexes is described in this section. Adsorption is the process by which molecules or atoms become attached to a surface. This is particularly significant when a liquid or a gas comes into contact with a porous solid such as charcoal or aluminium oxide. The forces that bind an adsorbed molecule (adsorbate) to the surface may be chemical or physical, giving rise to chemisorption and physisorption respectively. The BET isotherm [19] describes adsorption and provides a route to measuring both the average enthalpy of adsorption and the effective surface area of the adsorber (e.g. activated charcoal). The BET equation is valid for multilayers of adsorbate assuming: the absorbate is an ideal gas; the energy of adsorption (energy released as the adsorbate bonds to the surface) is uniform over the entire surface; no adsorbate-adsorbate interaction occurs; the adsorbed molecules are immobile.
The BET equation is given by:
| (2) |
where, x is the relative pressure (P/po) at which a volume of gas V, measured at room temperature and pressure, is adsorbed. P is the pressure of the gas directly above the adsorber once equilibrium has been reached, and po is the saturation vapour pressure at the temperature of the reaction chamber containing the adsorber. Vm is the volume of adsorbed gas required for the formation of a monolayer on the adsorber at room temperature and pressure. C is an equilibrium rate constant given by:
| (3) |
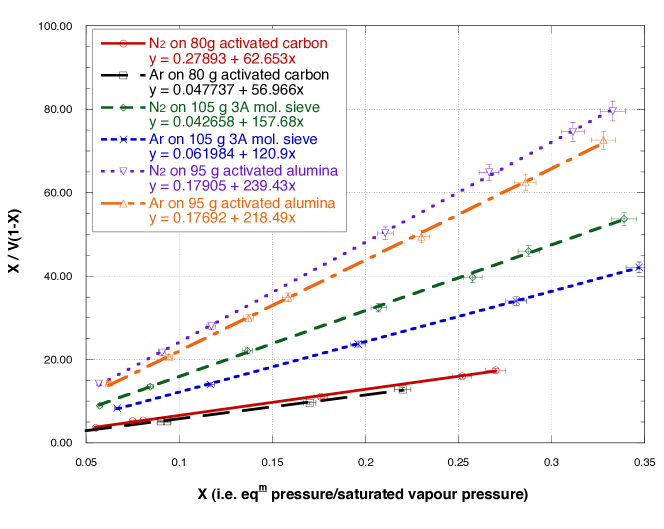
where, E1 is the average enthalpy of adsorption in the first layer and EL is the enthalpy of liquefaction of the adsorbate. a1, a2, b1 and b2 are constants related to the formation and evaporation of the first and higher layers of adsorbed molecules where a1b2/a2b1 1. The BET equation maintains a linear relationship only in the range of 0.05 x 0.35. A plot of the left-hand term of the BET equation against the relative pressure x, allows evaluation of the constants C and Vm from the slope and intercept.
The area of each adsorbed molecule can be calculated using the following equation:
| (4) |
where, M is the molecular weight of the adsorbate in kg, N is Avogadro’s number and d the density of the liquefied adsorbate in kg/m3.
Since Vm is the volume of gas at room temperature and pressure required to form a monolayer, then using the ideal gas law, the corresponding number of moles required to form a monolayer can be found, and from this the mass. Since the molecular area above represents the area taken up by one molecule, the total surface area can be calculated.
4.1 Experimental Method
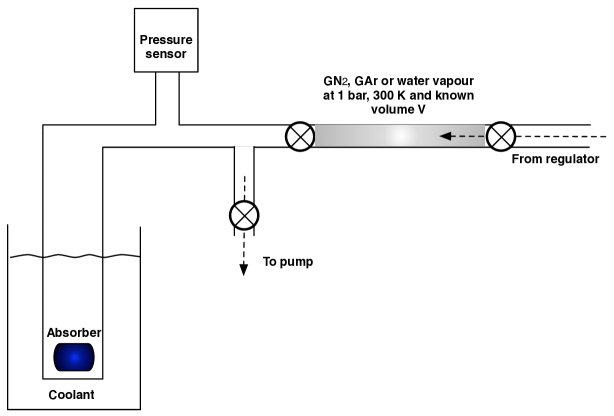
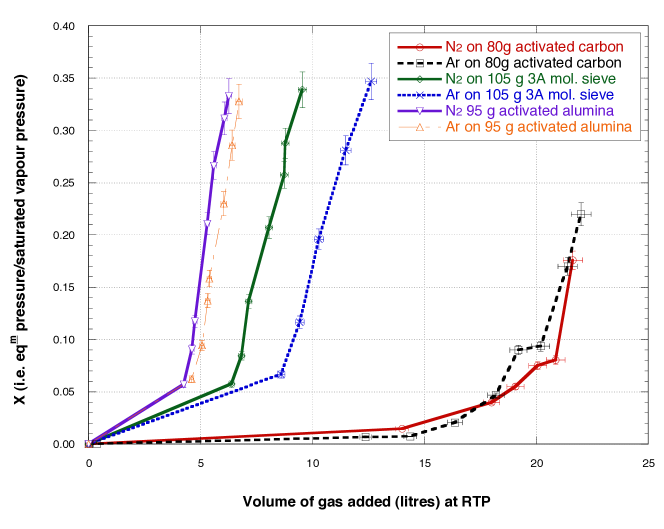
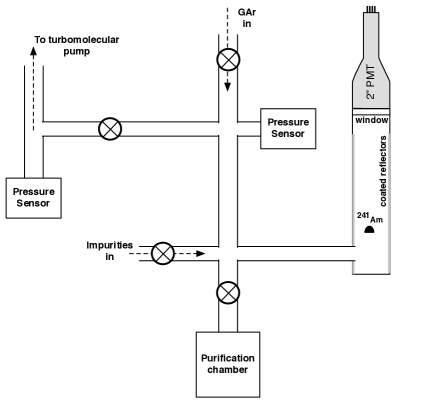
A schematic of the experimental apparatus utilised in this series of measurements is shown in Figure 7. A cylinder containing high pressure adsorbate gas was connected through two valves to a chamber containing an adsorber and a pressure sensor. All three valves shown in Figure 7 were opened and the adsorber was vacuum pumped for 4 hours and heated to 600 K. Once the apparatus had cooled down, all valves were shut and a LN2 dewar was placed around the adsorber chamber (for the water vapour tests the LN2 dewar was replaced by a cold water dewar). The saturation vapour pressure (SVP) of N2 and Ar at LN2 temperature are approximately 1000 mbar and 800 mbar respectively. The right hand valve was then opened and the test gas allowed to fill the volume marked in grey at 1 bar. The right hand valve was then closed and the middle valve opened, allowing gas to pass into the adsorber chamber. Over time (5 to 10 minutes) the pressure drops until equilibrium is reached. The gas of known volume V and the equilibrium pressure P were then recorded. This procedure was repeated until the equilibrium pressure approached 35% of the saturated vapour pressure, and the cumulative volume added was recorded against P/po. The adsorber was then maintained in 1 bar of gas until total saturation occurred, thus providing a measure of the total capacity. The entire experiment was performed separately for nitrogen gas, argon gas and water vapour, on a range of molecular sieves and anhydrous complexes.
 |
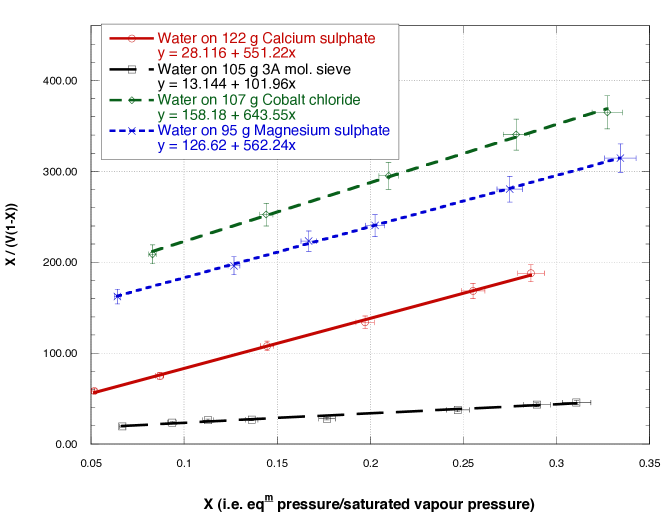
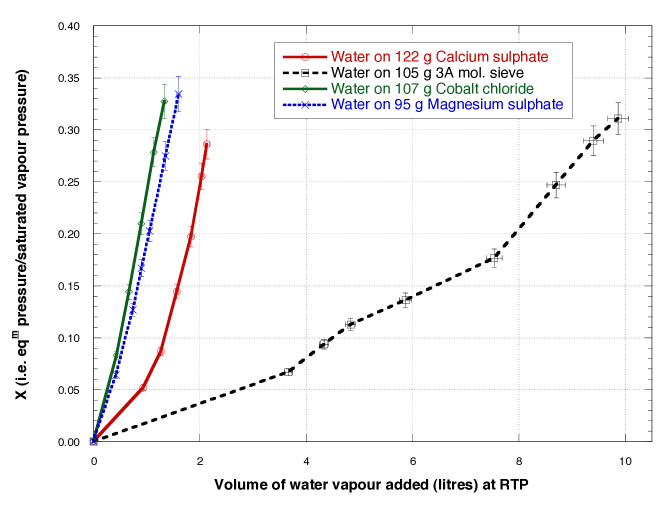
4.2 Adsorption Results & Conclusions
The results of the experiment are shown in Figures 8 to 11. Linear regression analysis of the data in Figures 8 and 10 allowed the calculation of Vm and C values. Plotting the volume of gas adsorbed as a function of the equilibrium pressure of gas above the sample (Figures 9 and 11) illustrates the rate of gas adsorption. For each adsorber, the surface area was determined from Vm and the molecular area of the adsorbant as explained above. A value for E1, the enthalpy of adsorption, and the maximum capacity were also determined and all results are shown in Table 1.
The data illustrate that nitrogen and water can be removed very efficiently with the use of molecular sieves. Anhydrous complexes such as calcium sulphate, magnesium sulphate and cobalt chloride, which do not interact with argon, were found to be much less efficient at removing water compared to molecular sieves. Argon is as likely as nitrogen or water to be adsorbed by any of the molecular sieves when tested individually. However, as described in Section 3, within a mixture of gas where all components can enter the pores, the molecular sieves action is based on thermodynamic selectivity. Additional substantiation can be found in [22] where adsorption measurements of air showed a selectivity of N2 over O2 in the same zeolite structure. Furthermore, a theoretical prediction in [24] reports an adsorption preference of N2 over O2 and Ar in a N2, O2, Ar gas mixture for a 5A molecular sieve. Therefore, this selectivity property of molecular sieves among components with similar critical diameters allows their use for the purification of argon.
 |
 |
 |
 |
| Combination |
|
|
|
||||||
|---|---|---|---|---|---|---|---|---|---|
| N2 and activated carbon | 9 | 65800 | 37 | ||||||
| Ar and activated carbon | 11 | 62500 | 42 | ||||||
| N2 and 3A Mol. sieve | 11 | 26300 | 23 | ||||||
| Ar and 3A Mol. sieve | 11 | 29500 | 27 | ||||||
| N2 and activated alumina | 10 | 17300 | 13 | ||||||
| Ar and activated alumina | 11 | 16300 | 16 | ||||||
| H2O and calcium sulphate | 48 | 4500 | 6 | ||||||
| H2O and 3A Mol. sieve | 46 | 22800 | 14 | ||||||
| H2O and cobalt chloride | 45 | 3300 | 3 | ||||||
| H2O and magnesium sulphate | 45 | 3800 | 4 |
5 Efficiency of Cu and P2O5 at Removing O2 and H2O
In this section the efficiency of copper powder and phosphorous pentoxide at the removal of oxygen and water respectively from argon gas is evaluated.
Copper reacts strongly with oxygen forming copper oxide. The chemical reaction can be written as:
| (5) |
Phosphorous pentoxide with an empirical formula P2O5 and molecular formula P4O10 reacts exothermically very strongly with water producing orthophosphoric acid. The chemical reaction can be written as:
| (6) |
Both of the chemicals were transferred into the experimental apparatus within an argon environment to avoid reactions with atmospheric components. P2O5 was handled with great care as it is hazardous upon skin contact and inhalation. In addition, Cu produces a large amount of heat when it reacts with O2. P2O5 was supplied by Sigma Aldrich [26], whereas Cu was produced by reducing CuO with H2 at 220 ∘C in a dedicated apparatus.
5.1 Experimental Method
A schematic of the experimental apparatus is shown in Figure 12. The purifying chemical was placed into a chamber which could be isolated from the rest of the system by a valve. The system was evacuated to 10-7 mbar, the purification chamber was isolated from the pumping stage and remainder of the apparatus, and impurities were introduced into the system. The impurities were evacuated to the required partial pressure (typically 0.5 mbar) and N6 argon gas was added so that the final gas pressure was 1 bar. Purity was then measured using a 200 mm long DN40 tube featuring 1 mg/cm2 TPB coated 3M™-foil walls with an alpha source at the base and a 2-inch ETL 9831KB PMT fixed externally to a viewing window at the top. The purification chamber valve was then opened exposing the argon and impurity gas mixture to the purifying chemicals. The increase in purity was then monitored by recording the change of the argon scintillation slow component with time, since this had been originally calibrated for each impurity (see Figure 6). This procedure was repeated at room temperature and -130 ∘C for Cu and P2O5 individually and a mixture of Cu and P2O5 for various partial pressures of oxygen and water. For the low temperature tests the purification chamber was immersed within an isobutyl-alcohol/liquid nitrogen mix freezing the alcohol to -130 ∘C 10 %. Low temperature tests were performed since the chemical reaction rate is also temperature dependent and the purification compounds could potentially be located within the liquid argon target.
 |
5.2 Results & Conclusions
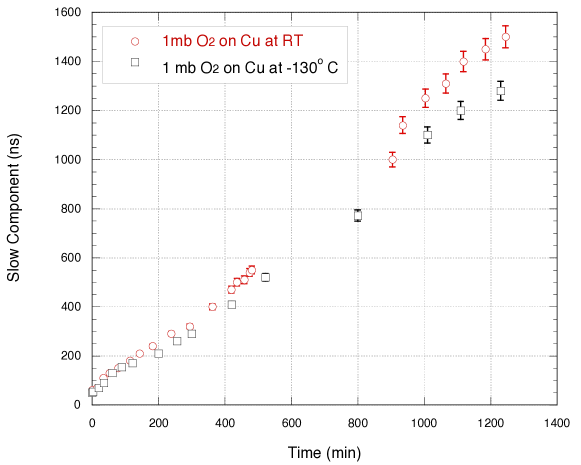
Figure 13 shows the slow component decay time increasing over time when copper was used to remove 1 mb O2 partial impurity from 1 bar N6 argon gas at room temperature and -130 ∘C. Within approximately 20 hours the slow component decay time increased from 60 ns to 1400 ns, indicating that copper removed the O2 impurity with high efficiency at both temperatures.
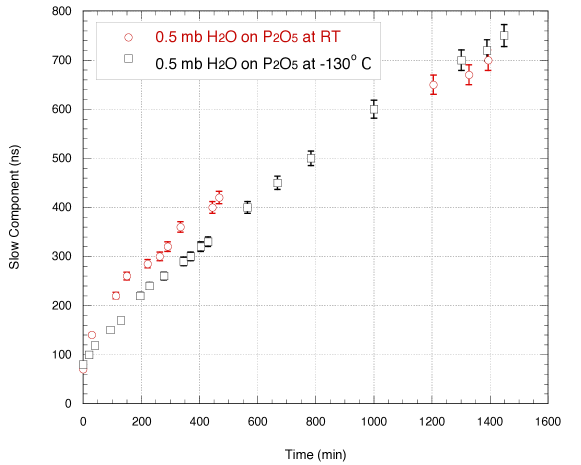
Phosphorous pentoxide also very capably improved the argon gas purity (down to a level of 4 ppm O2 equivalent impurity, based on Figure 6) by removing 0.5 mb H2O at room temperature and -130 ∘C as shown in Figure 14.
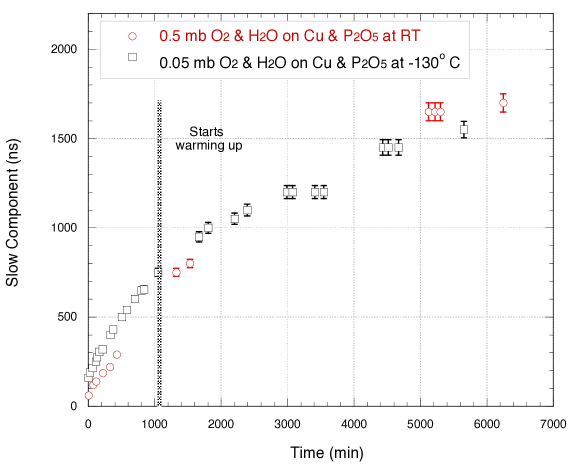
In addition, rapid purity improvement was observed for the Cu, P2O5 mixture during the first 17 hours of experimental operation at both temperatures tested (see Figure 15). The vertical black line in Figure 15 denotes the point at which the LN2 supply was stopped and the purification mixture was left overnight while gradually reaching room temperature (it is estimated that room temperature was reached within 5 hours). After 30 hours of experimental operation the slow component increased from approximately 50 ns to 1000 ns with this mixture and after 70 more hours the slow component had reached 1650 ns. With reference to Figure 6, 1650 ns corresponds to approximately 3 ppm O2 equivalent impurity. 1650 ns purity appears to be the purification limit of this mixture. This could be explained by the fact that Cu and P2O5 only remove O2 and H2O impurities, thus small concentrations of N2 and CO2 introduced with the O2 (the O2 used had 0.5 % impurities) remain in the system.
When comparing room and low temperature data for all the mixture combinations tested, it was observed that there was no significant alteration in the rate of purity increase, although a reduction in the rate of reaction was expected at the lower temperature. In the case of purification involving water impurities this may be due to the fact that at low temperatures the water condensed on the walls of the apparatus and froze, thus allowing a faster increase of purity while the actual reaction rate was slower. In the case of the copper reaction with O2, this could be attributed to the longer residency time of O2 on the copper’s surface at low temperatures. In other words, the molecules of O2 move slower at low temperatures, thus staying for a longer period on the surface of the copper powder giving it more time to react.
 |
 |
 |
6 The Liverpool LAr Setup
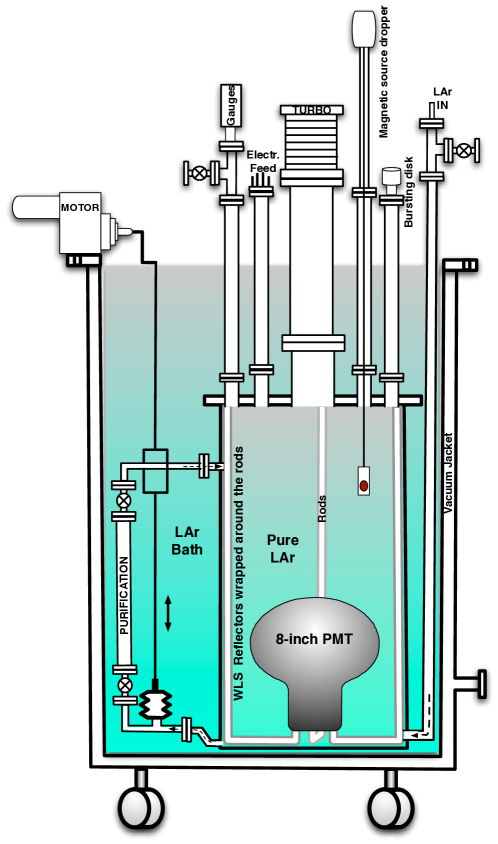
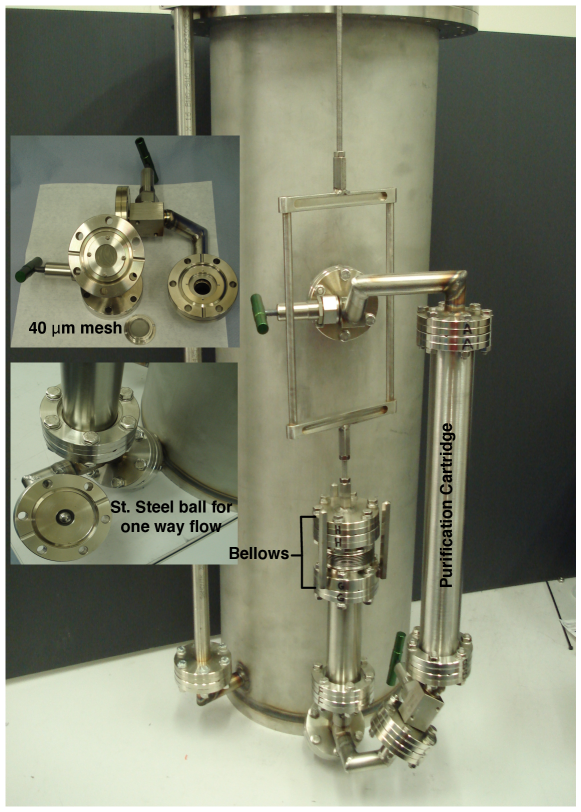
The Liverpool LAr setup, shown in Figure 16, consists of a 40 litre stainless steel conflat vacuum target vessel, which contains all the detector components and has an externally connected purification system on one side. The top flange has five vacuum ports used to mount a turbomolecular pump, pressure gauges, electrical feedthroughs, a bursting disk, and a movable magnetic actuator. The 40 litre vessel sits within a 250 litre stainless steel open LAr bath, in order to maintain the cryogenic argon temperature. The bath vessel, constructed by the University of Liverpool mechanical workshop, consists of two cylindrical chambers placed 2 cm apart concentrically and argon welded to the top flange, thus creating a vacuum jacket in order to minimise heat losses by conduction and convection. The outside of the inner bath chamber was wrapped twice with Mylar reflector to minimise heat losses by radiation.
The internal detector assembly consists of an 8-inch Pt underlay cryogenic Hamamatsu R5912-02MOD PMT, held at the bottom facing upwards by three stainless steel rods, around which 3M™-foil reflectors are wrapped. To shift the argon VUV light to the high quantum efficiency region of the PMT, the PMT window and 3M™-foil reflectors were coated with 0.05 mg/cm2 and 1 mg/cm2 TPB thickness respectively via vacuum evaporation. A parallel plate capacitor, positioned at the side of the PMT, was used as a LAr level sensor. The signal of the PMT was digitised at a sampling rate of 1 GS/s, using an Acqiris DP1400 digitiser. High rate scintillation light was generated with an Am-241 alpha source positioned on the magnetic actuator, which allowed the source to be moved between the liquid and gas phase of the detector.
 |
6.1 The Purification System
The purification system is mounted on the side of the 40 litre vessel. LAr re-circulation from the bottom of the target vessel and through a purification cartridge is achieved using an all-metal motorised bellows pump. This bellows pump (Figure 17), manufactured in Liverpool using high yield low modulus steel, operates with effectively zero wear, zero friction internal components, producing a sustained throughput across a pressure gradient during expansion and compression. A one way valve system was achieved by placing stainless steel balls before and after the bellows junction. The bellows is operated by an external geared motor to which it is connected via a connecting rod. As the bellows is completely immersed in the LAr bath, the only heat load is along the connecting rod to the external geared motor.
The re-generatable purification cartridge contained 250 g of activated copper and 300 g of a 3A, 4A and 13X molecular sieve mixture, all purchased from Sigma Aldrich [26]. The chemicals were contained within the cartridge by a 40 stainless steel mesh at either end. In this experiment phosphorous pentoxide was omitted from the cartridge due to safety concerns, and was replaced by the molecular sieves which were found to be efficient at adsorbing water.
The copper can be re-generated by the application of 220 ∘C using a heating tape wrapped around the cartridge and flushing with a mixture of 70 % argon and 30 % hydrogen gas. Once the copper is activated, re-baking the cartridge at 250 oC under vacuum for 8 hours will result in the reactivation of the molecular sieves.
 |
6.2 Demonstration of Re-circulation and Purification
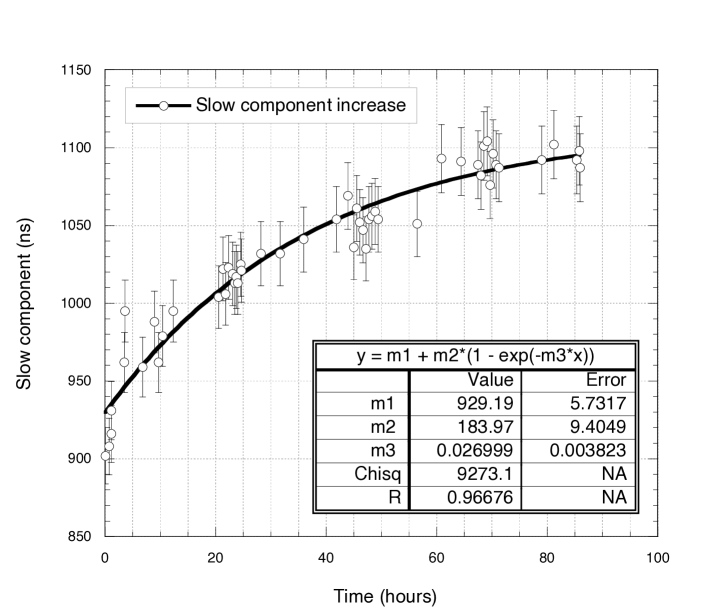
The gear motor was powered by a variac transformer adjusted to 30 rpm. The pump was successfully operated in liquid argon for 4 days at a pump rate of 30 rpm (0.5 Hz) without any failure or indication of degradation due to metal fatigue. At a pump rate of 30 rpm a single cycle displaces 15 ml, thus giving a flow rate of 27 litres/hour. Therefore, the entire LAr volume was re-circulated in less than two hours. The scintillation slow component decay time was used to monitor the purity during re-circulation. Figure 18 shows the slow component increase from approximately 900 ns to 1100 ns over a period of four days of re-circulation.
 |
6.3 Effect of O2 Impurity on LAr Scintillation
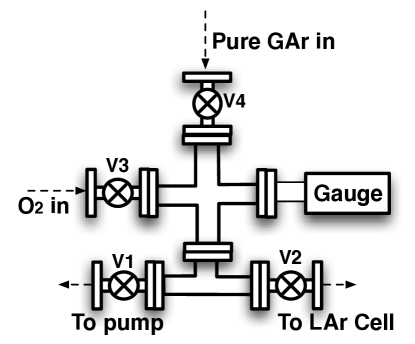
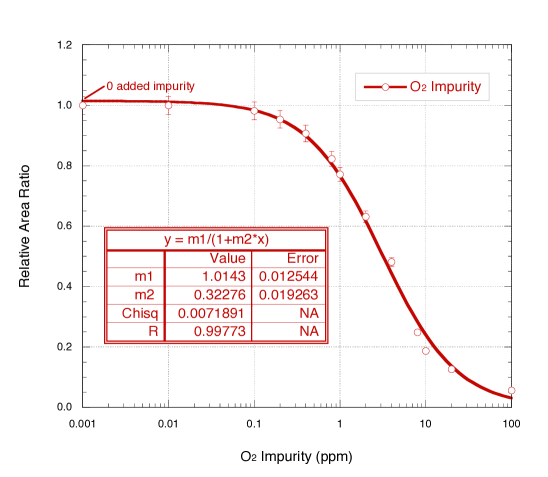
An additional experiment using the Liverpool LAr setup was performed in order to investigate the effect on the LAr scintillation light of 0.01 ppm to 100 ppm O2 contamination levels. Known partial pressures of O2 impurity were introduced into the system by employing a dedicated apparatus as shown in Figure 19. As the concentration of O2 was increased, PMT data were recorded and analysed for the total pulse area, and slow component decay time.
Prior to filling, the target vessel (including the contamination apparatus) was evacuated to 10-7 mb using a turbomolecular pump. 1 bar of pure argon gas was added into the system which was then cooled down at a rate of 1 ∘C/min by the slow addition of LAr into the bath, thus avoiding any thermal shock on the PMT. Once the target vessel reached LAr temperature, it was filled with 20 litres of LAr by condensing argon gas withdrawn from the gas phase of a LAr dewar purchased from BOC [25]. A first level of purification was made by passing the GAr through a purification getter containing 300 g of 3A and 13X molecular sieves before entry into the vessel. The initial slow component of the GAr introduced was measured to be approximately 3200 ns indicating a gas purity of 1 ppb based on the measurements described in Section 2. Once the target vessel was full, purification in the liquid phase was initiated by operation of the all-metal bellows pump recirculation system. After approximately 24 hours re-circulation, the LAr slow component decay time increased by 100 ns and levelled off at approximately 1100 ns based on Am-241 data.
Contamination of the target vessel with the required partial pressures, equivalent to 0.01 ppm, 0.1 ppm, 0.2 ppm, 0.4 ppm, 0.8 ppm, 1 ppm, 2 ppm, 4 ppm, 8 ppm, 10 ppm, 20 ppm and 100 ppm, were introduced using the dedicated apparatus (Figure 19) of 0.52 litres volume. Each contamination level was introduced by performing the following steps. The contamination apparatus was isolated from the system by closing valve V2, evacuated to 10-3 mb, and then filled with 1 bar O2 gas111This step, involving evacuating the contamination apparatus and then filling it with O2, was repeated many times to ensure that when the apparatus was finally pumped down to 10-3 mb, the gas within was almost totally O2 with no unknown impurities.. The apparatus was then pumped down to the required partial pressure, which was then mixed with 1 bar of pure argon gas and inserted into the system by opening valve V2. Finally, pure argon gas was flushed into the system for about 1 min in order to speed up the dilution process of the impurity with the LAr volume. As the melting and boiling points of O2 are - 218 ∘C and -183 ∘C respectively, O2 will have a liquid form in LAr. To verify uniform dilution, data-sets were recorded over a one hour time span between consecutive contamination additions. On average the impurity was observed to be fully dispersed within 20 min.
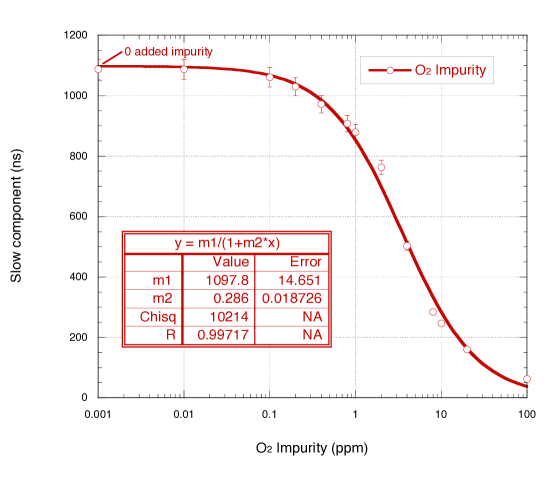
For all impurity levels, 20000 events with a 10 s time window were recorded. Each individual event pulse was parameterised by the sum of two exponential functions with all parameters varying in the fit. The Gaussian mean of the pulse parameters was then monitored. Figure 20 shows the correlation of the slow component decay time with ppm added O2 impurity, whereas Figure 21 shows the ratio of the contaminated total pulse area to pure argon total pulse area. A Birks’ law type function fit (similarly to Section 2 for gas data) was applied to the data allowing an approximate description of the quenching effect of O2 impurity on the slow component and total deposited energy of the LAr scintillation light.
 |
 |
 |
7 Conclusions
The study of the effect of a range of impurity partial pressures within 1 bar N6 argon gas on the scintillation light showed that the slow component is very sensitive to the impurities tested, with H2O having the greatest effect followed by CO2, O2 and lastly N2. This allows the decay time of the slow component to be calibrated to the partial pressure of the impurities utilised.
Adsorption of Ar gas, N2 gas and H2O vapour by various molecular sieves and anhydrous complexes was studied. The molecular sieves were far superior than the anhydrous complexes at adsorbing the impurities. The use of molecular sieves for argon purification will not be compromised by the fact that molecular sieves adsorb argon, as within a mixture of gas, where all components can enter the pores, the action is based on thermodynamic selectivity.
The efficiency of Cu and P2O5 at removing oxygen and water impurities from 1 bar N6 argon gas at both room temperature and -130 ∘C was found to be high.
A novel LAr re-circulation system with a home made purification cartridge and a motorised metal bellows pump was successfully operated. Within 4 days of continuous re-circulation the slow component decay time was increased by 200 ns reaching 1100 ns. The amount of LAr passing through the purification cartridge can be effectively increased by using bigger bellows and connecting multiple ones in parallel. For example, a 4 cylinder pump with DN63CF bellows could re-circulate over 450 litres per hour, thus making it applicable and cost effective for a multi tonne scale system.
Finally, the slow component decay time and the total deposited energy of the LAr scintillation light variation with increasing ppm O2 impurity concentrations (0.01 ppm to 100 ppm) was determined.
Acknowledgements.
Part of this work was submitted by K. Mavrokoridis in partial fulfilment for the degree of Doctor of Philosophy, University of Sheffield, UK. The Authors are grateful for the expertise and dedicated contributions of the Mechanical Workshop of the Physics Department, University of Liverpool. We acknowledge the support of the University of Liverpool, STFC, and the Royal Society.References
- [1] A. Rubbia (ArDM Collaboration), ArDM: a ton-scale liquid Argon experiment for direct detection of Dark Matter in the Universe, \hrefhttp://dx.doi.org/10.1088/1742-6596/39/1/028 J. Phys. Conf. Ser. 39 (2006) 126 [\hrefhttp://arxiv.org/abs/hep-ph/0510320arXiv:hep-ph/0510320].
- [2] M. Laffranchi and A. Rubbia (on behalf of the ArDM collaboration), The ArDM project: a Liquid Argon TPC for Dark Matter Detection, \hrefhttp://dx.doi.org/10.1088/1742-6596/65/1/012014 J. Phys. Conf. Ser. 65 (2007) 2014 [\hrefhttp://arxiv.org/abs/hep-ph/0702080arXiv:hep-ph/0702080].
- [3] ArDM collaboration, The argon dark matter experiment (ArDM), \hrefhttp://dx.doi.org/10.1088/1742-6596/203/1/012024 J. Phys. Conf. Ser. 203 (2010) 2024.
- [4] A. Rubbia, Experiments For CP-Violation: A Giant Liquid Argon Scintillation, Cerenkov And Charge Imaging Experiment?, (2004) [\hrefhttp://arxiv.org/abs/hep-ph/0402110arXiv:hep-ph/0402110].
- [5] A. Rubbia, Underground Neutrino Detectors for Particle and Astroparticle Science: The Giant Liquid Argon Charge Imaging ExpeRiment (GLACIER), \hrefhttp://dx.doi.org/10.1088/1742-6596/171/1/012020 J. Phys. Conf. Ser. 171 (2009) 2020 [\hrefhttp://arxiv.org/abs/0908.1286arXiv:0908.1286].
- [6] S. Amerio et al., Design, construction and tests of the ICARUS T600 detector, \hrefhttp://dx.doi.org/10.1016/j.nima.2004.02.044 Nucl. Instrum. Meth. A 527 (2004) 329.
- [7] C. Rubbia et al., Underground operation of the ICARUS T600 LAr-TPC: first results, submitted to JINST (2011) [\hrefhttp://arxiv.org/pdf/1106.0975v2arXiv:1106.0975v2].
- [8] J. W. Keto, R. E. Gleason and G. K. Walters, Production Mechanisms and Radiative Lifetimes of Argon and Xenon Molecules Emitting in the Ultraviolet, \hrefhttp://dx.doi.org/10.1103/PhysRevLett.33.1365 Phy. Rev. Lett. 33 (1974) 1365.
- [9] S. Kubota, M. Hishida and J. Raun, Evidence for a triplet state of the self-trapped exciton states in liquid argon, krypton and xenon, \hrefhttp://dx.doi.org/10.1088/0022-3719/11/12/024 J. Phys. C: Solid State Phys. 11 (1978) 2645.
- [10] ArDM Collaboration, Development of wavelength shifter coated reflectors for the ArDM argon dark matter detector, \jinst42009P06001 [\hrefhttp://arxiv.org/pdf/0904.0246arXiv:0904.0246].
- [11] E. Morikawa, R. Reininger, P. Gürtler, V. Saile and P. Laporte, Argon, krypton, and xenon excimer luminescence: From the dilute gas to the condensed phase, \hrefhttp://dx.doi.org/10.1063/1.457108 The Journal of Chemical Physics 91 (1989) 1469.
- [12] A. Hitachi, T. Takahashi, N. Funayama, K. Masuda, J. Kikuchi and T. Doke, Effect of ionization density on the time dependence of luminescence from liquid argon and xenon, \hrefhttp://dx.doi.org/10.1103/PhysRevB.27.5279 Physical Review B 27 (1983) 5279.
- [13] R. Acciarri et al., Effects of Nitrogen contamination in liquid Argon, \jinst52010P06003 [\hrefhttp://arxiv.org/abs/0804.1217 arXiv:0804.1217].
- [14] R. Acciarri et al., Oxygen contamination in liquid Argon: combined effects on ionization electron charge and scintillation light, \jinst52010P05003 [\hrefhttp://arxiv.org/abs/0804.1222 arXiv:0804.1222].
- [15] G. G. Maksimovich, N. P. Drozd M. I. Shevchuck and V. S. Baranetski Three stage apparatus for the purification of argon, \hrefhttp://dx.doi.org/10.1007/BF00721679 Fiziko-Khimicheskaya Mekhanika Materialov 4 (1968) 712.
- [16] P. J. Doe et al., A large scale purification system for a liquid argon time projection chamber, \hrefhttp://dx.doi.org/10.1016/0168-9002(87)90053-2 Nucl. Instrum. Meth. A 258 (1987) 170.
- [17] G. Bressi et al., Argon purification in liquid phase, \hrefhttp://dx.doi.org/10.1109/ICDL.1990.202876 Conference Record. Tenth International Conference on Conduction and Breakdown in Dielectric Liquids (1990) 137.
- [18] P. Gennini et al., Argon purification in the liquid phase, \hrefhttp://dx.doi.org/10.1016/0168-9002(93)91209-6 Nucl. Instrum. Meth. A 333 (1993) 567.
- [19] S. Brunauer, P. H. Emmett and E. Teller, Adsorption of gases in multimolecular layers, \hrefhttp://dx.doi.org/10.1021/ja01269a023 J. Am. Chem. Soc. 60 (1938) 309.
- [20] H. V. Beckkum, P. A. Jacob, E. M. Flanigen and J. C. Jansen, Introduction to Zeolite Science and Practice, Elsevier, 2001.
- [21] R. P. W. Scott, Gas Chromatography, \hrefhttp://www.library4science.com/ Chrom-Ed eBook series.
- [22] S. M. Aurbach, K. A. Carrado and P. K. Dutta, Handbook of Zeolite Science and Technology, Marcel Dekker Inc., 2003.
- [23] R. M. Barrel and W. I. Stuart, Ion exchange and the thermodynamics of intracrystalline sorption, \hrefhttp://dx.doi.org/10.1098/rspa.1959.0039 Proc. R. Soc. London Ser. A 249 (1959) 249.
- [24] G. W. Miller, K. S. Knaebel and K. G. Ikels Equilibria of Nitrogen, Oxygen, Argon, and Air in Molecular Sieve 5A, \hrefhttp://dx.doi.org/10.1002/aic.690330204 AIChE Journal 33 (1987) 194.
- [25] BOC, \hrefwww.boconline.co.uk www.boconline.co.uk.
- [26] Sigma-Aldrich, \hrefwww.sigmaaldrich.com www.sigmaaldrich.com.