Grand Design and Flocculent Spirals in the Survey of Stellar Structure in Galaxies (S4G)
Abstract
Spiral arm properties of 46 galaxies in the Survey of Stellar Structure in Galaxies (S4G) were measured at m, where extinction is small and the old stars dominate. The sample includes flocculent, multiple arm, and grand design types with a wide range of Hubble and bar types. We find that most optically flocculent galaxies are also flocculent in the mid-IR because of star formation uncorrelated with stellar density waves, whereas multiple arm and grand design galaxies have underlying stellar waves. Arm-interarm contrasts increase from flocculent to multiple arm to grand design galaxies and with later Hubble types. Structure can be traced further out in the disk than in previous surveys. Some spirals peak at mid-radius while others continuously rise or fall, depending on Hubble and bar type. We find evidence for regular and symmetric modulations of the arm strength in NGC 4321. Bars tend to be long, high amplitude, and flat-profiled in early type spirals, with arm contrasts that decrease with radius beyond the end of the bar, and they tend to be short, low amplitude, and exponential-profiled in late Hubble types, with arm contrasts that are constant or increase with radius. Longer bars tend to have larger amplitudes and stronger arms.
1 Introduction
Measurements of spiral arm properties over a range of passbands provide clues to the mechanisms of star formation and the generation of spiral waves. The Space Telescope enables an extension to the mid-IR, where extinction is small, light is dominated by old stars, and the arms can be traced further out in the disk than in previous optical and near-IR studies due to the greater sensitivity of the images. The purpose of the present paper is to examine a representative sample of galaxies with a range of spiral Arm Classes, Hubble types, and bar types using the Spitzer Survey of Stellar Structure in Galaxies (S4G; Sheth et al. 2010). Our motivations are to determine whether the arm strengths in the mid-IR are similar to those in the optical and near-IR, to trace spiral arms far out in the disk, and to examine how the arm structures and amplitudes vary with radius, Hubble type, and different bar properties.
Spiral arms and bars have been measured and interpreted theoretically for more than 50 years. They have many key properties that should be reviewed before presenting the new data. In the next section, we consider these properties and what they imply about the origins of spiral structure. Our S4G survey confirms most of the previous observations and introduces new questions about radial profiles of spiral arm strengths, spiral structures in the far outer regions, and interactions between bars and spirals. In Section 3 we describe the dataset. In Section 4, we discuss spiral symmetry (Sect. 4.1), arm-interarm contrasts (Sect. 4.2), Fourier transform analyses (Sect. 4.3), spiral arm amplitude modulations (Sect. 4.4), smooth outer arms (Sect. 4.5), sharp outer arm edges (Sect. 4.6), and bar properties (Sect. 4.7). Our conclusions are in Section 5.
2 Prior Observations of Galactic Spirals and Bars
The linear wave theory of Lin & Shu (1964) suggested that spiral structure is an instability in the disk of old stars, with relatively weak waves made visible optically by triggered star formation (Roberts, 1969). Streaming motions in HI (Visser, 1980) confirmed the density wave picture for the grand design spiral M81, and early photometry based on , and -band photographic plates (Schweizer, 1976) and -band plates (Elmegreen & Elmegreen 1984; hereafter EE84) showed spiral modulations of the underlying stellar disk. These modulations were stronger than expected from the Lin-Shu linear wave theory, so the role of star formation and color gradients in delineating the arms diminished (Elmegreen & Elmegreen, 1986).
In contrast, old stellar waves could not be seen in many galaxies with short and patchy spirals (EE84), suggesting that these “flocculent” types are nearly pure star formation (e.g., Seiden & Gerola 1979; Elmegreen 1981; EE84). Multiple arm galaxies with inner 2-arm symmetry and several long arms were seen to be an intermediate case: they have underlying stellar spirals that are often regular in the inner parts and irregular in the outer parts (Elmegreen & Elmegreen, 1984, 1995).
The irregularities in flocculent and multiple arm galaxies agree with theoretical predictions of random gravitational instabilities in the gas (Goldreich & Lynden-Bell, 1965) and old stars (Julian & Toomre, 1966; Kalnajs, 1971). The symmetric spirals in some grand design galaxies could be tidal features (e.g. Dobbs et al., 2010), and other symmetric spirals, along with the inner symmetric parts of multiple arm galaxies, could be wave modes reinforced by reflection or refraction in the central regions and amplified at corotation (Bertin et al., 1989; Bertin, 2000). The swing amplifier theory of Toomre (1981) may apply to both the irregular arms and the regular wave modes (Athanassoula 1992; see also Athanassoula, Bosma, & Papaioannou 1987). Early computer simulations of galactic spirals almost always showed patchy and multiple arms (Sellwood & Carlberg, 1984), although steady 2-arm spirals were possible if the conditions were right (Thomasson et al., 1990). Modern theories suggest that some spirals and rings may be orbital features in a bar potential (Romero-Gómez et al., 2006, 2007; Athanassoula et al., 2009a, b, 2010).
Observations at -band confirmed the large amplitudes of stellar waves in grand design and multiple arm galaxies (Rix & Rieke, 1993; Regan & Vogel, 1994; Rix & Zaritsky, 1995; Knapen et al., 1995; Block et al., 2004a). Flocculent spirals rarely have underlying stellar waves even in -band. Weak 2-arm spirals were first found in some flocculent galaxies by Block et al. (1994), Thornley (1996), Thornley & Mundy (1997) and Elmegreen et al. (1999), and discussed by Block & Puerari (1999) and Seigar, Chorney, & James (2003). Kendall, Kennicutt, & Clarke (2011) find that about half of the 31 galaxies studied from the Spitzer Infrared Nearby Galaxies Survey (Kennicutt et al., 2003, SINGS) have underlying 2-arm structure, and all of the optically grand design galaxies are grand design in the mid-IR as well. They found a correlation between outer spiral arms and bars and between spirals and companion galaxies. Previously, Kormendy & Norman (1979), Seigar & James (1998a), and many others observed that global spiral patterns are associated with bars or companions.
The current interpretation of spiral structure suggests that grand design spiral arms and the symmetric inner parts of multiple arm galaxies are primarily spiral waves. The gas falls into this potential well, or that formed by the manifold spirals, and shocks, making a dust lane. Star formation follows quickly in the dense molecular gas, and the clouds and OB associations disperse downstream. Most of the structures in flocculent galaxies and the outer irregular arms of multiple arm galaxies are presumably from local instabilities in either the gas alone for flocculents, or in the gas plus stars for long irregular arms. The difference depends on the stability of the stellar part of the disk in the two-fluid, gas+star system. Dobbs & Pringle (2010) discussed the possibility that some of the differences in spiral arm types might be determined from azimuthal gradients of cluster ages.
Stellar bars are another important feature of galaxy disks and presumably play a role in driving disk evolution and spiral structure. Although the fraction of barred galaxies remains the same in the near-IR and the optical (Menéndez-Delmestre et al., 2007), in some cases they may appear to be much more prominent at the longer passbands (Hackwell & Schweizer, 1983; Eskridge et al., 2000). The properties of stellar bars were investigated in early photometric studies too (e.g., Elmegreen & Elmegreen 1985, hereafter EE85; Baumgart & Peterson 1986; Ann 1986). Two types of bars were found using and bands (EE85) and band (Regan & Elmegreen, 1997; Laurikainen et al., 2007). In early Hubble types, bars tend to be high amplitude, long, and flat in their surface brightness radial profile, with a radially decreasing spiral arm amplitude beyond the bar. In late Hubble types, bars tend to be low amplitude, short, and exponential in profile, with rising spiral arm amplitudes beyond the bar.
Angular momentum exchange between bars, disks and halos was studied by Debattista & Sellwood (2000), Athanassoula & Misiriotis (2002), Athanassoula (2003), Valenzuela & Klypin (2003), Athanassoula et al. (2009c), and others. They all predicted that bars should grow over time. This prediction is consistent with -band observations by Elmegreen et al. (2007) that longer and higher amplitude bars correlate with denser, faster-evolving galaxies.
Bar torques were studied by Buta, Block, and collaborators (Buta & Block 2001; Block et al. 2001, 2002; Buta et al. 2004, 2006; Laurikainen et al. 2004, 2007; see also Combes & Sanders 1981). The ratio of the maximum azimuthal force from a bar or spiral to the radial force from all of the matter inside that radius is a measure of the bar or spiral strength and is commonly called the torque parameter. Block et al. (2002) found a wide distribution of total bar + spiral torque, , in a large near-infrared sample of galaxies, and suggested that most galaxies have torques that drive disk evolution. Buta et al. (2005) found a smoothly declining distribution function of relative bar torque, with no clear separation between strong and weak bars. They also found a correlation between bar and spiral torques, and noted that later Hubble types have larger relative bar torques because the bulges are weaker.
Combes & Elmegreen (1993) and Athanassoula & Misiriotis (2002) simulated flat and exponential bars by varying the inner rotation curve or halo concentration. Flat bars tend to occur in galaxies with sharply rising inner rotation curves, and exponential bars occur in galaxies with slowly rising rotation curves. These two cases are halo-dominated and disk-dominated in the bar region, leading Athanassoula & Misiriotis (2002) to call them types “MH” and “MD,” respectively. Two bar types were also modeled by Athanassoula et al. (2009c) and compared to observations by Gadotti et al. (2007). They noted that flat bars exchange more angular momentum with the halo than exponential bars. This may explain why galaxies with flat bars tend to have 2-arm spirals, while those with exponential bars have multiple arm or flocculent spirals (EE85). Related to this is the observation that higher amplitude bars tend to have stronger arms, as measured by bar-interbar and arm-interarm contrasts (EE85; Ann & Lee 1987; Elmegreen et al. 2007; Buta et al. 2009; Salo et al. 2010). This correlation suggests that bars drive spirals through angular momentum exchange with the disk.
Fourier transforms provide an objective indicator of spiral arm and bar amplitudes, as first measured by Iye et al. (1982), Schlosser & Musculus (1984), EE85, and Considère & Athanassoula (1988). In a recent study, Durbala et al. (2009) did Fourier decompositions of Sloan Digital Sky Survey -band images of isolated barred and non-barred intermediate-type galaxies, and confirmed the earlier studies that the lengths and amplitudes of bars decrease from early to late Hubble types.
Several studies have noted correlations or weak correlations between bar length and bar ellipticity (a proxy for bar strength), including recent work by Gadotti (2010) and Comerón et al. (2010) and references therein. A recent Galaxy Zoo study of over 3000 Sloan Digital Sky Survey galaxies also shows a correlation between bar length and ellipticity, and notes that longer bars are associated with earlier type galaxies (Hoyle et al., 2011).
In the following S4G survey of spirals and bars, many of the features found in the optical and near-IR are reproduced with better clarity here and with greater extension into the outer disk. Such similarity between global structures over a wide range of wavelengths suggests that these structures are massive. Because the m and m images also contain hot dust (Rix & Zaritsky, 1995), PAH emission (Draine & Li, 2007), AGB stars (Meidt et al., 2011), and red supergiants, there is a resemblance among different passbands in the star-formation features too. Future images with these contaminants removed (Meidt et al., 2011) could reveal other aspects of spirals and bars that are not observed here.
3 Data
The S4G is a survey of 2331 nearby galaxies in and using channels 1 and 2 of the Infrared Array Camera (IRAC; Fazio et al., 2004) of the Spitzer Space Telescope. It includes archival and warm mission observations. The images reach a limiting surface brightness of mag arcsec-2, which is deeper than most previous spiral arm studies. The galaxies were all processed or re-processed uniformly through the S4G pipeline (Sheth et al., 2010). For the current study, we used the images, with a pixel scale of and a resolution of . The m images were also examined, but the results were generally similar to those at m so we do not discuss them specifically. Both passbands highlight the old stellar disks of spiral galaxies.
Our 46 galaxies were selected to include representative Hubble types Sa through Sm, bar types SA, SAB, and SB, and Arm Classes flocculent, multiple arm, and grand design. Half of our sample, 24 galaxies, is part of the SINGS galaxy sample (Kennicutt et al., 2003). In our sample, the average blue-light radius (where the surface brightness is 25 mag arcsec-2) is , and the average inclination is (from the Third Reference Catalogue of Bright Galaxies, de Vaucouleurs et al. 1991, hereafter RC3). These galaxies constitute % of the S4G sample with and inclination . A more definitive study of spiral and bar structures in galaxies will be possible when the S4G survey is complete.
Our sample is listed in Table LABEL:table1 with spiral Arm Class, bar type, and mid-IR Hubble type. Arm Classes are from the classification system based on optical images (Elmegreen & Elmegreen, 1987), except for NGC 3049 classified here. That paper has a 12-point subdivision of Arm Classes to highlight details. Here we combine the Arm Classes into the three main divisions, so F (flocculent) refers to Arm Classes 1-3, M (multiple arm) is Arm Classes 4-9, and G (grand design) is Arm Classes 10-12. Bar types (A=non-barred, AB=intermediate, B=barred) and mid-IR Hubble spiral types (Sa through Sm) are from Buta et al. (2010), except for three which get their types from the RC3 (NGC 4450, 4689, and 5147). The mid-IR types differ from the RC3 types by about 1 stage (earlier) for intermediate type spirals, but are similar for earlier and later types. What we call bar type and Hubble type here are synonymous with “family classification” and “stage” in Buta et al. (2010).
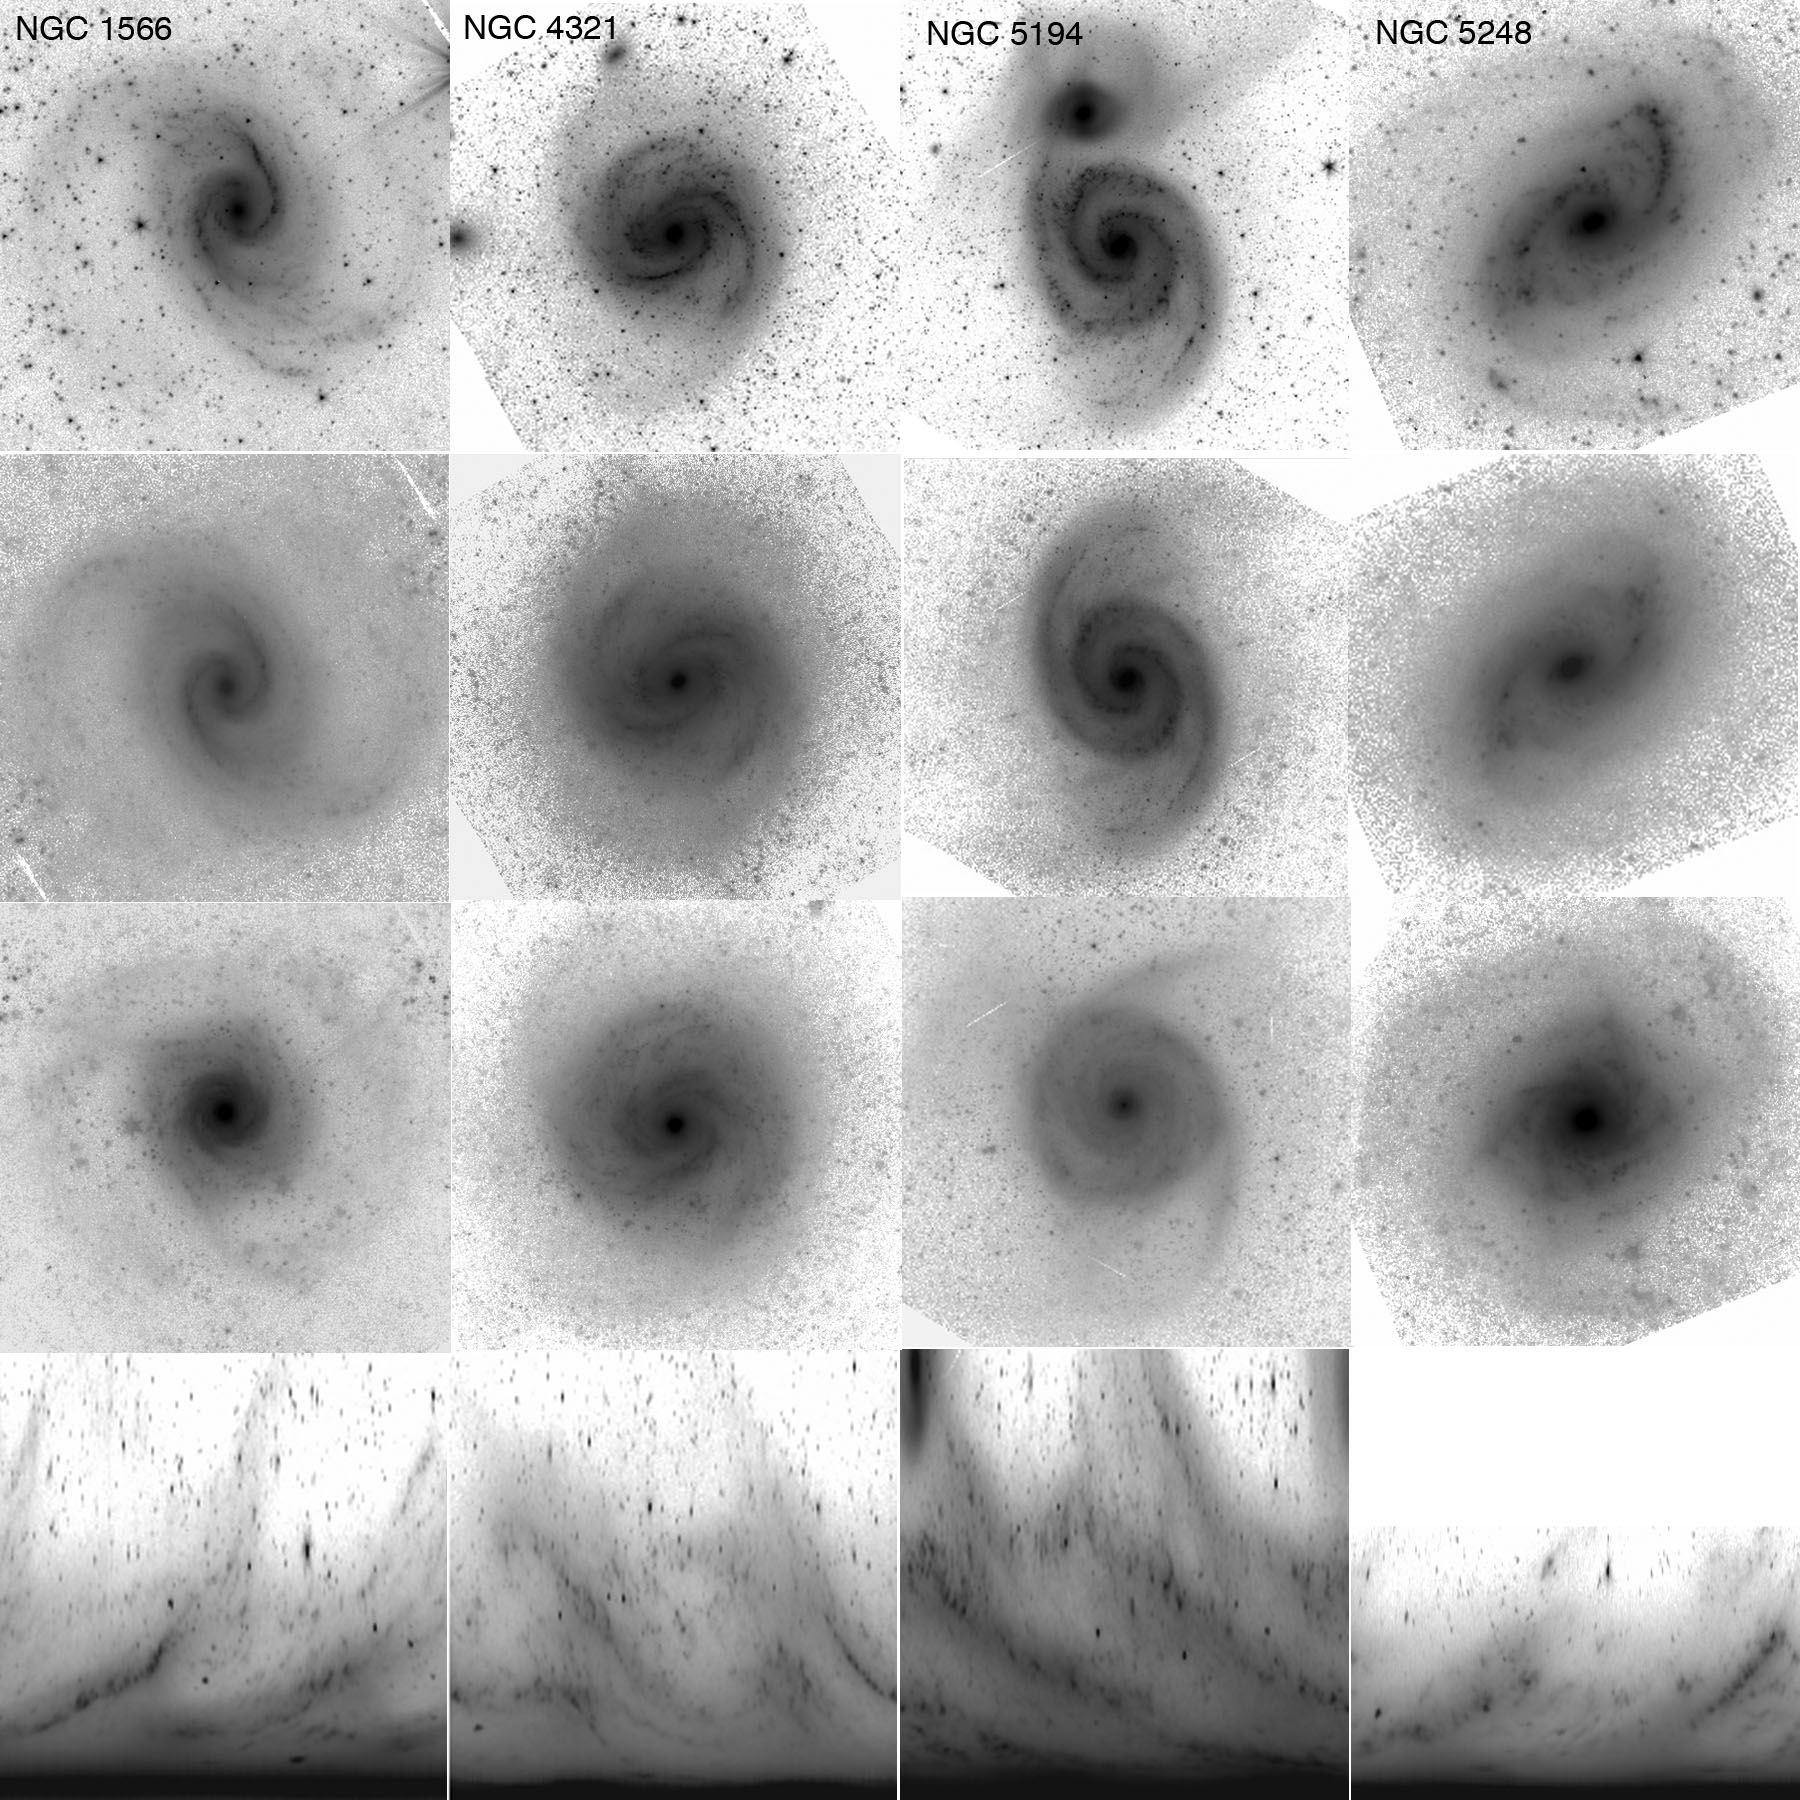
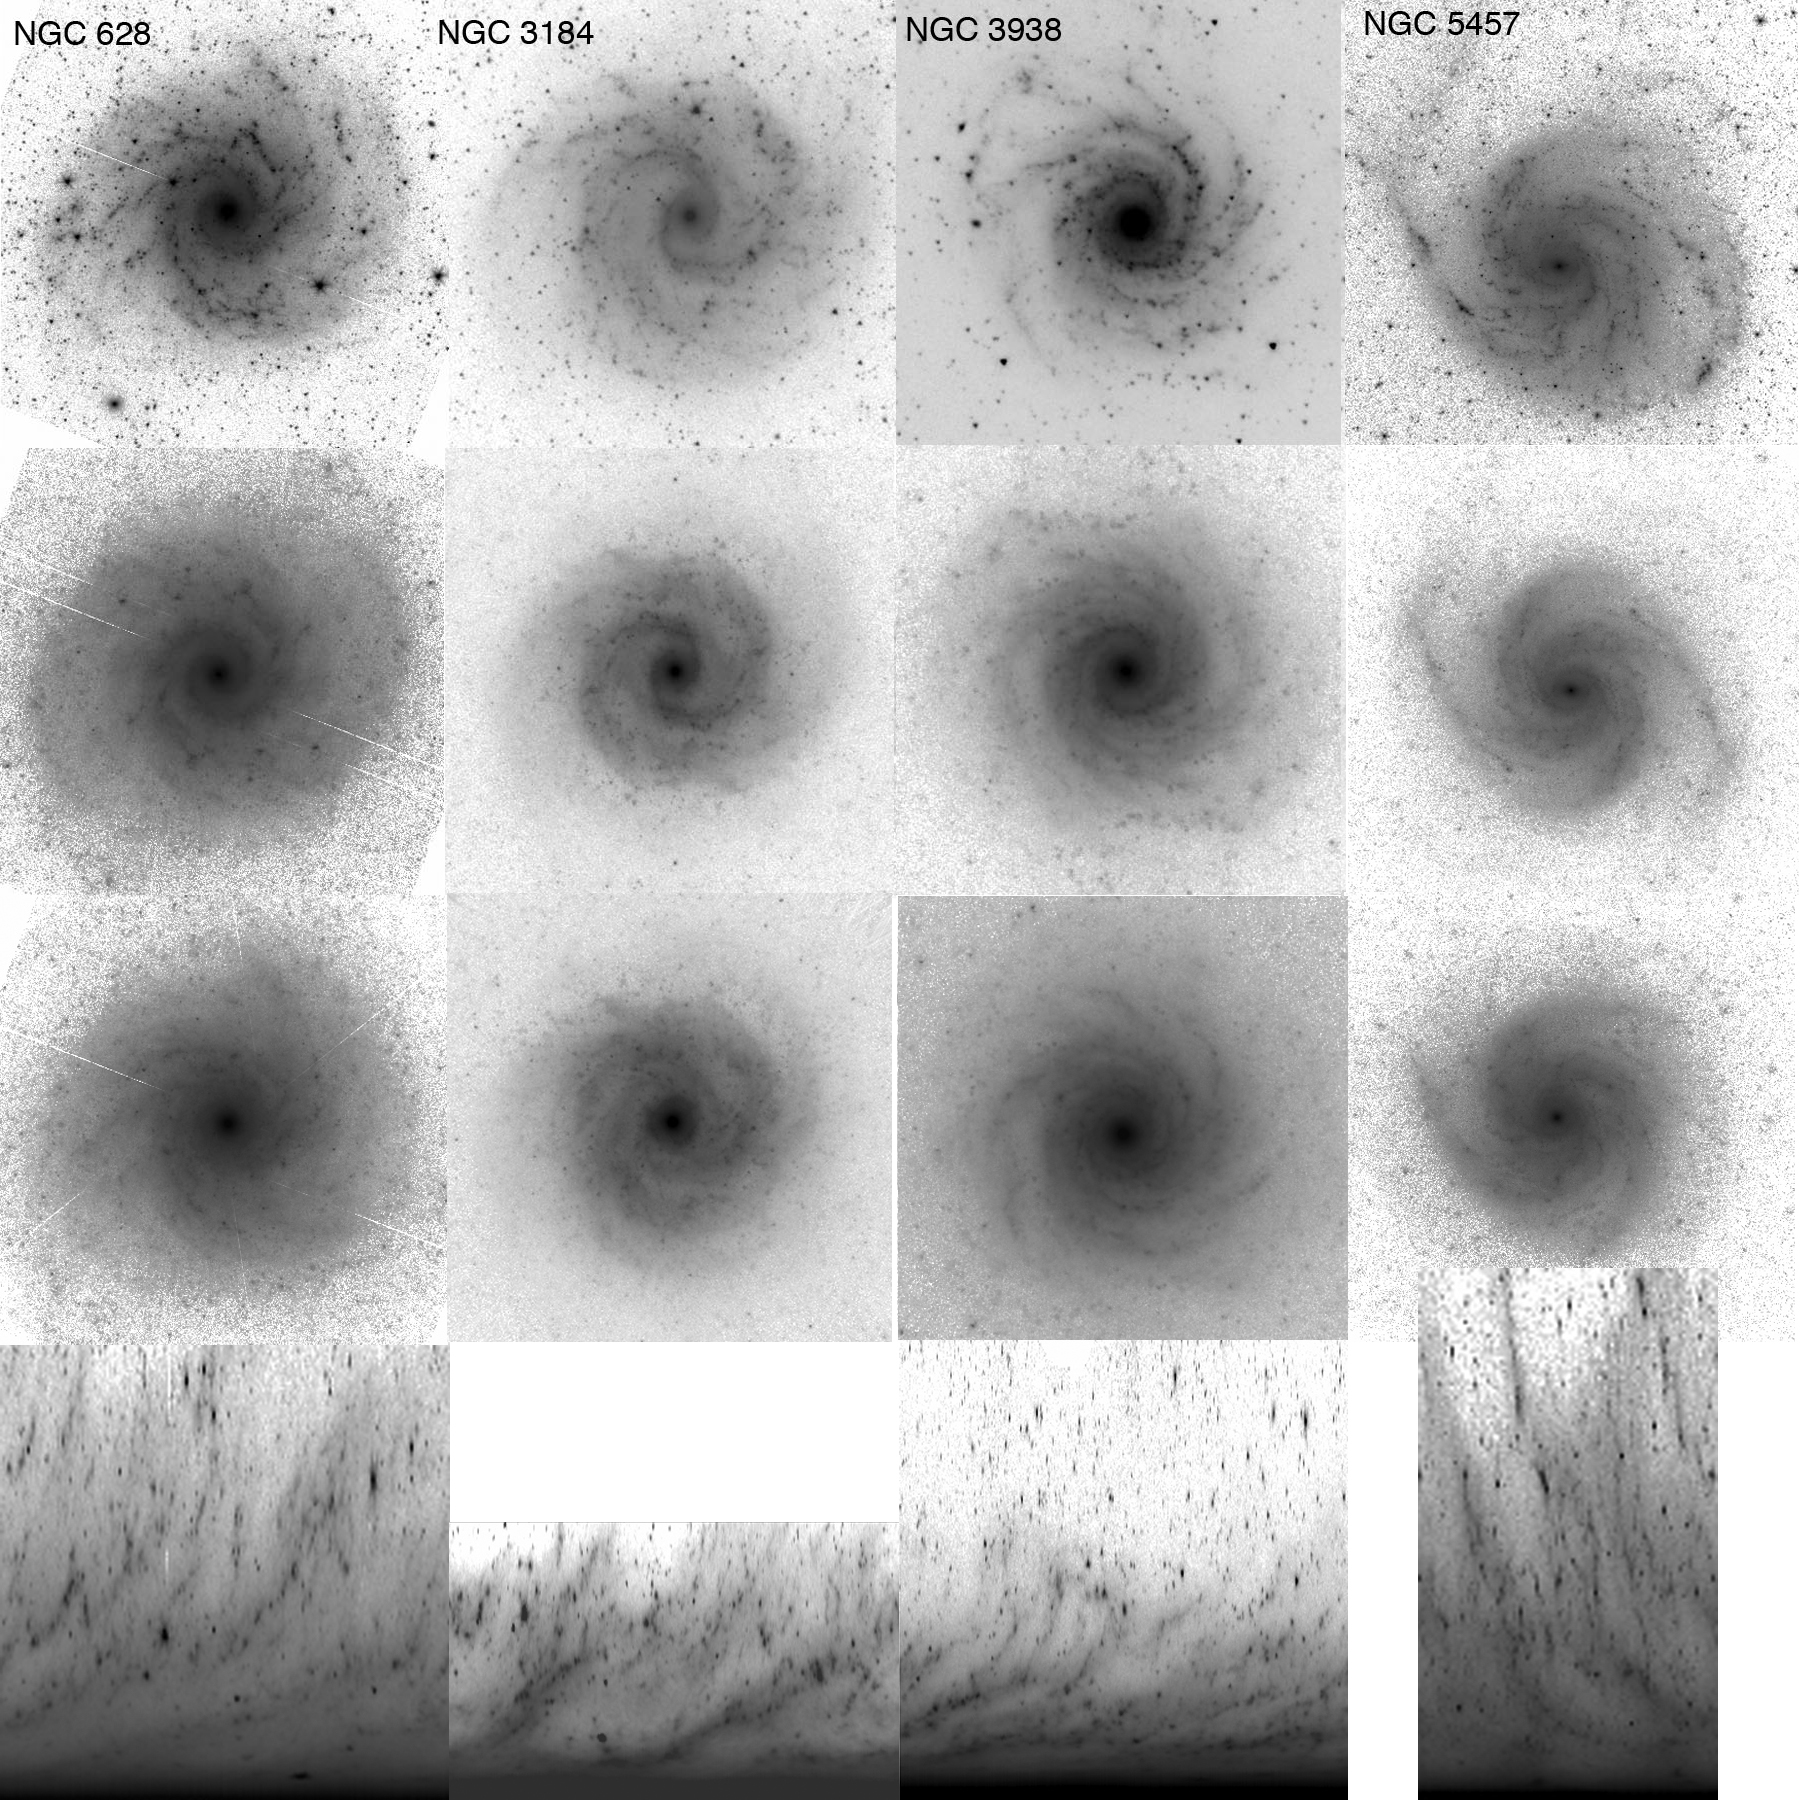
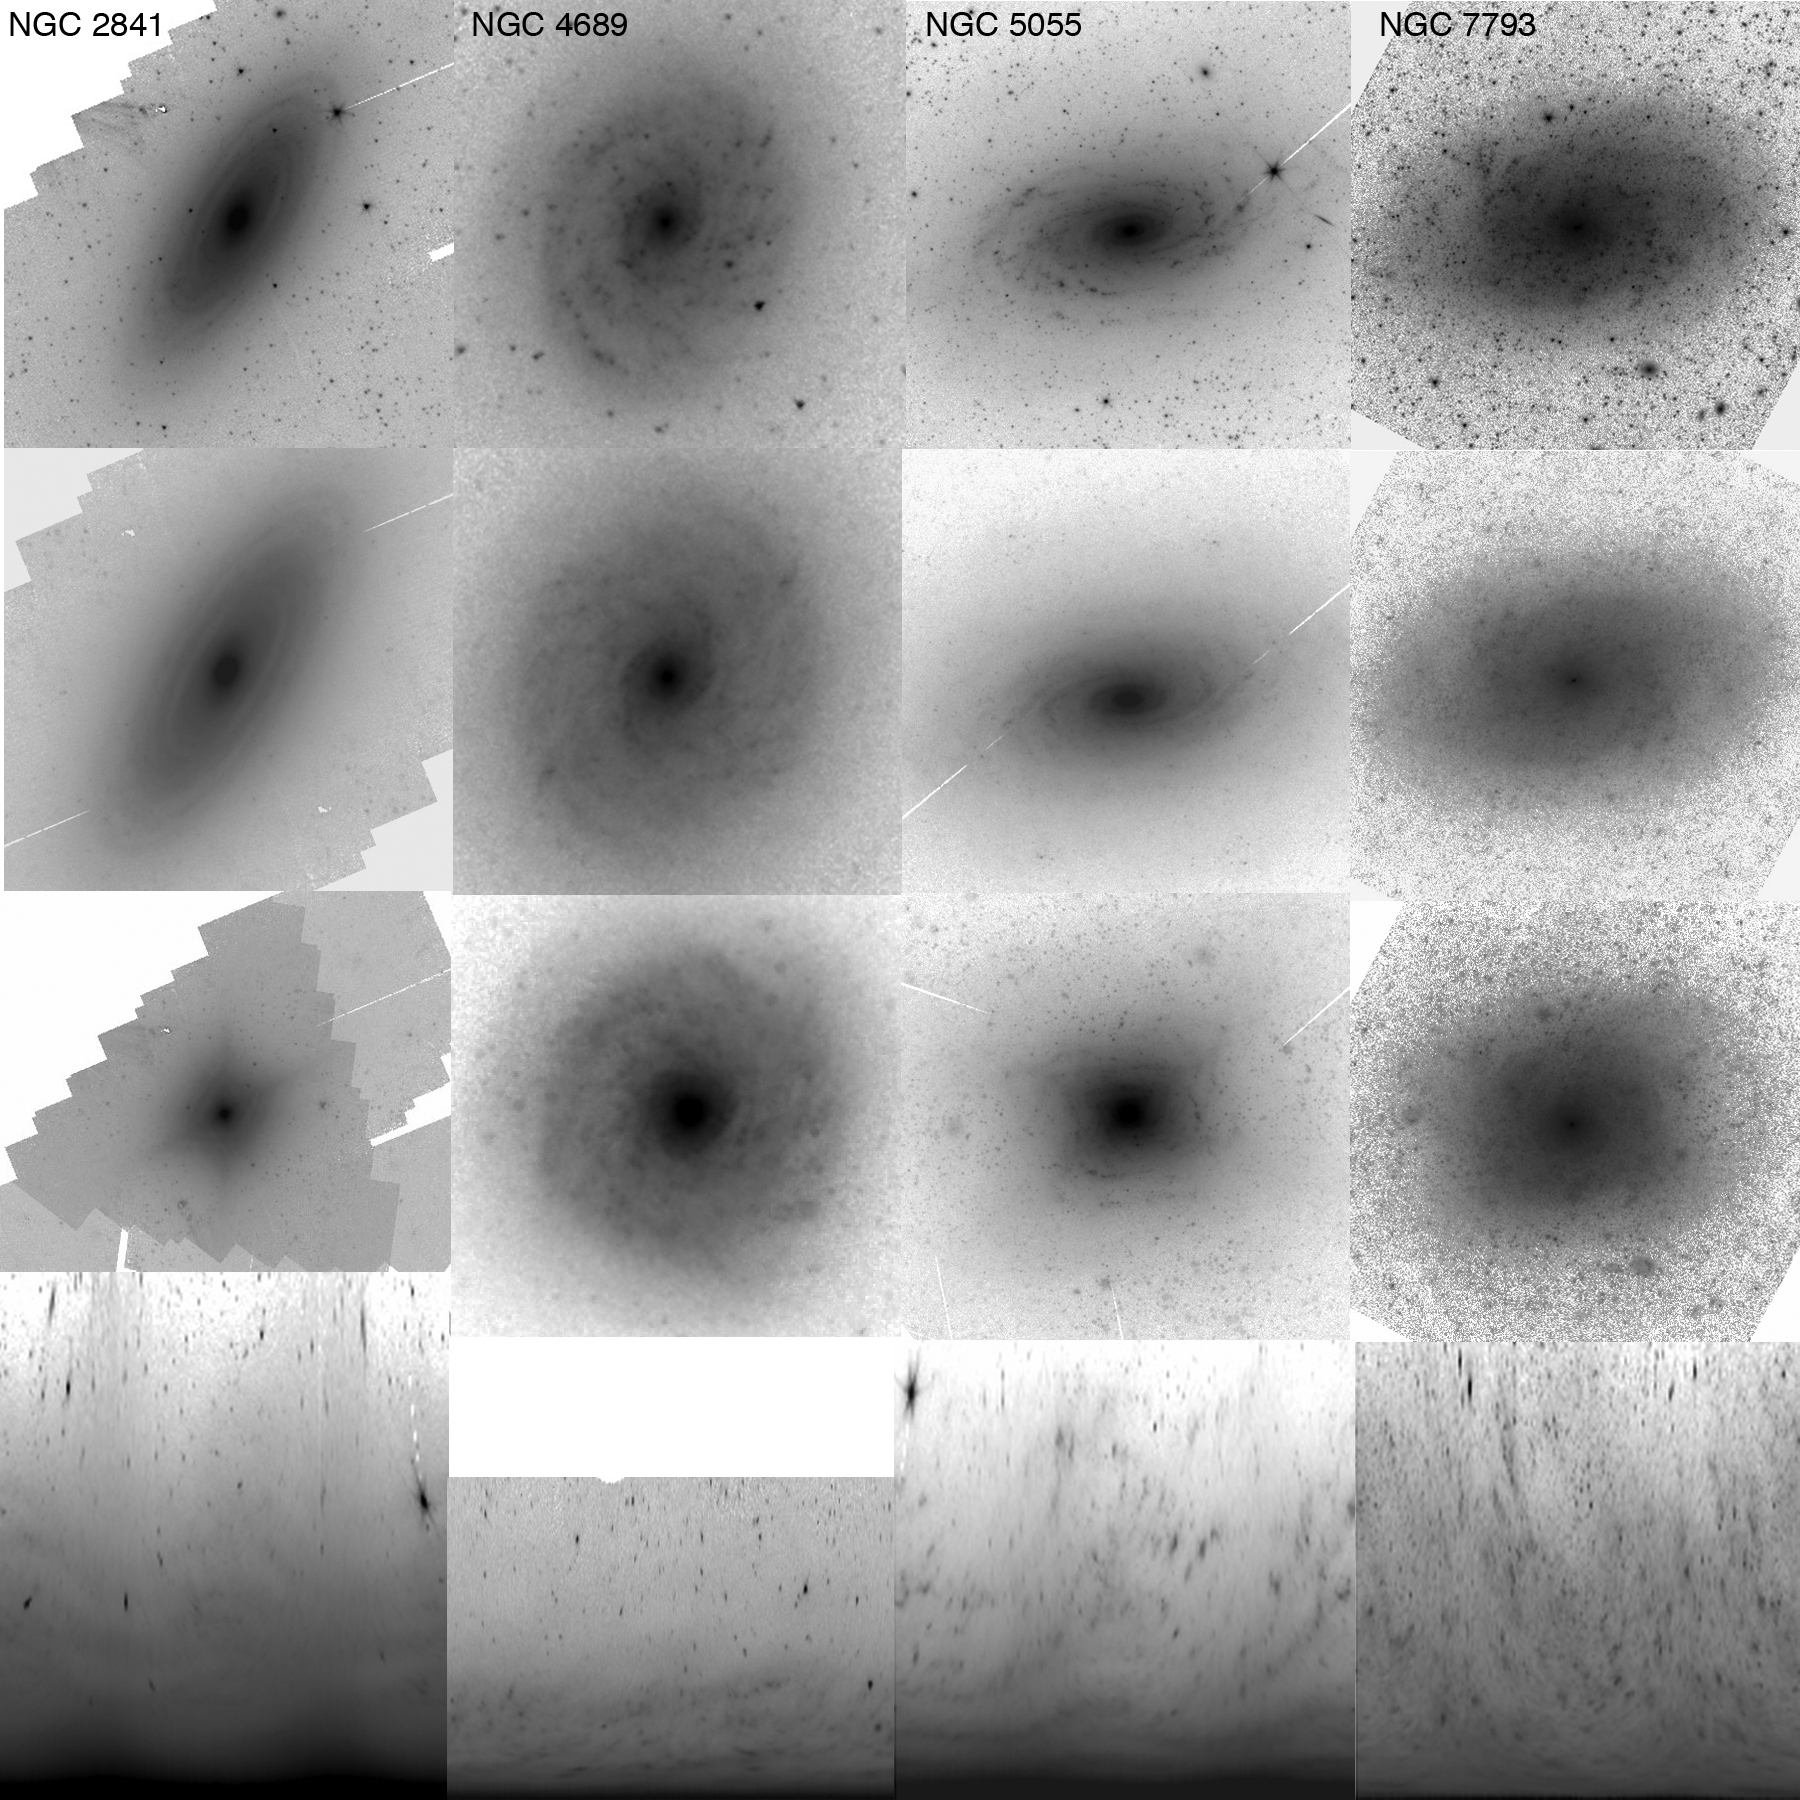
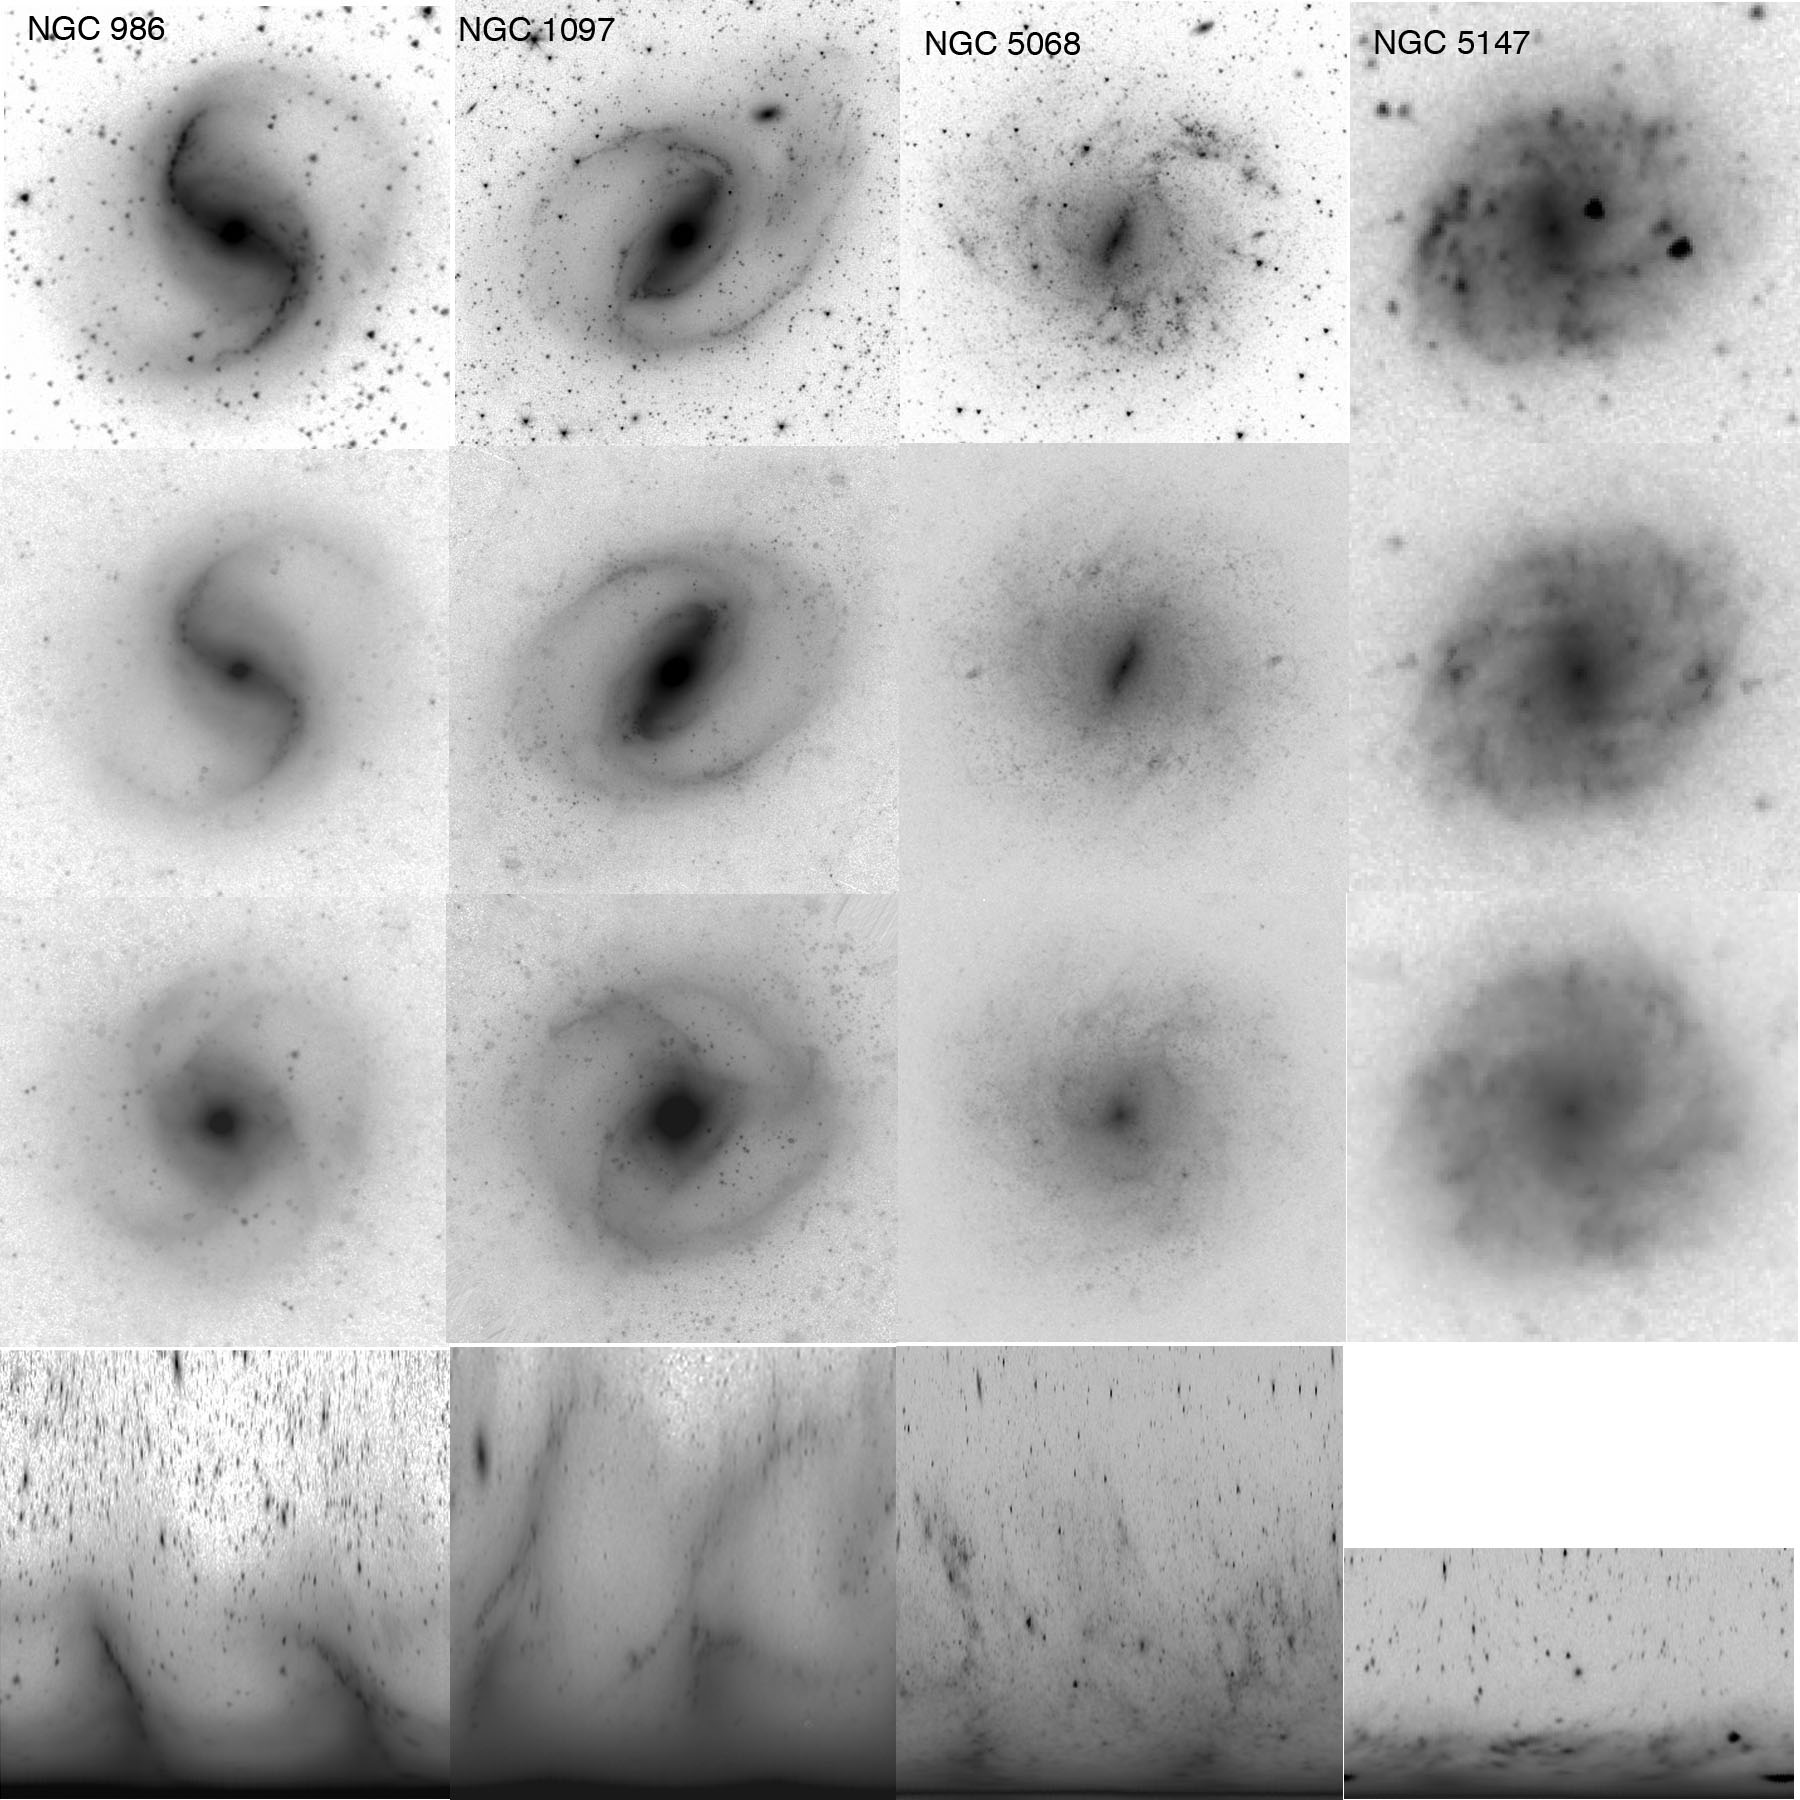
Grand design, multiple arm, and flocculent types in the SA and SAB category are illustrated in Figures 1, 2, and 3, respectively; SB galaxies with a mixture of Arm Classes are in Figure 4. In each figure, the top row shows the m images displayed on a logarithmic intensity scale. The second and third rows have 2-fold and 3-fold symmetric parts enhanced (Sect. 4.1), and the bottom row has the image reprojected in polar coordinates (Sect. 4.2).
4 Data Reduction and Analysis
4.1 Spiral Symmetry
In order to highlight disk symmetry, each image was rotated using the IRAF task , and subtracted from the original using to get the asymmetric part. Negative values were set equal to 0 in the asymmetric images, using the IRAF task , and this truncated image was then subtracted from the original to get the symmetric part (Elmegreen, Elmegreen & Montenegro, 1992, hereafter EEM):
| (1) |
Here, is the original image, is the symmetric image, and stands for truncation. Sample 2-fold symmetric images are shown in the second row of Figures 1–4. The grand design symmetric images look like cleaned-up images of the originals, with prominent 2-arm structure. It is difficult to remove stars globally from channel 1 images without also removing star-forming regions. These symmetric images eliminate virtually all the stars and most of the star-forming regions – all but those that happen to be symmetric in the galaxy. Typically 80-85% of the light in these images is in the image and 15-20% is in the asymmetric image; most of this symmetric light is from the azimuthally averaged disk, unrelated to spirals.
Three-arm structure can be highlighted by following a similar procedure but rotating twice (EEM):
| (2) |
The results are shown in the third row of Figures 1–4. The most prominent 3-arm structures appear in multiple arm galaxies. In contrast, grand design galaxies are dominated by two arms. For the flocculent galaxies, which do not have a dominant symmetric component, the images resemble the images and both show a lot of arms.
Most of our galaxies have the same spiral Arm Class at all passbands. The optically flocculent galaxies are also flocculent in m because of patches from PAH emission and young supergiants. The exceptions in our sample are the flocculents NGC 5055 and NGC 2841 (Fig. 3), which have long and smooth spiral arms at m. These arms were discovered by Thornley (1996) in -band and also shown by Buta et al. (2010) and Buta (2011). The long-arm spiral in NGC 2841 is predominantly seen as a dust arm. NGC 7793 may have a subtle 2-arm component as well, which shows up weakly in the symmetric image.
To consider a broader sample of underlying long-arm structure in flocculent galaxies, we examined 2MASS images of 197 galaxies catalogued as optically flocculent by Elmegreen & Elmegreen (1987). We find that only % have underlying weak 2-arm structure in the near-IR 2MASS images; most are still dominated by flocculent structure.
4.2 Arm-Interarm Contrasts
One measure of spiral arm amplitudes is a comparison of arm and interarm surface brightnesses, which were measured on azimuthal scans of deprojected images with sky subtracted. The position angles and inclinations used for this are in Table LABEL:table1. Position angles were measured from contours of the m images; if the outer and inner disks had different orientations, then the position angle was selected to be appropriate for the disk in the vicinity of the main arms. The values we used are generally within a few degrees of those listed in the RC3 or Hyperleda111http://leda.univ-lyon1.fr/. Slight differences like these changed the derived arm amplitudes by less than , because most of the galaxies in our sample have relatively low inclination. Gadotti et al. (2007) discuss general errors for measurements that depend on inclination, pitch angle, and the assumption of circular disks.
Each galaxy image was transformed into polar coordinates, , as shown in the lower panels of Figures 1–4. The y-axis is linear steps of radius, while the x-axis is the azimuthal angle from 0 to 360∘. From this polar image, was used to make 1-pixel-wide azimuthal cuts for radii in steps of 0.05 (the values we used for , from RC3, are listed in Table LABEL:table1).
Spiral arms were measured from the azimuthal scans, often out to , which is further than in previous near-IR studies because of the greater sensitivity of the S4G survey. Star-forming spikes and foreground stars were obvious on the azimuthal scans and avoided in the arm measurements. This avoidance of point sources gives the arm-interarm contrast an advantage over Fourier transform measurements in uncleaned images.
The arm-interarm intensity contrast at radius was converted to a magnitude using the equation
| (3) |
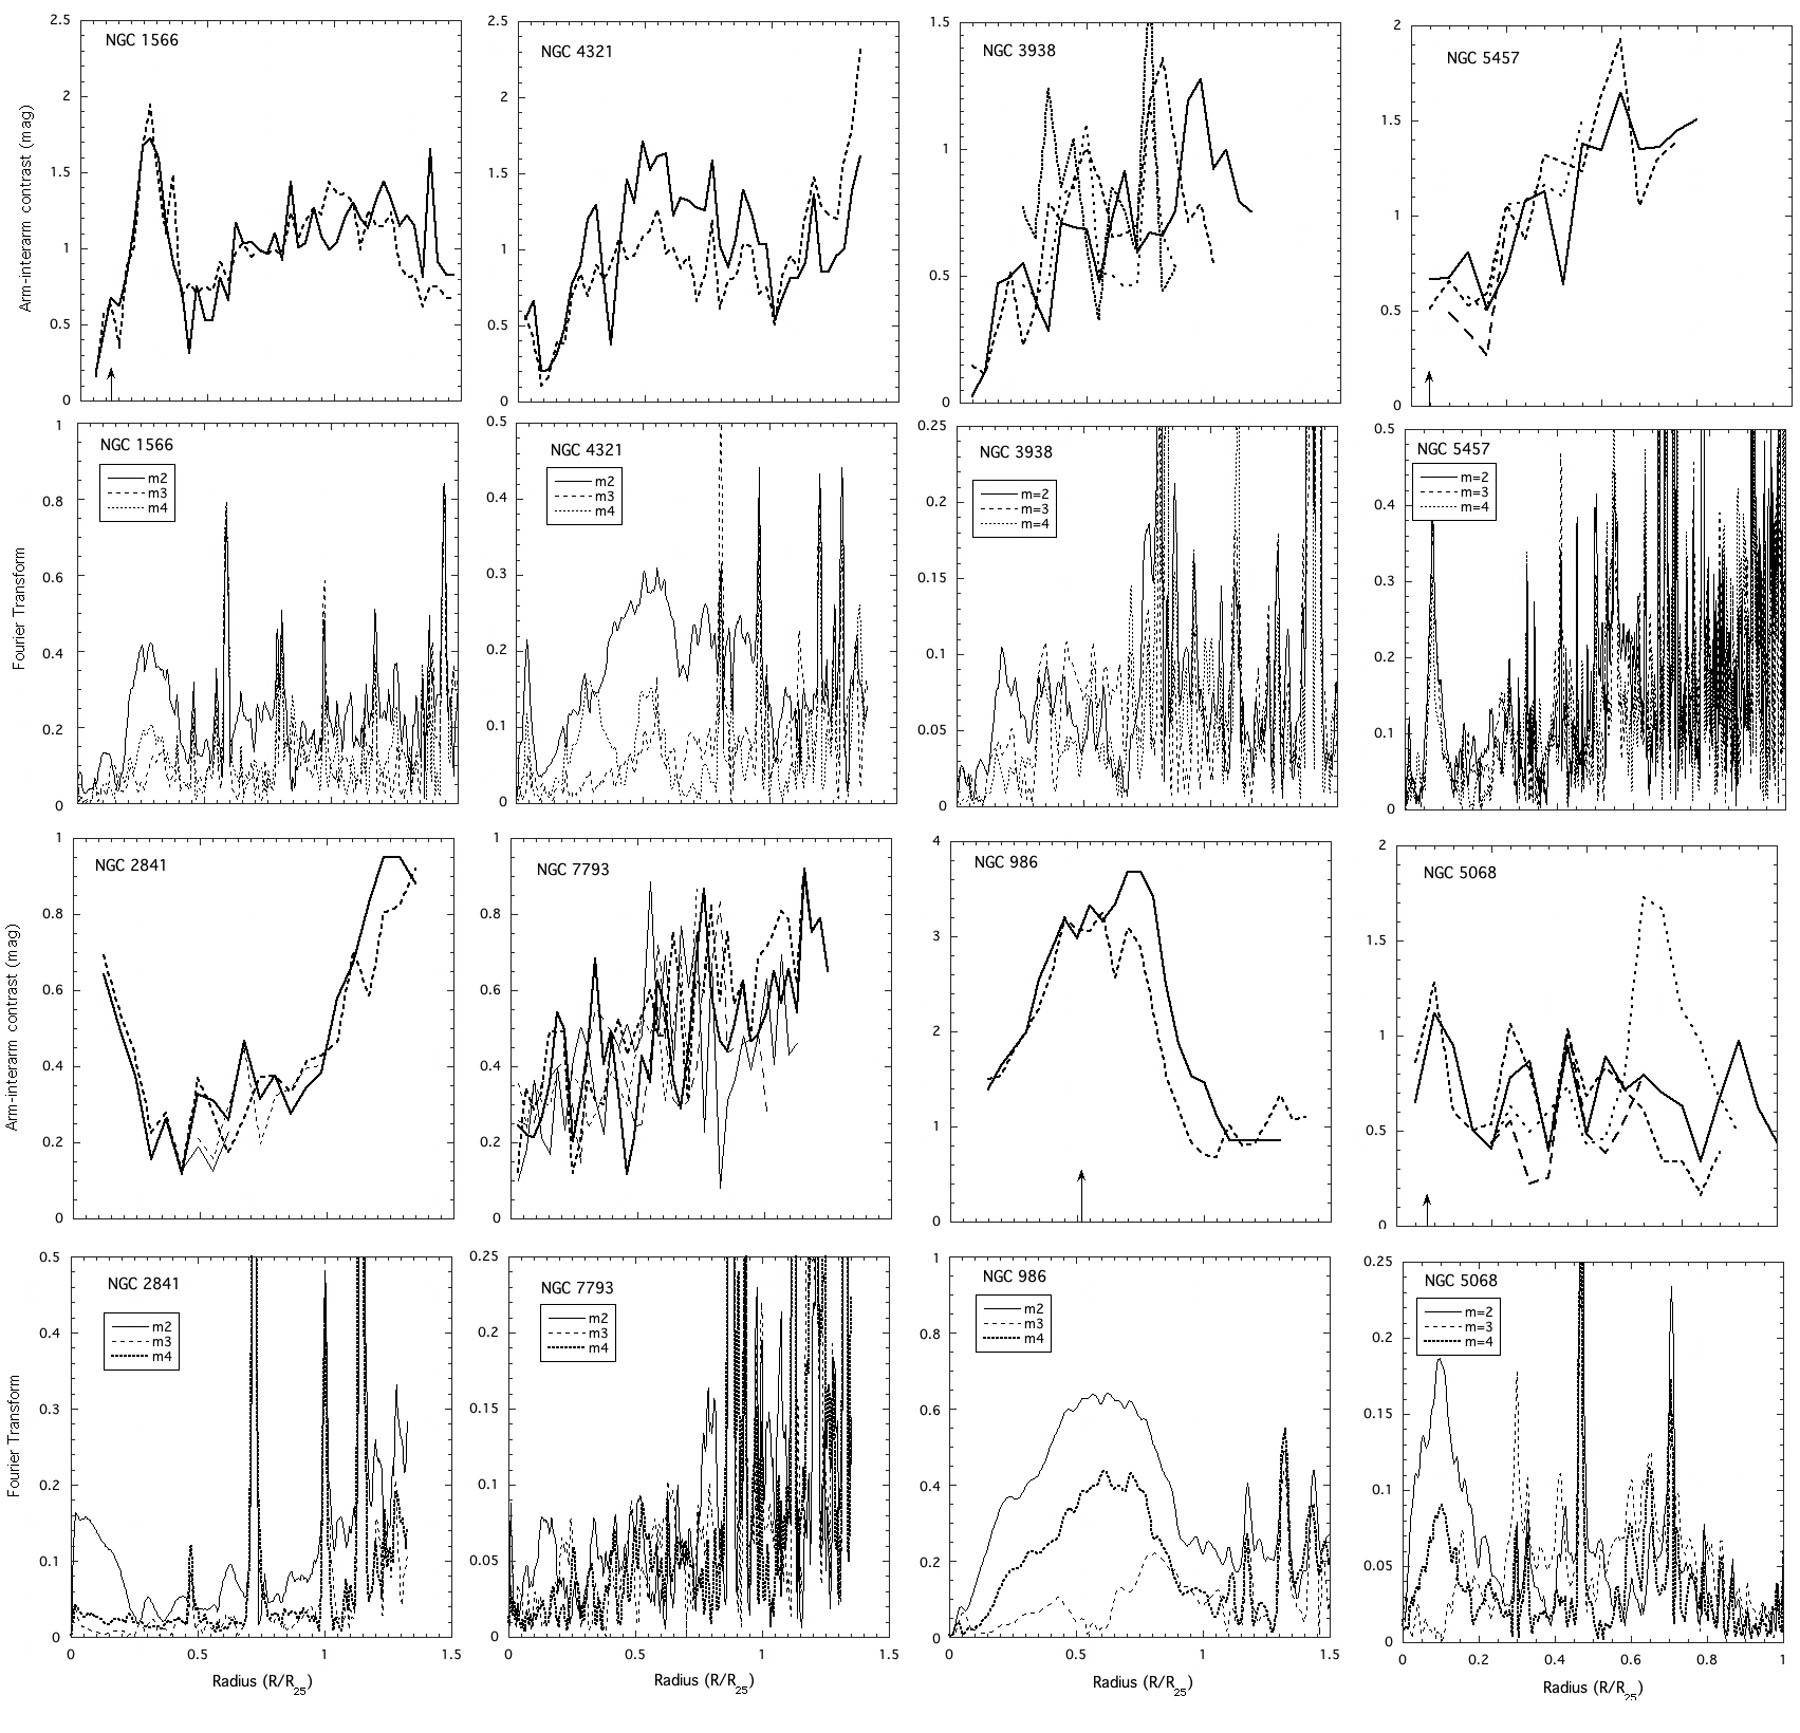
is the average arm intensity measured at the peak of the broad component, and the denominator contains the adjacent interarm regions. Figure 5 shows in the top row and in the third row from the top. Two galaxies from each of Figures 1–4 are included. The average arm-interarm contrast for each galaxy, averaged over the whole disk (beyond the bar, if there is one), is listed in Table LABEL:table2; the errors are 0.1 mag.
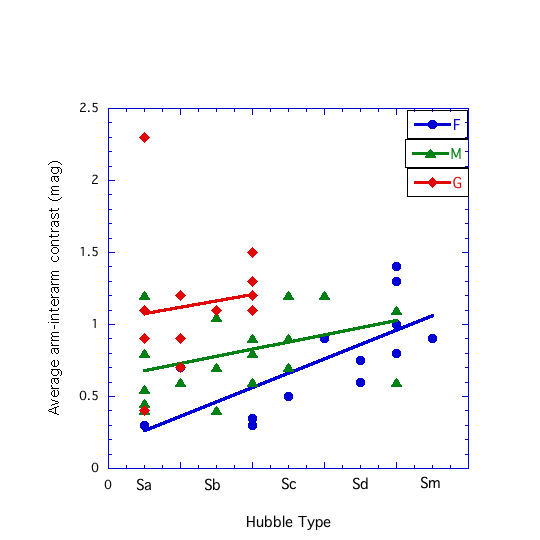
The average arm-interarm contrast in the disk versus Hubble type is shown in Figure 6. Different Arm Classes have different symbols. For a given Hubble type, the average arm-interarm contrast decreases from grand design galaxies to multiple arm to flocculent. This is consistent with the more prominent appearance of arms in grand design spirals. The averages for all Hubble types combined are , , and in these three Arm Classes, respectively. Within a given Arm Class, the arm-interarm contrast increases slightly for later Hubble types, probably because of more star formation contributing to the arms; the later type galaxies in our sample are all flocculent or multiple arm.
Sixteen galaxies in our sample were previously measured in optical and near-IR bands. The arm-interarm contrasts at 3.6m, and for some of them at 4.5, are listed for the same radius as the optical and near-IR results for these galaxies in Table LABEL:table3. The contrasts are qualitatively similar between optical, near-IR, and mid-IR bands; the average arm-interarm contrasts are 0.930.32, 0.810.49, and 0.990.46 mag for , , and m, respectively, for all galaxies. For multiple arm and grand design galaxies, the averages are 1.040.28, 0.990.46, and 1.170.38, which are all the same to within the errors. The basic reason these spiral arm amplitudes are nearly independent of color is that the arms are intrinsically strong mass perturbations; color variations are relatively minor.
For flocculent galaxies, the contrasts are smaller than the multiple arm and grand design galaxies and significantly larger in the blue than at longer wavelengths: 0.630.24, 0.340.18, and 0.440.13 for for , , and m, respectively. This decrease in amplitude from to band is most likely the result of a young age for these spiral arm features. They appear to be star formation superposed on a somewhat uniform old stellar disk. The slight increase from band to m could result from PAH emission and red supergiants in the m band. We attempted to avoid small regions of emission in our measurements at m, so if there is contamination from PAHs, it would have to be somewhat extended. Meidt et al. (2011) are exploring techniques to remove PAH and point source emission from the m images to produce mass maps.
Another explanation for decreasing arm-interarm contrast with increasing wavelength in flocculents might be an excess of gas and dust between the arms. The dust would depress the interarm brightness for the band but not for m. While it is more likely that the gas and dust are associated with star formation, which is what we see as flocculent arms, it is still possible that shells and other debris around the star formation site darken the interarm regions at short wavelengths.
4.3 Fourier Transforms
Fourier transforms are an independent method for measuring arm amplitudes besides arm-interarm contrasts, so Fourier components of azimuthal intensity profiles on the m images were also measured. For number of arms , 3 and 4, the Fourier transform was determined from the equation
| (4) |
is the intensity at azimuthal angle and radius in the deprojected, sky-subtracted image. All sums are over azimuthal angles with steps of 1 pixel. Note that according to this definition, the relative amplitude of a spiral arm is twice the value of the Fourier component. For example, a spiral arm with an amplitude profile has a Fourier -component from equation 4 equal to .
Figure 5 shows Fourier components in the second and fourth rows, below the corresponding arm-interarm contrasts. (Fourier transforms on the m images were indistinguishable from those at m and are not considered further here). The Fourier transforms were done on images that were cleaned to remove most foreground stars; masks for this process are part of Pipeline IV in the S4G data reduction. Some scans (such as NGC 5457) still contained some foreground stars, and the Fourier components of these stand out as narrow spikes. The star peaks are avoided in the average values used in the discussion below.
Table LABEL:table2 lists the average values of the components. Uncertainties in the m=2 components range from to 0.10 in different galaxies. The components are about half the components in all cases. The ratio of the component to the is largest for the flocculent galaxies, as expected for galaxies with irregular structure and lots of arm pieces. Grand design galaxies are dominated by two main arms, so their component is weaker. The average values of / are , , and for flocculent, multiple arm, and grand design galaxies, respectively.
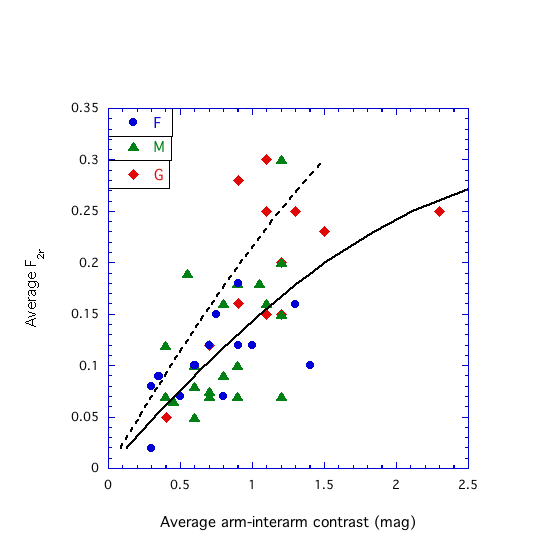
In Figure 7, the average value of the Fourier component in the spiral region is compared with the average arm-interarm contrast. The two measures of arm amplitude are obviously related. The curves in the figure show the expected trends in two cases: the dashed line follows if the arm-interarm contrast is given exclusively by the amplitude of the Fourier component, and the solid line follows if the arm-interarm contrast comes from the combined and components. If only the component contributes, then . If the component contributes half the 2-arm amplitude of the component as found above, then . In the figure, the curves are . The solid line traces the data points reasonably well, but neither line is a good fit in a statistical sense because the scatter in the data is large (the reduced chi-squared values comparing the lines with the data are 0.69 for the solid line and 2.25 for the dashed line, with -values of 0.588 and 0.629, respectively).
Other studies have also measured peak Fourier amplitudes. For comparison, Laurikainen et al. (2004) has 8 galaxies in common with ours from the OSUBSGS; their -band images yield amplitudes that are similar to the m values, taking the factor of two (mentioned above) into account to compare our values with their amplitudes.
4.4 Spiral Arm Modulations in Radius
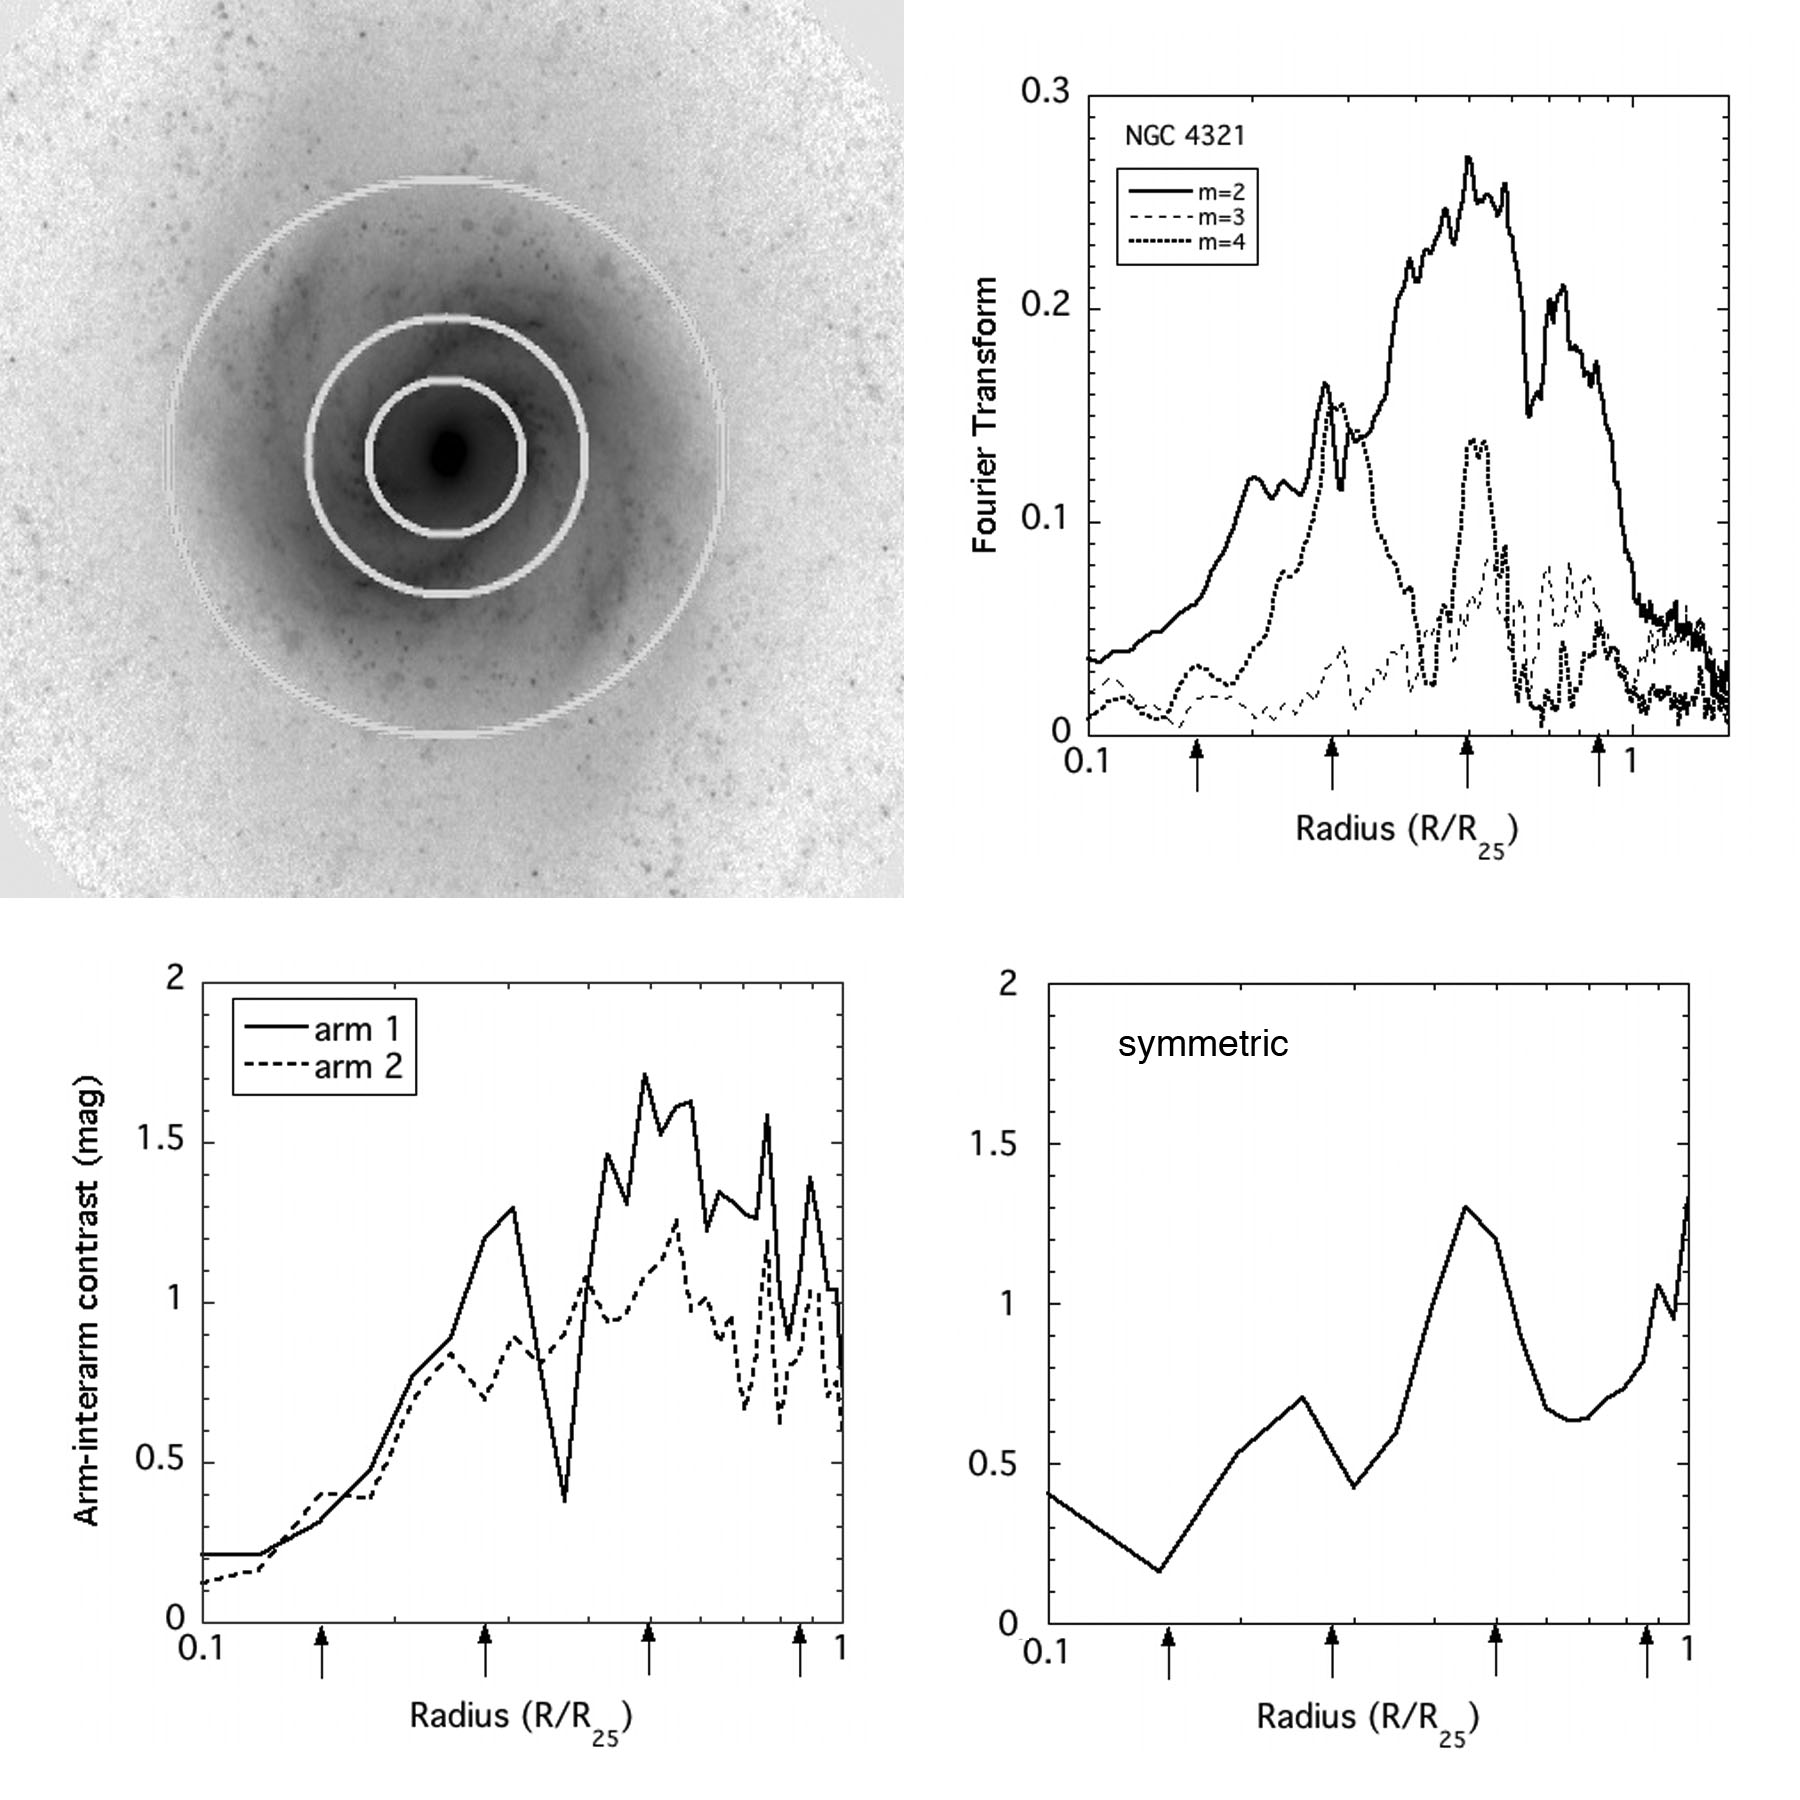
In previous optical studies of symmetry images (Elmegreen, Seiden, & Elmegreen, 1989; Elmegreen, Elmegreen & Montenegro, 1992), we saw large-scale amplitude modulations in spiral arms that looked like interference between inward and outward moving waves in a spiral wave mode (Bertin et al., 1989). Evidence for these can be seen in the mid-IR symmetric image of NGC 4321 in Figure 1. The symmetric image of NGC 4321 is shown deprojected with circles in Figure 8, along with arm-interarm contrast measurements and Fourier transform measurements discussed in the previous sections, now plotted with radius on a logarithmic scale. Referring to the top left panel of Figure 8, the parts of the arms at the ends of the central oval (inner circle, at ) are more prominent than the parts along the oval minor axis. Further out in radius the arms get brighter again (middle circle, at ); then there is another gap and another brightening near the ends of the arms. The outer circle in the figure is at . These bright regions trace the prominent trailing arms which should have an inward group velocity (Toomre, 1969). If there are also leading spirals from a reflection of the trailing spirals in the central parts, then the group velocity of the leading spirals would be outward. The bright regions could then be regions of constructive interference where these two waves types intersect.
The lower left panel of Figure 8 shows the arm-interarm contrast for each arm as in Figure 1. The arrows at the bottom are the radii for the arm maxima found before in and -band images (Elmegreen, Seiden, & Elmegreen, 1989). Both arms follow an alternating pattern of brightness with a logarithmic spacing, although arm 1 is more variable than arm 2. The arm-interarm contrast profile from the deprojected symmetric image is shown in the lower right. A modulation with the same log spacing is present. The two inner circles in the top left panel are at the radii of the two peaks in the lower right panel. The strength of the arm modulation in the symmetric image is 50%-100%. Fourier transform amplitudes are shown in the top right panel. The amplitude variations are most pronounced for the Fourier component, but they also show up in the component.
Close inspection of the m image shows that the inner peak amplitude at is at the end of the inner oval, in a broad region of bright star formation. The next peak at is the broad ridge of star formation in the main spiral arm, presumably from density wave compression in a shock. The outer peak in the arms is another star formation feature. Because of the mixture of old stars, PAH emission, and AGB stars in the m image, it is difficult to tell if these peaks are present in the old stellar component. At the very least, it appears that the amplitude modulations found here are the locations of extended star formation regions. Perhaps such star formation highlights an underlying wave interference or resonance pattern (Knapen et al., 1992).
4.5 Outer Spiral Arms
Non-SB grand design galaxies in our sample often show distinct broad outer spirals beyond and separate from the main inner bright spirals. The inner spirals, as in NGC 1566 (Fig. 1), are associated with bright star formation and dustlanes that are probably spiral shocks (e.g., Roberts 1969). Beyond that there are sometimes separate arms that are smoother and without concentrated star formation. In NGC 1566, the outer arms begin on each side of the galaxy at , and extend at least as far as the edge of the image at , forming a pseudo-ring. Also in NGC 1566, there is a ridge of star formation disjoint from and leading the main outer spiral in the south. This ridge is described as a “plume” by Buta et al. (2007). Plumes usually occur in barred galaxies where they appear as short disjoint arms of enhanced emission at the ends of bars in the leading direction (Buta, 1984; Buta, Purcell, & Crocker, 1995).
Other non-SB grand design galaxies in our survey have disjoint smooth outer arms too (Fig. 1). NGC 4321 has two strong inner arms with considerable symmetry, and outside of these starting at about is a pair of spirals at higher pitch angle. The outer arms are clear in the top image of NGC 4321 in Figure 1. On the left of the image there is a branch from the inner spiral to the outer spiral, which continues toward the companion galaxy NGC 4322. Just as in NGC 1566, these outer arms are broader and smoother than the inner arms, they contain little concentrated star formation, and they extend far out in the image.
NGC 5194 has an interacting companion galaxy that could have modified any outer spirals, so we do not consider it in this context here. Still, Tully (1974) and others noted that the spiral arms in M51 have a kink in the middle and seem to be composed of two separate arm systems. We see that kink also at the 7 o’clock position of the bright outer arm in Figure 1. Dobbs et al. (2010) reproduced the kink in a companion-interaction model of M51, and noted that it arose at the intersection of an old, inner spiral pattern, generated by the first fly-by of the companion, and a new, outer spiral pattern generated by the second fly-by.
NGC 5248 in Figure 1 has strong and symmetric inner arms and faint, broad, and disjoint outer arms. The outer arms were also present in a deep -band image in Jogee et al. (2002) and they were first described by Burbidge, Burbidge, & Prendergast (1962) in a deep -band image. In the northwest, there is a second ridge or short arm that is disjoint from the main outer arm, as in the southern plume of NGC 1566.
The grand design SB galaxies in Figure 4 do not have disjoint outer arms. Instead, the inner arms continue smoothly to the outer galaxy. There is also no obvious counterpart to smooth disjoint outer arms in the multiple arm galaxies of Figure 2. Multiple arm galaxies generally have an inner 2-arm symmetry, as seen in the figure, and narrow, irregular and asymmetric arms with star formation all the way to the edge of the image.
Presumably the outer arms in non-SB grand design galaxies are stellar features that are excited by the inner arms or inner oval. There is no evidence from physical connections with the inner arms that the outer arms have the same pattern speed. The outer arms, if they are density waves, should extend only to their own outer Lindblad resonance (OLR). For a flat rotation curve, the OLR is at 1.707 times the corotation radius. Considering the Fourier transforms in Figure 5, the dip at could be corotation, because this is also where the bright star formation ridge ends. If the pattern speed for the inner and outer arms were the same, then the OLR would be at . This is in the middle of the outer arm, and so impossible for a standard spiral density wave. Alternatively, if corotation were at the outer edge of the second peak in the Fourier transform, at , then the OLR would be at for a flat rotation curve. This is close to the outer edge of the third peak in the Fourier transform and the end of the outer spiral. This is an acceptable fit, but it implies the unconventional interpretation that corotation is well beyond the end of the star formation ridge.
A second possibility is that the outer arms are driven by manifolds emanating from the Lagrangian points at the ends an inner oval disk. The viewing angles we used to rectify the image were chosen to force the disk to be circular. Different values are found from kinematics. Pence, Taylor & Atherton (1990) found a position angle of degrees and an inclination of degrees from their H Fabry-Perot data. Deprojecting with these viewing angles, we find that the inner part stays oval and thus manifold-driven spirals are an alternative. These can extend well beyond the OLR. Also, the shape of the arms with the kinematic deprojection is in agreement with a permissible manifold shape (see e.g. Figures 4 to 6 of Athanassoula et al. 2009a and Sect. 4.3 of Athanassoula et al. 2009b). Multiple arm or flocculent galaxies would not have smooth outer arms in the manifold interpretation because they would not create the strong perturbations required.
A third possibility is that the outer spiral is a resonance response to the inner spiral at a different pattern speed (Sellwood, 1985; Tagger et al., 1987). For example, the OLR of the inner spiral could be the source of excitation at corotation for the outer spiral. For inner spiral corotation at the edge of the star formation ridge in NGC 1566, at , and an OLR of the inner spiral and corotation of the outer spiral at (in agreement with OLR found by Elmegreen & Elmegreen 1990) for a flat rotation curve, then the OLR of the outer spiral would be at . This is also an acceptable fit because that is about the radius where the outer spiral ends.
In NGC 4321, the ridge of star formation in the south ends at about in the north and beyond that there is a second arm with a small pitch angle extending to the north until . A similar ridge and second arm is on the other side of the galaxy. These features make the two peaks in the Fourier transform plot of Figure 5. The second arm could lie between corotation and the OLR of the inner spiral. The outer spiral mentioned above is beyond that, from to , as shown by a broad ledge in the Fourier transform plot. As for NGC 1566, the outer spiral extends too far to end at the OLR of the inner spiral if the inner spiral has corotation at the end of a star formation ridge. The outer spiral in NGC 4321 could be a manifold or resonance phenomenon too. With corotation of the inner spiral at , and corotation of the outer spiral at the OLR of the inner spiral, at , the OLR of the outer spiral would be at for a flat rotation curve. This is about the extent of the outer spiral.
These examples suggest that smooth outer spirals observed at m in non-SB grand design galaxies are either driven by manifolds surrounding an oval inner disk, or excited by a resonance with the main inner spirals. The resonance may be one where corotation of the outer spiral is at the OLR of the inner spiral. Barred (SB) galaxies may have similar manifolds and resonance excitations but in that case most of the main spiral would be in this form (Sellwood & Sparke, 1988; Athanassoula et al., 2009a), and no additional smooth spirals would exist beyond that, unless they are higher-order excitations and too faint to see here. Multiple arm and flocculent galaxies, which do not show smooth outer spirals in this survey, could lack sufficiently strong perturbations in the inner disk to drive them.
4.6 Sharp Edges in Spiral Arms
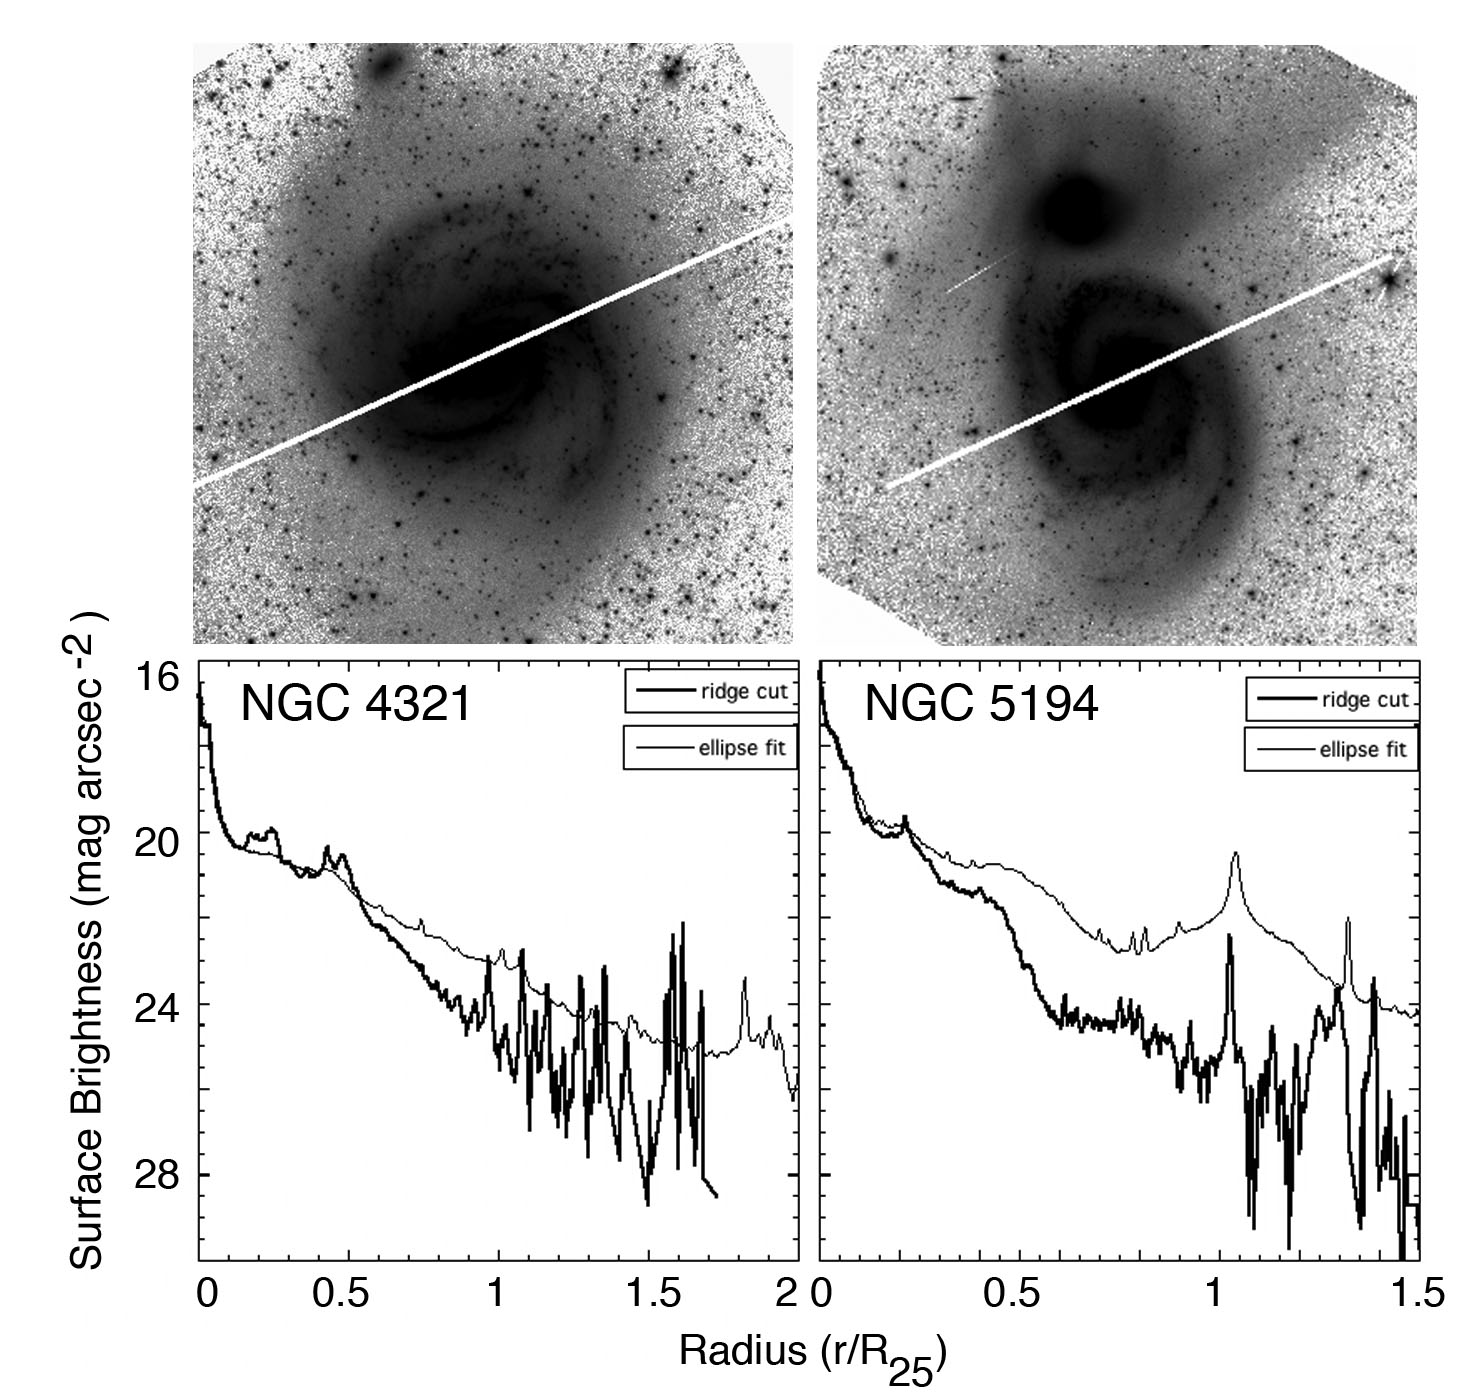
The outer southern spiral in NGC 4321 has what appears to be a sharp edge in Figure 1; that is, an abrupt transition from the outer arm to the disk or sky. The western arm in NGC 5194 and the inner arms in NGC 1566 also have sharp outer edges. These outer edges do not look as sharp on azimuthal profiles because they are stretched out by a factor equal to the inverse tangent of the pitch angle.
The intensities along strips cutting nearly perpendicular to the spiral arms and going through the galaxy centers are shown for NGC 4321 and NGC 5194 in Figure 9. The strips are 10 pixels wide to reduce noise. Sharp drop-offs occur at the outer parts of several spiral arms. In both galaxies, the arms at show a steep decline on the outer edge. Linear least-square fits to these drop-offs reveal that they have an approximately exponential profile about twice as steep as the local disk measured on ellipse-fit profiles, which averages over azimuth.
A sharp outer edge corresponds to a strong amplitude spiral superposed on an exponential disk. A typical azimuthal profile of a grand design galaxy (EE84) has a sinusoidal variation in surface brightness, which is a logarithmic intensity scale. Assume the amplitude of this variation is . Considering also the exponential disk with scale length , this spiral profile means that the intensity varies with radius and azimuthal angle approximately as
| (5) |
where is the surface brightness in units of mag arcsec-2. For a logarithmic spiral,
| (6) |
with spiral pitch angle . The inverse of the local scale length at the outer part of the arm, where the radial gradient is largest, is given by
| (7) |
The first term is from the underlying disk and the second term is from the outer part of the spiral arm. Evaluating the second term, , for these spirals, and for . Thus the second term is approximately for in magnitudes. It follows that the total gradient can be times the underlying disk gradient for a strong spiral.
Grand design spiral arms can have sharp outer edges that are comparable in scale to the epicyclic radius for stars. This is consistent with theoretical predictions that the arms are non-linear waves in which a large fraction of the stars have their epicycles in phase in spiral coordinates. Sharp edges also imply strong radial force gradients, softened by the disk thickness, which is comparable to the scale length there. Such radial forcing causes the arm amplitudes to grow by locking in more and more stars to the common epicycle pattern.
Sharp outer edges in tidally-induced arms are present in recent simulations by Oh et al. (2010). The sharp edges result from a growing accumulation of stars in a moving wave front at the galaxy edge. They are a caustic in the distribution of particle orbits (Struck-Marcell, 1990; Elmegreen et al., 1991). The sharp edge in the southwest of M51 is also in the simulation by Dobbs et al. (2010).
4.7 Barred galaxies
Our sample includes 18 SB, 18 SAB, and 10 SA galaxies. The average value of the Fourier transform for the component in the arms is weaker in non-barred galaxies than in barred galaxies; the averages are , , and for SA, SAB, and SB galaxies, respectively. Similarly, the arm-interarm contrast is weaker in non-barred galaxies, with averages , , and for SA, SAB, and SB galaxies, respectively. These results indicate that the presence of bars or ovals increases the amplitudes of the arms.
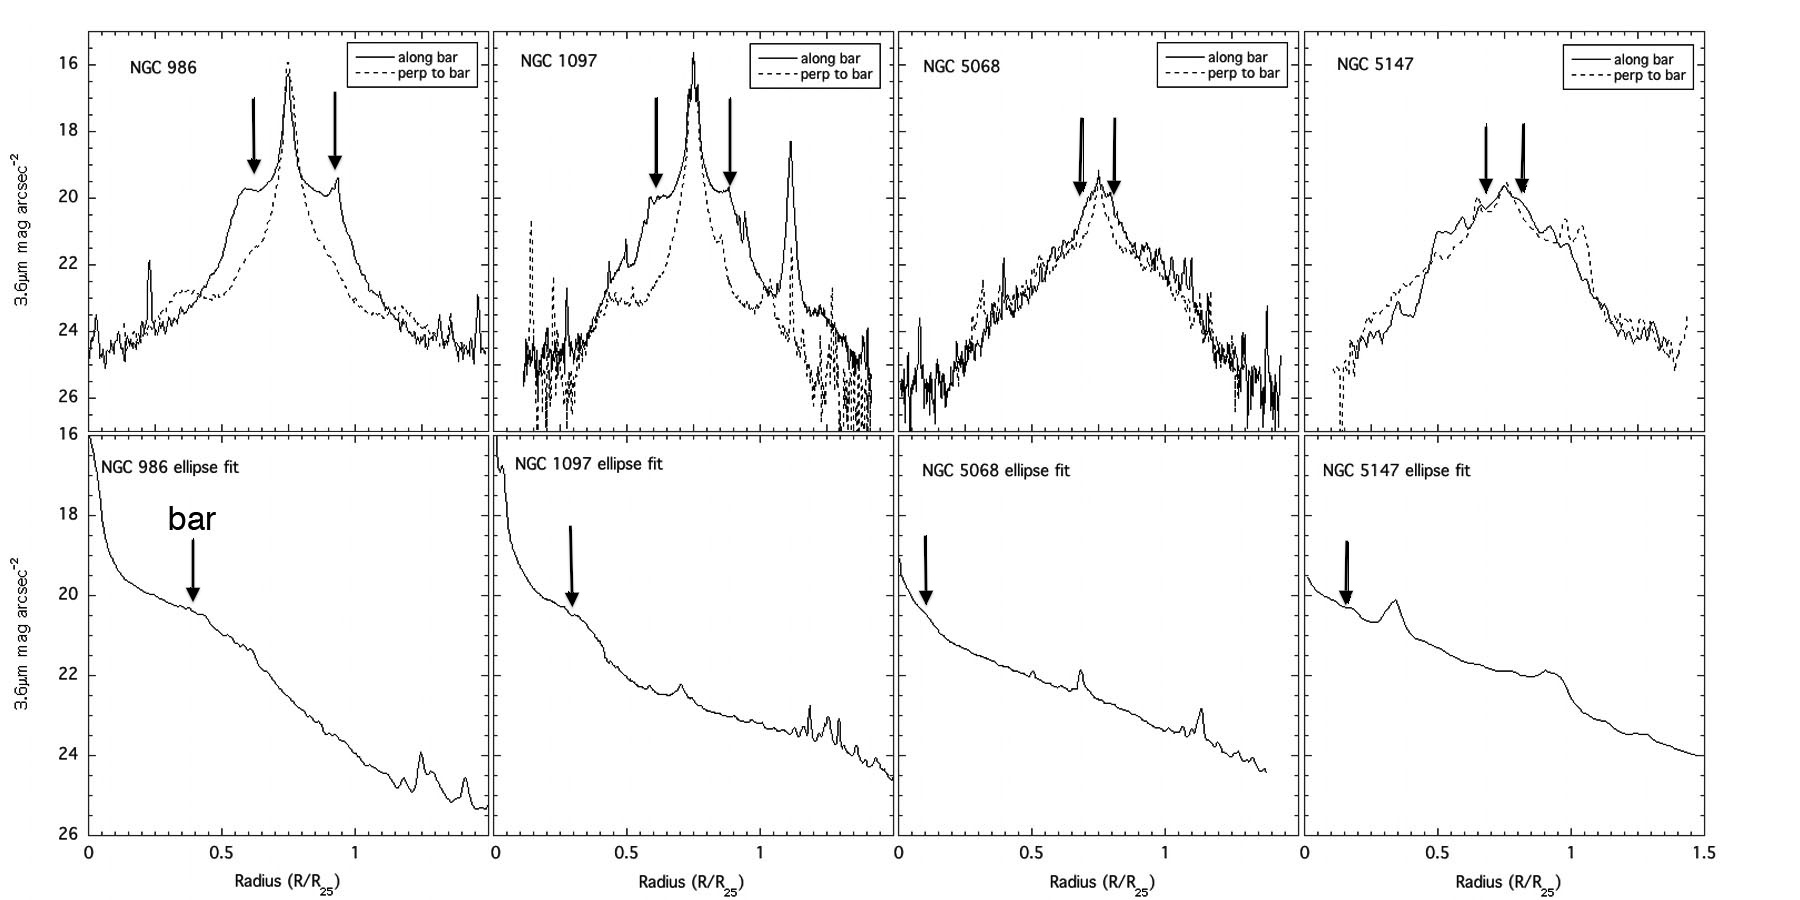
Figure 10 shows bar intensity profiles for the four galaxies in Figure 4. Two of these galaxies are grand design early types (NGC 986 and NGC 1097) and two are flocculent late types (NGC 5068 and NGC 5147). For all barred galaxies in the sample, profiles were measured along and perpendicular to the bar (shown in the top row of the figure for these 4 galaxies), and from azimuthal averages based on fits (shown in the bottom row in the figure). Image counts were converted to surface brightness using a formula in the online IRAC Instrument Handbook: (AB mag arcsec(Intensity[MJy/sr]). The figure shows a difference in the profiles for the early and late types. The bars in early type galaxies are long and their major axis profiles are flat (that is, slowly declining), as are their azimuthally averaged profiles. The late type bars are short and have an exponential decline similar to the disk, with just a small flattening on the major axis. Their azimuthal profiles hardly show the bars at all. Evidently, bars in early type galaxies reorganize the inner disk regions of their galaxies, but bars in late type galaxies do this to a much lesser extent.
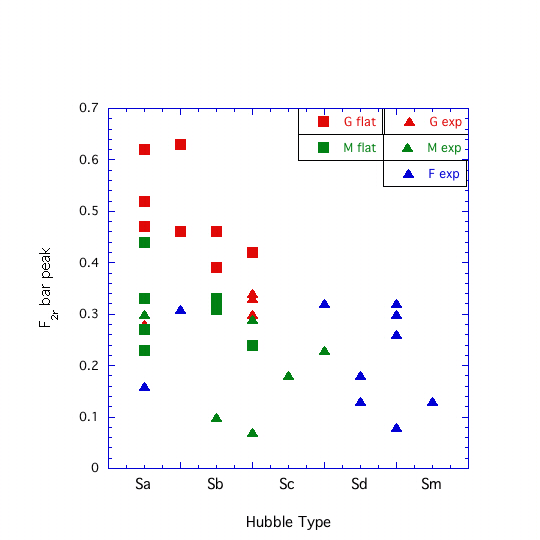
Flat or exponential bar profiles are listed in Table LABEL:table2. In our whole sample, the SB galaxies are dominated by flat bars (13 flat, 5 exponential), while the SAB galaxies have mostly exponential bars (3 flat, 15 exponential). Among the early type galaxies, SAB and SB galaxies are somewhat biased toward flat bars (15 flat, 10 exponential), while the late type galaxies are dominated by exponential bars (1 flat, 10 exponential). In our sample, all of the grand design barred galaxies have flat bars, while all of the flocculent barred galaxies have exponential bars.
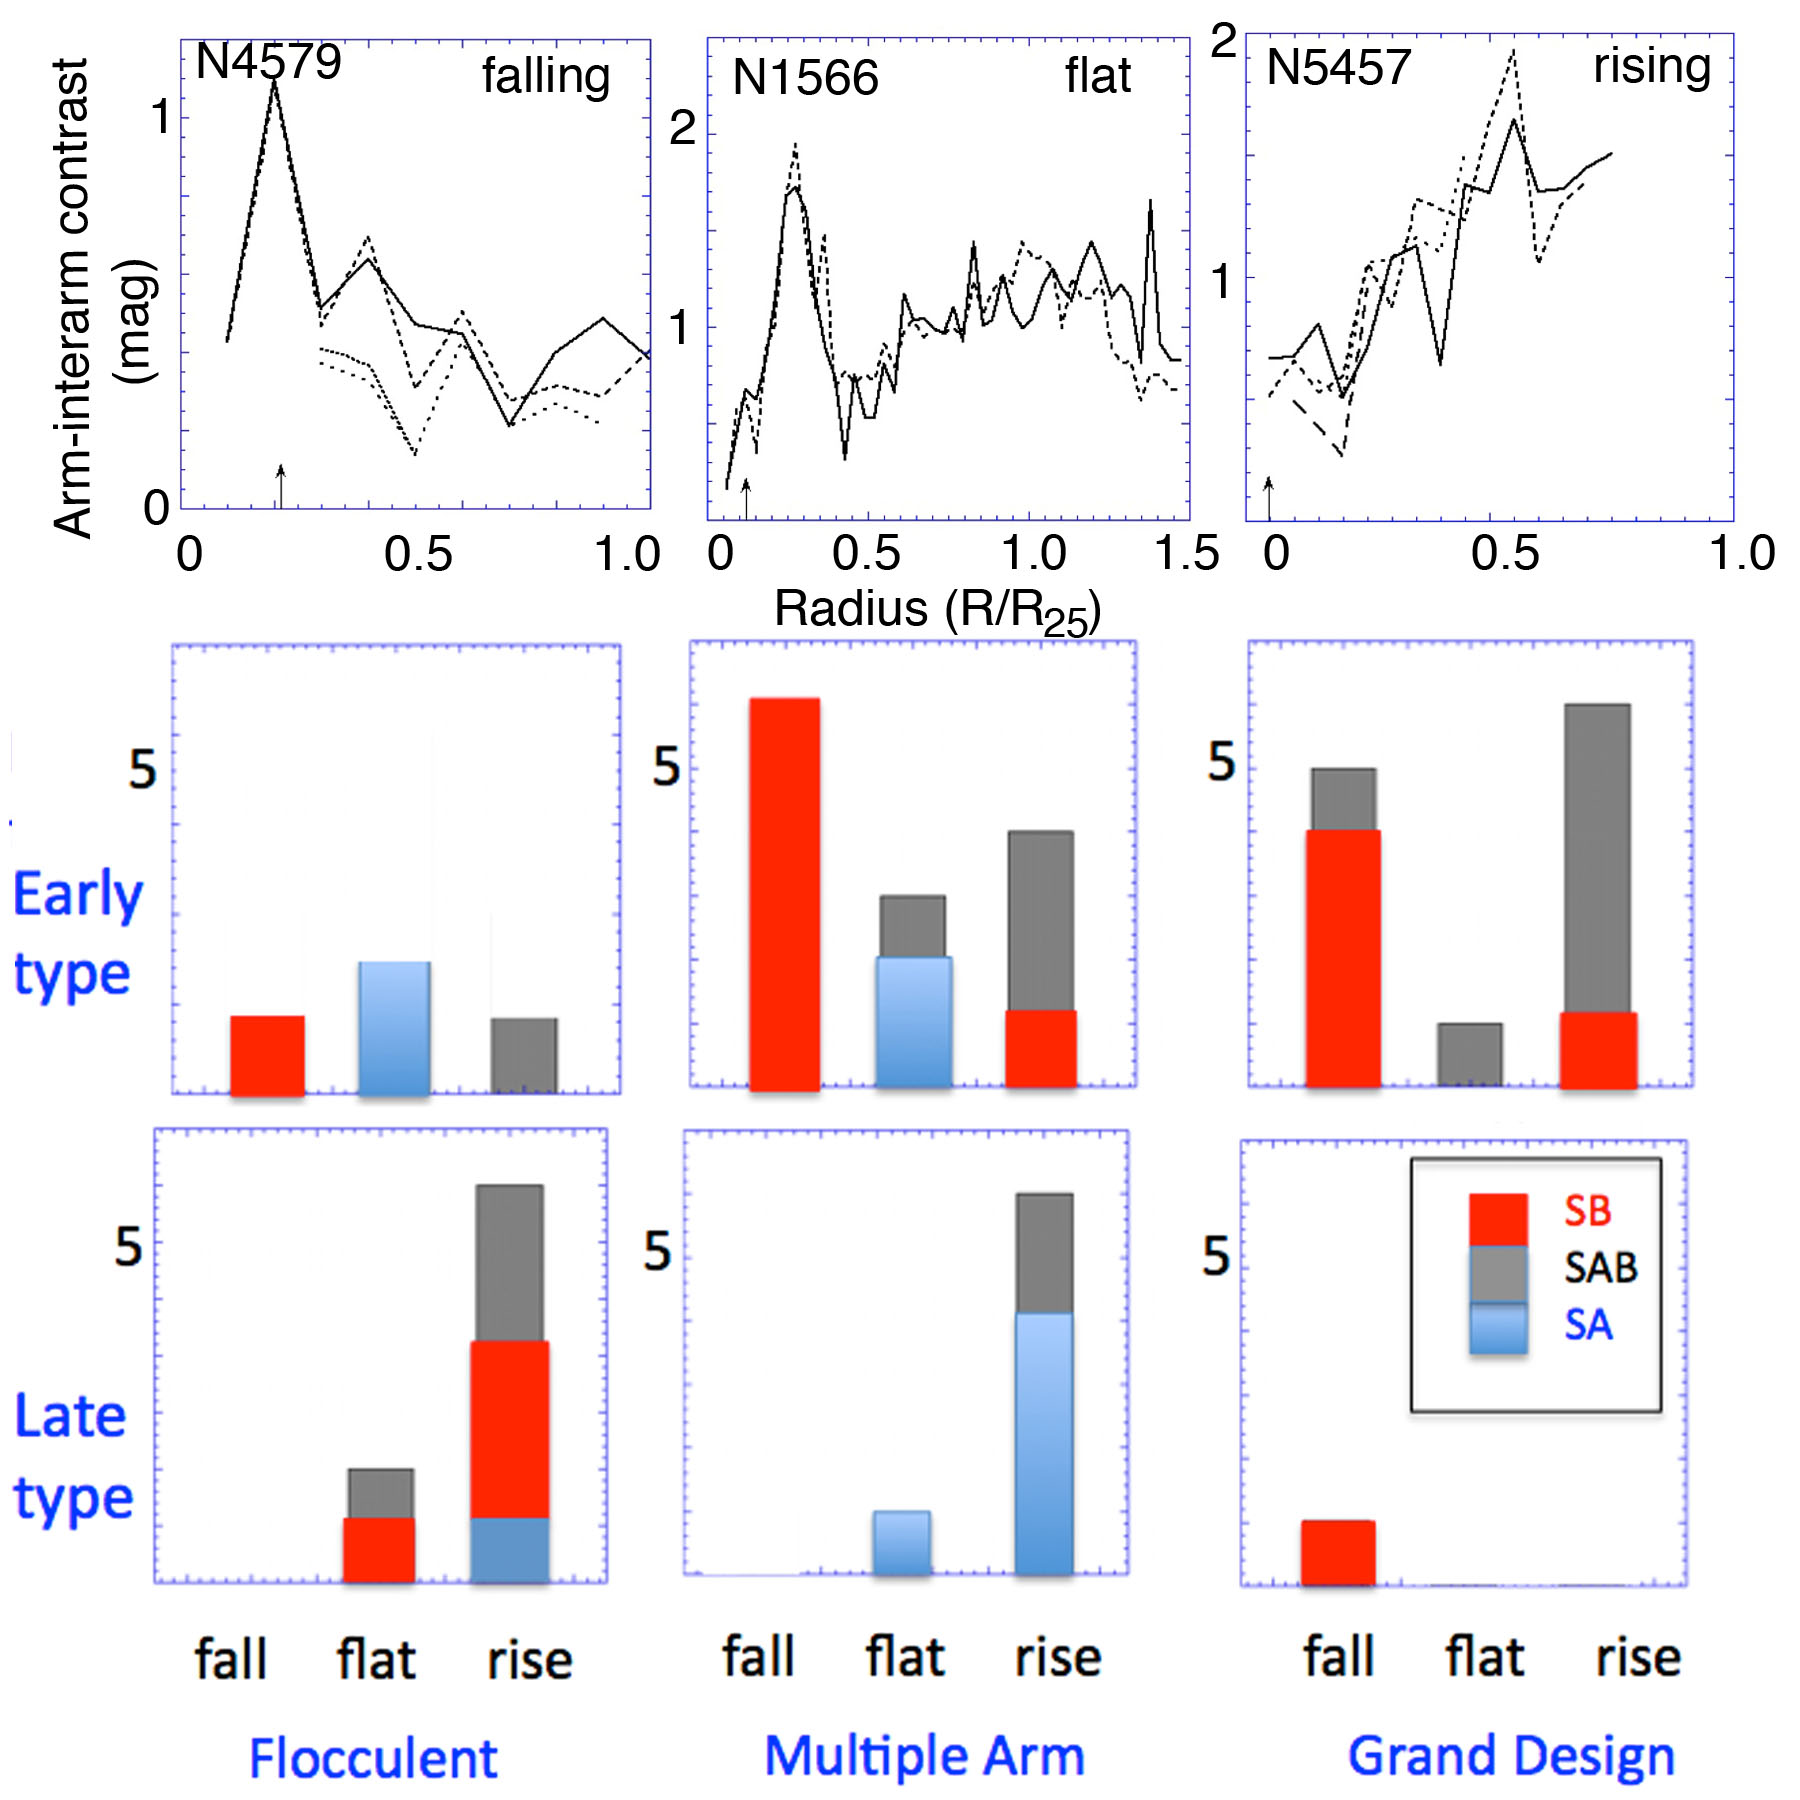
Arm-interarm contrasts in the spiral region vary as a function of radius (Fig. 5), with either falling, constant, or rising trends. These trends are listed in the last column of Table LABEL:table3. Three examples of radial contrast variations are shown in Figure 11: falling in NGC 4579, constant in NGC 1566, and rising in NGC 5457. The arrows on the abscissa indicate the locations of the ends of the bars or ovals. The middle and bottom panels of Figure 11 show histograms for the early and late types, coded for falling, flat, or rising arm-interarm contrasts, and subdivided according to Arm Class. The galaxies are also coded by bar types SA, SAB, and SB. The SB grand design and multiple arm galaxies in our sample tend to have falling arm contrasts with radius, while the SA and SAB galaxies for all Arm Classes tend to have rising or flat arm contrasts in our sample. Flocculent and late type galaxies tend to have rising arm contrasts. We also find that 11 out of 12 galaxies with falling arm-interarm contrasts have flat bars (10 of which are SB and all of which are multiple arm or grand design), while only 3 out of 18 galaxies with rising arm-interarm contrasts have flat bars (and all of these are multiple arm or grand design).
Falling spiral arm amplitudes beyond SAB and SB bars could be an indication that these bars end near corotation (Contopoulos, 1980). Corotation is generally where spiral waves are amplified, in both the WASER theory (Lau, Lin & Mark, 1976) and the swing amplifier theory (Toomre, 1981). The arm amplitudes decrease away from corotation and generally approach zero amplitude at the inner and outer Lindblad resonances, where the waves are absorbed. Thus, the decreasing amplitudes can be an indication that the bars are driving the spirals where these two features meet, and that they both have the same pattern speed. The decrease in arm amplitude beyond the bars is also consistent with predictions by the “manifold theory” of spiral structure (Romero-Gómez et al., 2006, 2007; Athanassoula et al., 2009a, b, 2010). For strong bars, the manifolds have the shape of spiral arms and widen with increasing radius, thereby diminishing the arm-interarm contrast. If there is interference with other spiral components, e.g. with a weak leading component, this could lead to bumps on an otherwise smoothly decreasing density profile.
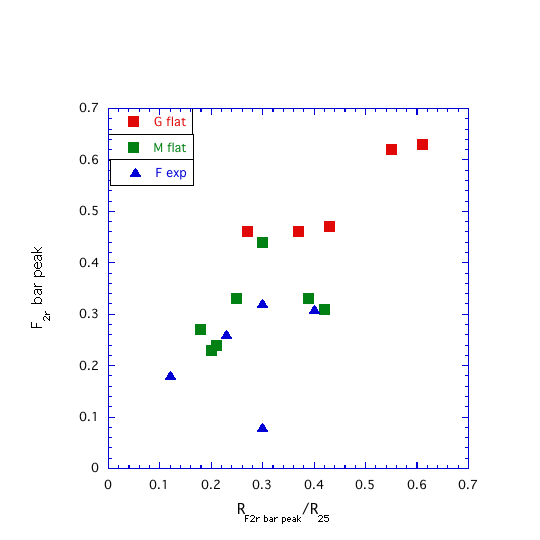
The peak value of in the bar is a measure of bar amplitude. Table LABEL:table3 lists this peak value along with the radius (in units of ) at which it occurs. The radius of the peak is slightly less than, but correlated with, the end of the bar, according to simulations (Athanassoula & Misiriotis, 2002). In Figure 12 the peak amplitude in the bar for SB galaxies is shown as a function of radius at which this peak occurs. Longer bars tend to have higher peak amplitudes, as found also in optical and near-IR work mentioned previously and by Elmegreen et al. (2007). The Spearman’s rank correlation coefficient is 0.68, with a significance at the 99% confidence level. A bivariate least-squares fit to the relation gives a slope of 1.160.328 for peak versus relative bar length.
This result is consistent with ideas of secular bar evolution (e.g., Debattista & Sellwood, 2000; Athanassoula & Misiriotis, 2002; Athanassoula, 2003; Valenzuela & Klypin, 2003; Athanassoula et al., 2009c). In simulations of bar evolution (Athanassoula, 2003), angular momentum is emitted mainly by near-resonant material in the bar and absorbed mainly by near-resonant material in the outer disk and halo. As bars lose angular momentum, they can become more massive and/or thinner and/or longer. In the two first cases, the peak amplitude increases, while in the third one the radius of the peak amplitude increases.
Our Fourier transform results are similar to those found in studies of barred galaxies in other passbands. Two of the galaxies in -band studies by Elmegreen et al. (2007), NGC 986 and NGC 7552, are in our current sample. The Fourier component of NGC 986 in band has a peak of 0.62 at a radius of , and NGC 7552 has a peak value of 0.6 at a normalized radius of 0.6; we find the same peaks and peak radii in m to within %, as shown in Table LABEL:table2. EE85 have NGC 3504, NGC 4314, and NGC 7479 in common with our list. Their -band bar components are 0.52, 0.8, and 0.8, compared with our m values of 0.53, 0.45, and 0.45; NGC 3504 is about the same in band and m, but the other two are stronger in band.
Figure 13 shows the bar peak as a function of Hubble type for SAB and SB galaxies, sorted by Arm Class. There is a steady decrease of bar amplitude with later Hubble types, although the correlation is weak; the Pearson correlation coefficient is 0.403, significant at the 98% confidence level. Early types tend to be grand design (for the highest amplitude bars) or multiple arm (for weaker amplitude bars), while later types tend to be flocculent with weak bars. The early types are predominantly flat bars, while the later types are mostly exponential bars. These results are consistent with optical (EE85) and near-IR (Regan & Elmegreen, 1997) studies. The exponential SABs have a mixture of Arm Classes, while the exponential SBs are all flocculent and mostly late type. Conversely, most of the flocculent exponential-barred galaxies are late-type, while most of the multiple arm and all of the grand design exponential-barred galaxies are early type. All of the flat bars of either SAB or SB type are early Hubble type with multiple arm or grand design spiral structure. These results reinforce the idea that high amplitude flat bars of either SAB or SB type occur in early Hubble types and drive spirals in the outer disks.
There are no grand design non-barred galaxies in our sample. Of the 10 SA types, 3 are flocculent and 7 are multiple arm. Among the early type SA galaxies, 2 are flocculent and 2 are multiple arm, while among the late type SA galaxies, 1 is flocculent and 5 are multiple arm. This observation reinforces the idea that bars or oval distortions help drive grand design spirals. Of course, our sample is small; there could be non-barred isolated grand design galaxies that were not studied in this paper. (M81 is an example of a non-barred grand design galaxy, although it has interacting companions.) Kendall, Kennicutt, & Clarke (2011) studied a SINGS sample of 31 galaxies; 15 of their 17 barred galaxies (SAB or SB) have multiple arm or grand design structure, while only 7 of their 13 non-barred (SA) galaxies do. When their sample is divided into early and late type galaxies, the 11 early type SAB or SB galaxies include 1 flocculent, 5 multiple arm, and 5 grand design galaxies, i.e., early type bars are strongly correlated with stellar spirals. Their 6 late types include 1 flocculent, 5 multiple arm, and no grand designs, which means late type bars are correlated with weak or no stellar spirals.
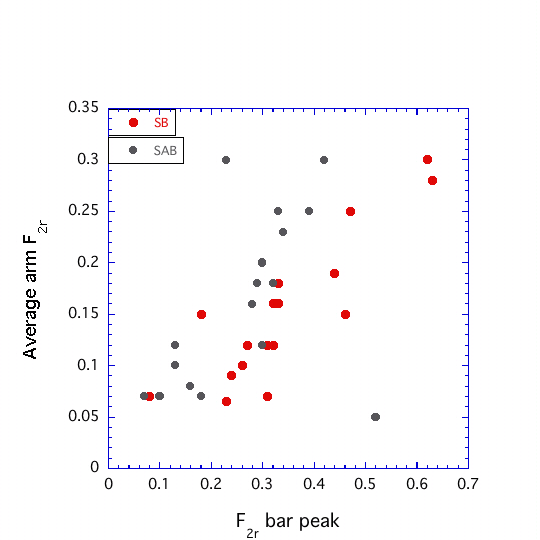
Figure 14 shows the average spiral arm amplitude versus the peak bar amplitude, sorted by SAB and SB types. There is a weak correlation with larger amplitude bars corresponding to larger amplitude arms. The Pearson correlation coefficient is 0.59 for the plotted points, increasing to 0.85 if only SB galaxies are considered, with a significant at the 99% confidence level. A bivariate least-squares fit to the points gives a slope of 0.490.08. This correlation has been seen in the near-IR also (Buta et al., 2009; Salo et al., 2010). The result suggests that bars drive stellar waves, and that stronger bars drive stronger waves.
There is little systematic difference in the bar amplitudes between SAB and SB bar types. In the figure, the SB types are slightly shifted to the lower right, suggesting slightly larger amplitudes for SB compared with SAB bars for a given arm amplitude. However, it is not generally true that SB types are strong bars and SAB types are weak bars. Both types have a range of bar amplitudes that correlate in the same way with Hubble type (Figure 13). The SAB types have lower eccentricities than the SB types, with about the same amplitudes.
Seigar & James (1998b) and Seigar, Chorney, & James (2003) found no connection between bar and arm strengths in their -band study of 45 spirals, although they did not plot Fourier transform results. Instead, they used a measure of arm strength they called the “equivalent angle,” based on measuring the angle subtended by a disk segment containing the same flux as the arm or bar at a given radial range. Their Figure 8 shows a wide variation of arm strength for a given bar strength, but generally smaller bar strengths correspond with smaller arm strengths.
5 Conclusions
Deep images of spiral galaxies at m allow measurements of arm structure out to , further out than many previous optical and near-IR studies. We selected a representative sample of 46 galaxies to measure underlying old stellar disks in a variety of spiral Arm Classes, Hubble types, and bar types. The morphology does not change much from optical to mid-IR, although some optically flocculent galaxies show subtle 2-arm structure at m.
The early types in our sample tend to have multiple arm and grand design spirals, while the late types have flocculent spirals. Barred early types also tend to have high amplitude bars that are relatively long and flat in radial profiles, and outside of these bars are generally grand design or multiple arm spirals that decrease in amplitude with radius. Barred late type galaxies typically have low amplitudes and short exponential bars with flocculent disks. Bars with higher amplitudes are correlated with higher average arm amplitudes. These trends are consistent with results from optical data, and support theories of secular bar growth and the driving of grand design spiral structure by strong bars.
The outer spiral arms of non-barred grand design galaxies appear to be disjoint from and smoother than the inner arms. They do not have the obvious ridges of star formation that also characterize inner disk arms, but there can be plumes of star formation nearby. Barred grand design galaxies do not have such disjoint arms, nor do multiple arm or flocculent galaxies. Most likely, the spiral arms in barred galaxies with strong bars extend between corotation near the end of the bar and the outer Lindblad resonance; they may have different pattern speeds, as discussed by many authors. The outer spirals in non-barred grand design galaxies could also extend to the outer Lindblad resonance at the same pattern speed as the inner spirals, or they could be a resonance feature at a different pattern speed.
Acknowledgments: We are grateful to the dedicated staff at the Spitzer Science Center for their help and support in planning and execution of this Exploration Science program. We also gratefully acknowledge support from NASA JPL/Spitzer grantRSA1374189 provided for the S4G project. DME gratefully acknowledges Vassar College for student support for Andrew Yau, and thanks NASA/JPL/Caltech for grant 1368024. EA and AB thank the Centre National d’Etudes Spatiales for financial support. This research is based in part on archival data obtained with the Spitzer Space Telescope, which is operated by the Jet Propulsion Laboratory, California Institute of Technology under a contract with NASA, and has made use of the NASA/IPAC Extragalactic Database (NED) which is operated by the Jet Propulsion Laboratory, California Institute of Technology, under contract with the National Aeronautics and Space Administration. The National Radio Astronomy Observatory is a facility of the National Science Foundation operated under cooperative agreement by Associated Universities, Inc. We thank the referee for helpful comments on statistics.
References
- Ann (1986) Ann, H. B. 1986, JKAS, 19, 69
- Ann & Lee (1987) Ann, H. B., & Lee S.-W. 1987, JKAS, 20, 49
- Athanassoula (2003) Athanassoula, E. 2003, MNRAS, 341, 1179
- Athanassoula (1992) Athanassoula, E. 1992, ASSL, 178, 127
- Athanassoula, Bosma, & Papaioannou (1987) Athanassoula, E., Bosma, A., & Papaioannou, S. 1987, A & A, 179, 23
- Athanassoula et al. (2009c) Athanassoula, E., Gadotti, D. A., Carrasco, L., Bosma, A., de Souza, R. E., & Recillas, E. 2009, RMxAC, 37, 79
- Athanassoula & Misiriotis (2002) Athanassoula, E., & Misiriotis, A. 2002, MNRAS, 330, 35
- Athanassoula et al. (2009a) Athanassoula, E., Romero-Gómez, M., Bosma, A., & Masdemont, J. J. 2009, MNRAS, 394, 67
- Athanassoula et al. (2009b) Athanassoula, E., Romero-Gómez, M., Bosma, A., & Masdemont, J. J. 2009, MNRAS, 400, 1706
- Athanassoula et al. (2010) Athanassoula, E., Romero-Gómez, M., Bosma, A., & Masdemont, J. J. 2010, MNRAS, 407, 1433A
- Baumgart & Peterson (1986) Baumgart, C. W., & Peterson, C. J. 1986, PASP, 98, 56
- Bertin et al. (1989) Bertin, G., Lin, C. C., Lowe, S. A., & Thurstans, R. P. 1989, ApJ, 338, 78
- Bertin (2000) Bertin, G. 2000, Dynamics of Galaxies, Cambridge: Cambridge University Press
- Block et al. (1994) Block, D. L., Bertin, G., Stockton, A., Grosbol, P., Moorwood, A. F. M., & Peletier, R. F. 1994, A&A, 288, 365
- Block et al. (2002) Block, D. L., Bournaud, F., Combes, F., Puerari, I., & Buta, R. 2002, A&A, 394, L35
- Block et al. (2001) Block, D. L., Puerari, I., Knapen, J. H., Elmegreen, B. G., Buta, R., Stedman, S., & Elmegreen, D. M. 2001, A&A, 375, 761
- Block et al. (2004a) Block, D. L., Buta, R., Knapen, J. H., Elmegreen, D. M., Elmegreen, B. G., & Puerari, I. 2004, AJ, 128, 183
- Block & Puerari (1999) Block, D. L., & Puerari, I. 1999, A&A, 342, 627
- Burbidge, Burbidge, & Prendergast (1962) Burbidge, E. M., Burbidge, G. R., & Prendergast, K. H. 1962, ApJ, 136, 128
- Buta (1984) Buta, R. J. 1984, PASAu, 5, 472
- Buta (2011) Buta, R. 2011, Galaxy Morphology, in “Planets, Stars, and Stellar Systems” series, vol. 6, ed. T. Oswalt, in press, arXiv 1102.0550
- Buta et al. (2010) Buta, R. et al. 2010, ApJS, 190, 147
- Buta & Block (2001) Buta, R. J. & Block, D L.. 2001, A&A, 550, 243
- Buta et al. (2007) Buta, R. J., Corwin, H. G.. Jr., & Odewahn, S. C. 2007, The de Vaucouleurs Atlas of Galaxies (Cambridge: Cambridge University Press)
- Buta et al. (2009) Buta, R., Knapen, J. H., Elmegreen, B. G., Salo, H., Laurikainen, E., Elmegreen, D. M., Puerari, I., & Block, D. L. 2009, AJ, 137, 4487
- Buta, Laurikainen, & Salo (2004) Buta, R., Laurikainen, E., & Salo, H., 2004, AJ, 127, 279
- Buta et al. (2006) Buta, R., Laurikainen, E., Salo, H., Block, D. L., & Knapen, J. H. 2006, AJ, 132, 1859
- Buta, Purcell, & Crocker (1995) Buta, R., Purcell, G. B., & Crocker, D. A. 1995, AJ, 110, 1588
- Buta et al. (2005) Buta, R., Vasylyev, S., Salo, H., & Laurikainen, E. 2005, AJ, 130, 506
- Combes & Elmegreen (1993) Combes, F., & Elmegreen, B. G. 1993, A&A, 271, 391
- Combes & Sanders (1981) Combes, F., & Sanders, R. H. 1981, A&A, 96, 164
- Comerón et al. (2010) Comerón, S., Knapen, J. H., Beckman, J. E., Laurikainen, E., Salo, H., I. Martínez-Vulpuesta, I., & Buta, R. J. 2010, MNRAS, 402, 2462
- Considère & Athanassoula (1988) Considère, S., & Athanassoula, E. 1988, A&AS, 76, 365
- Contopoulos (1980) Contopoulos, G. 1980, A&A, 81, 198
- Debattista & Sellwood (2000) Debattista, V. P., & Sellwood, J. A. 2000, ApJ, 543, 704
- de Vaucouleurs et al. (1991) de Vaucouleurs, G., de Vaucouleurs, A., Corwin, H. G., Jr., Buta, R. J., Paturel, G., & Fouque, P. 1991, Third Reference Catalogue of Bright Galaxies (New York: Springer) (RC3)
- Dobbs & Pringle (2010) Dobbs, C. L., & Pringle, J. E. 2010 MNRAS, 409, 396
- Dobbs et al. (2010) Dobbs, C. L., Theis, C., Pringle, J. E. & Bate, M. R. 2010a, MNRAS, 403, 625
- Draine & Li (2007) Draine, B. T., & Li, A. 2007, ApJ, 657, 810
- Durbala et al. (2009) Durbala, A., Buta, R., Sulentic, J. W., & Verdes-Montenegro, L. 2009, MNRAS, 397, 1756
- Elmegreen & Elmegreen (1985) Elmegreen, B. G., & Elmegreen, D. M. 1985, ApJ, 288, 438 (EE85)
- Elmegreen & Elmegreen (1986) Elmegreen, B.G., & Elmegreen, D.M. 1986, ApJ, 311, 554
- Elmegreen & Elmegreen (1990) Elmegreen, B. G., & Elmegreen, D. M. 1990, ApJ, 355, 52
- Elmegreen et al. (2007) Elmegreen, B. G., Elmegreen, D. M., Knapen, J. H., Buta, R. J., Block, D. L., & Puerari, I. 2007, ApJL, 670, 97
- Elmegreen, Elmegreen & Montenegro (1992) Elmegreen, B. G., Elmegreen, D. M., & Montenegro, L. 1992, ApJS, 79, 37 (EEM)
- Elmegreen, Seiden, & Elmegreen (1989) Elmegreen, B. G., Seiden, P. E., & Elmegreen, D. M. 1989, ApJ, 343, 602
- Elmegreen (1981) Elmegreen, D. M. 1981, ApJS, 47, 229
- Elmegreen et al. (1999) Elmegreen, D. M., Chromey, F. R., Bissell, B. A., & Corrado, K. 1999, AJ, 118, 2618
- Elmegreen & Elmegreen (1984) Elmegreen, D. M., & Elmegreen, B. G. 1984, ApJS, 54, 127 (EE84)
- Elmegreen & Elmegreen (1987) Elmegreen, D. M., & Elmegreen, B. G. 1987, ApJS, 314, 3
- Elmegreen et al. (1991) Elmegreen, D. M., Sundin, M., Elmegreen, B. G., & Sundelius, B. 1991, A&A, 244, 52
- Elmegreen & Elmegreen (1995) Elmegreen, D. M., & Elmegreen, B. G., 1995, ApJ, 445, 591
- Eskridge et al. (2000) Eskridge, P. B. et al. 2000, AJ, 119, 536
- Fazio et al. (2004) Fazio, G. G. et al. 2004, ApJS, 154, 10
- Gadotti (2010) Gadotti, D. A. 2010, arXiv:1003.1719
- Gadotti et al. (2007) Gadotti, D. A., Athanassoula, E., Carrasco, L., Bosma, A., de Souza, R. E., & Recillas, E. 2007, MNRAS, 381, 943
- Goldreich & Lynden-Bell (1965) Goldreich, P., & Lynden-Bell, D. 1965, MNRAS, 156, 59
- Hackwell & Schweizer (1983) Hackwell, J.A. & Schweizer, F. 1983, ApJ, 265, 643
- Hoyle et al. (2011) Hoyle, B., Masters, K., Nichol, R., Edmondson, E., Smith, A., Lintott, C., Bamford, S., Scranton, R., Schwawinski, K., & Thomas, D. 2011, submitted to MNRAS, arXiv:1104.5394
- Iye et al. (1982) Iye, M., Okamura, S., Hamabe, M. & Watanabe, M. 1982, ApJ, 256, 103
- Jogee et al. (2002) Jogee, S., Knapen, J. H., Laine, S., Shlosman, I., Scoville, N. Z., & Englmaier, P. 2002, ApJ, 570, L55
- Julian & Toomre (1966) Julian, W. H., & Toomre, A. 1966, ApJ, 146, 810
- Kalnajs (1971) Kalnajs, A. J. 1971, ApJ, 166, 275
- Kendall, Kennicutt, & Clarke (2011) Kendall, S., Kennicutt, R. C., & Clarke, C. 2011, MNRAS, in press (arXiv:1101.5764v1)
- Kennicutt et al. (2003) Kennicutt, R. C. et al. 2003, PASP, 115, 928
- Knapen et al. (1992) Knapen, J.H., Beckman, J.E., Cepa, J., van der Hulst, T., Rand, R.J. 1992, ApJ, 385, L37
- Knapen et al. (1995) Knapen, J. H., Beckman, J. E., Shlosman, I., Peletier, R. G., Heller, C. H., & de Jong, R. S. 1995, ApJ, 443, L73
- Kormendy & Norman (1979) Kormendy, J., & Norman, C. A, 1979, ApJ, 233, 539
- Lau, Lin & Mark (1976) Lau, Y. Y., Lin, C. C., & Mark, J.W.-K. 1976, PNAS, 73, 1379
- Laurikainen et al. (2007) Laurikainen, E., Salo, H., Buta, R., & Knapen, J. H. 2007, MNRAS, 381, 401
- Laurikainen et al. (2004) Laurikainen, E., Salo, H., Buta, R., & Vasylyev, S. 2004, MNRAS, 355, 1251
- Lin & Shu (1964) Lin, C. C., & Shu, F. H. 1964, ApJ, 140, 646
- Meidt et al. (2011) Meidt, S. and S4G team 2011, in preparation
- Menéndez-Delmestre et al. (2007) Mendéndez-Delmestre, K., Sheth, K., Schinnerer, E., Jarrett, T. H., & Scoville, N. Z. 2007, ApJ, 657, 790
- Oh et al. (2010) Oh, S. H., Kim, W.-T., Lee, H. M., & Kim, J., 2008, ApJ, 683, 94
- Pence, Taylor & Atherton (1990) Pence, W.D., Taylor, K., & Atherton, P. 1990, ApJ, 357, 415
- Regan & Elmegreen (1997) Regan, M. W. & Elmegreen, D. M. 1997, AJ, 114, 965
- Regan & Vogel (1994) Regan, M. W., & Vogel, S. N. 1994, ApJ, 434, 536
- Rix & Rieke (1993) Rix, H.-W. & Rieke, M. J. 1993, ApJ, 418, 123
- Rix & Zaritsky (1995) Rix, H.-W., & Zaritsky, D. 1995, ApJ, 447, 82
- Roberts (1969) Roberts, W. W. 1969, ApJ. 158, 123
- Romero-Gómez et al. (2007) Romero-Gómez, M., Athanassoula, E., Mademont, J. J., & García-Gómez, C. 2007, A&A, 472, 63
- Romero-Gómez et al. (2006) Romero-Gómez, M., Masdemont, J. J., Athanassoula, E., & García-Gómez, C. 2006, A&A, 453, 39
- Salo et al. (2010) Salo, H., Laurikainen, E., Buta, R., & Knapen, J. H. 2010, ApJL, 715, 56
- Schlosser & Musculus (1984) Schlosser, W., & Musculus D. 1984, A&A, 131, 367
- Schweizer (1976) Schweizer, F. 1976, ApJS, 31, 313
- Seiden & Gerola (1979) Seiden, P. E., & Gerola, H. 1979, ApJ, 233, 56
- Seigar, Chorney, & James (2003) Seigar, M. S., Chorney, N. E., & James, P. A. 2003, MNRAS, 342, 1
- Seigar & James (1998b) Seigar, M. S., & James, P. A. 1998, MNRAS, 299, 672
- Seigar & James (1998a) Seigar, M. S., & James, P. A. 1998, MNRAS, 299, 685
- Sellwood (1985) Sellwood, J.A. 1985, MNRAS, 217, 127
- Sellwood & Carlberg (1984) Sellwood, J. A., & Carlberg, R. G. 1984, ApJ, 282, 61
- Sellwood & Sparke (1988) Sellwood, J. A., & Sparke, L. S. 1988, MNRAS, 231, P25
- Sheth et al. (2010) Sheth, K. et al. 2010, PASP, 122, 1397 665, 1138
- Struck-Marcell (1990) Struck-Marcell, C., 1990, AJ, 99, 71
- Tagger et al. (1987) Tagger, M., Sygnet, J. F., Athanassoula, E. & Pellat, R., 1987, ApJ, 318, 43
- Thomasson et al. (1990) Thomasson, M., Elmegreen, B. G., Donner, K. J., & Sundelius, B. 1990, ApJ, 356, L9
- Thornley (1996) Thornley, M. 1996, ApJ, 469, L45
- Thornley & Mundy (1997) Thornley, M., & Mundy, L. 1997, ApJ, 484, 202
- Toomre (1969) Toomre, A. 1969, ApJ, 158, 899
- Toomre (1981) Toomre, A. 1981, in “The Structure and Evolution of Normal Galaxies,” Proceedings of the Advanced Study Institute, Cambridge U. Press, 111
- Tully (1974) Tully, R. B. 1974, ApJS, 27, 449
- Valenzuela & Klypin (2003) Valenzuela, O., & Klypin, A. 2003, MNRAS, 345, 406
- Visser (1980) Visser, H. C. D. 1980, A&A, 88, 149
| NGC | Arm Classaafrom Elmegreen & Elmegreen (1987) except for NGC 3906, classified here | Bar typebbfrom Buta et al. (2010) except for NGC 4450, 4689, and 5247, from RC3 | mid-IR typebbfrom Buta et al. (2010) except for NGC 4450, 4689, and 5247, from RC3 | PAccfrom mid-IR isophotes of inner disk | inclinationddfrom the blue light diameter in RC3 | Radiusddfrom the blue light diameter in RC3 |
|---|---|---|---|---|---|---|
| (degrees) | (degrees) | (arcmin) | ||||
| 300 | M | A | dm | 107.7 | 44.9 | 10.94 |
| 337 | F | AB | cd | 130 | 50.9 | 1.44 |
| 428 | F | AB | dm | 114.3 | 40.7 | 2.04 |
| 628 | M | A | c | 107.5 | 24.2 | 5.24 |
| 986 | G | B | ab | 123.2 | 40.7 | 1.95 |
| 1097 | G | B | ab | 126.9 | 47.5 | 4.67 |
| 1313 | F | B | dm | 16.2 | 40.7 | 4.56 |
| 1433 | M | B | a | 15.6 | 24.2 | 3.23 |
| 1512 | M | B | a | 67.7 | 50.9 | 4.46 |
| 1566 | G | AB | b | 21.1 | 37.4 | 4.16 |
| 2500 | F | AB | d | 71.4 | 24.2 | 1.44 |
| 2552 | F | AB | m | 53.7 | 48.7 | 1.73 |
| 2805 | M | AB | c | 182.4 | 40.7 | 3.16 |
| 2841 | F | AB | a | 147.4 | 64.1 | 4.06 |
| 2903 | M | B | b | 23.4 | 61.4 | 6.30 |
| 3049 | G | B | ab | 26.6 | 48.7 | 1.09 |
| 3147 | M | AB | b | 111.7 | 27.0 | 1.95 |
| 3184 | M | A | bc | 118.2 | 21.1 | 3.71 |
| 3198 | M | AB | bc | 34.9 | 67.1 | 4.26 |
| 3344 | M | AB | bc | 68 | 24.2 | 3.54 |
| 3351 | M | B | a | 20.1 | 47.5 | 3.71 |
| 3504 | G | AB | a | 0 | 39.1 | 1.35 |
| 3627 | M | B | b | 174.5 | 62.8 | 4.56 |
| 3906 | F | B | dm | 0 | 27.0 | 0.93 |
| 3938 | M | A | c | 0 | 24.2 | 2.69 |
| 3953 | M | B | bc | 15.1 | 59.9 | 3.46 |
| 4254 | M | A | c | 66 | 29.4 | 2.69 |
| 4299 | M | A | dm | 0 | 21.1 | 0.87 |
| 4314 | G | B | a | 55.5 | 27.0 | 2.09 |
| 4321 | G | AB | bc | 189.3 | 31.7 | 3.71 |
| 4450 | M | A | ab | 172.5 | 42.2 | 2.62 |
| 4536 | G | AB | bc | 124.1 | 64.8 | 3.79 |
| 4579 | M | B | a | 87.1 | 37.4 | 2.95 |
| 4689 | F | A | bc | 73 | 35.6 | 2.13 |
| 4725 | M | AB | a | 37.7 | 44.9 | 5.36 |
| 4736 | G | AB | a | 130.6 | 35.6 | 5.61 |
| 5055 | F | A | bc | 104.7 | 54.9 | 6.30 |
| 5068 | F | B | d | 0 | 29.4 | 3.62 |
| 5147 | F | B | dm | 112 | 35.6 | 0.95 |
| 5194 | G | AB | bc | 105 | 51.9 | 5.61 |
| 5248 | G | AB | bc | 129.6 | 43.6 | 3.08 |
| 5457 | M | AB | cd | 0 | 0.0 | 0.00 |
| 5713 | F | B | ab | 13.5 | 27.0 | 1.38 |
| 7479 | G | B | b | 44.5 | 40.7 | 2.04 |
| 7552 | G | B | a | 178 | 37.4 | 1.69 |
| 7793 | F | A | c | 99.9 | 47.5 | 4.67 |
| NGC | aaratio of radius of peak m=2 Fourier transform in bar to blue light radius. Uncertainties in the m=2 components are | bbbar peak Fourier transform for m=2 | barccflat or exponential bar, determined from radial profiles | armddarm peak Fourier transform for m=2 | Arm-interarmeeaverage arm-interarm contrast in disk | arm slopeffslope of arms (beyond bar or oval, if present) |
|---|---|---|---|---|---|---|
| bar peak | profile | average | average (mag) | |||
| 300 | 0.31 | 0.13 | - | 0.08 | 0.6 | flat |
| 337 | 0.40 | 0.32 | exp | 0.18 | 0.9 | rise |
| 428 | 0.70 | 0.30 | exp | 0.12 | 1.0 | rise |
| 628 | 0.45 | 0.20 | - | 0.1 | 0.9 | rise |
| 986 | 0.61 | 0.63 | flat | 0.28 | 0.9 | fall |
| 1097 | 0.37 | 0.46 | flat | 0.15 | 1.2 | fall |
| 1313 | 0.30 | 0.32 | exp | 0.16 | 1.3 | rise |
| 1433 | 0.30 | 0.44 | flat | 0.19 | 0.55 | fall |
| 1512 | 0.39 | 0.33 | flat | 0.16 | 0.8 | fall |
| 1566 | 0.28 | 0.39 | flat | 0.25 | 1.1 | flat |
| 2500 | 0.18 | 0.13 | exp | 0.1 | 0.6 | flat |
| 2552 | 0.28 | 0.13 | exp | 0.12 | 0.9 | rise |
| 2805 | 0.24 | 0.18 | exp | 0.07 | 1.2 | rise |
| 2841 | 0.07 | 0.16 | exp | 0.08 | 0.3 | rise |
| 2903 | 0.42 | 0.31 | flat | 0.07 | 0.7 | fall |
| 3049 | 0.37 | 0.32 | - | 0.12 | 0.7 | fall |
| 3147 | 0.39 | 0.10 | exp | 0.07 | 0.4 | flat |
| 3184 | 0.31 | 0.19 | - | 0.1 | 0.6 | flat |
| 3198 | 0.59 | 0.29 | exp | 0.18 | 0.9 | rise |
| 3344 | 0.07 | 0.07 | exp | 0.07 | 0.9 | rise |
| 3351 | 0.18 | 0.27 | flat | 0.12 | 0.4 | fall |
| 3504 | 0.40 | 0.52 | flat | 0.05 | 0.4 | fall |
| 3627 | 0.25 | 0.33 | flat | 0.18 | 1.05 | fall |
| 3906 | 0.23 | 0.26 | exp | 0.1 | 1.4 | rise |
| 3938 | 0.20 | 0.11 | - | 0.075 | 0.7 | rise |
| 3953 | 0.21 | 0.24 | flat | 0.09 | 0.8 | rise |
| 4254 | 0.40 | 0.18 | - | 0.15 | 1.2 | rise |
| 4299 | 0.52 | 0.17 | - | 0.16 | 1.1 | rise |
| 4314 | 0.43 | 0.47 | flat | 0.25 | 2.3 | rise |
| 4321 | 0.55 | 0.30 | exp | 0.2 | 1.2 | rise |
| 4450 | 0.28 | 0.19 | - | 0.05 | 0.6 | flat |
| 4536 | 0.30 | 0.33 | exp | 0.25 | 1.3 | rise |
| 4579 | 0.20 | 0.23 | flat | 0.065 | 0.45 | fall |
| 4689 | 0.11 | 0.07 | - | 0.02 | 0.3 | flat |
| 4725 | 0.42 | 0.30 | exp | 0.2 | 1.2 | rise |
| 4736 | 0.80 | 0.28 | exp | 0.16 | 0.9 | rise |
| 5055 | 0.54 | 0.13 | - | 0.09 | 0.35 | flat |
| 5068 | 0.12 | 0.18 | exp | 0.15 | 0.75 | flat |
| 5147 | 0.30 | 0.08 | exp | 0.07 | 0.8 | rise |
| 5194 | 0.38 | 0.34 | exp | 0.23 | 1.5 | rise |
| 5248 | 0.53 | 0.42 | flat | 0.3 | 1.1 | rise |
| 5457 | 0.56 | 0.23 | exp | 0.3 | 1.2 | rise |
| 5713 | 0.40 | 0.31 | exp | 0.12 | 0.7 | fall |
| 7479 | 0.27 | 0.46 | flat | 0.15 | 1.1 | fall |
| 7552 | 0.55 | 0.62 | flat | 0.3 | 1.1 | fall |
| 7793 | 0.65 | 0.16 | - | 0.07 | 0.5 | rise |
| NGC | B-bandaa Arm-interarm contrasts were evaluated at approximately the same radius in all bands for a given galaxy. Uncertainties are 0.1 mag; from Elmegreen & Elmegreen (1984) | I-bandaa Arm-interarm contrasts were evaluated at approximately the same radius in all bands for a given galaxy. Uncertainties are 0.1 mag; from Elmegreen & Elmegreen (1984) | -bandbbfrom Regan & Elmegreen (1997) | 3.6m | 4.5m |
|---|---|---|---|---|---|
| (mag) | (mag) | (mag) | (mag) | (mag) | |
| 628 | 0.86 | 0.67 | 0.95 | 0.70 | |
| 2500 | 0.9 | 0.6 | 0.6 | ||
| 2841 | 0.48 | 0.19 | 0.3 | 0.3 | |
| 2903 | 0.76 | 0.48 | (1.3) | 0.9,(1.2) | |
| 3344 | 0.86 | 0.86 | 0.8 | ||
| 3504 | 0.9 | 0.5 | 0.5 | ||
| 3627 | 1.8 | 1.5 | |||
| 4254 | 1.1 | 0.9 | 1.4 | ||
| 4314 | 0.8 | 1.0 | 2.2 | 2.0 | |
| 4321 | 0.95 | 0.67 | 1.3 | 1.3 | |
| 5055 | 0.38 | 0.28 | 0.40 | ||
| 5194 | 1.6 | 1.7 | 1.3 | ||
| 5248 | 1.5 | 1.8 | 1.1 | ||
| 5457 | 0.95 | 0.86 | 1.0 | ||
| 7479 | 1.2 | 1.4 | 1.0 | ||
| 7793 | 0.76 | 0.29 | 0.45 | 0.45 |
