Unveiling Extragalactic Star Formation Using Radio Recombination Lines: An EVLA Pilot Study with NGC 253
Abstract
Radio recombination lines (RRLs) are powerful, extinction-free diagnostics of the ionized gas in young, star-forming regions. Unfortunately, these lines are difficult to detect in external galaxies. We present the results of EVLA observations of the RRL and radio continuum emission at 33 GHz from NGC 253, a nearby nuclear starburst galaxy. We detect the previously unobserved H58 and H59 RRLs and make simultaneous sensitive measurements of the continuum. We measure integrated line fluxes of W m-2 and W m-2 for the H58 and H59 lines, respectively. The thermal gas in NGC 253 is kinematically complex with multiple velocity components. We constrain the density of the thermal gas to cm-3 and estimate an ionizing photon flux of s-1. We use the RRL kinematics and the derived ionizing photon flux to show that the nuclear region of NGC 253 is not gravitationally bound, which is consistent with the outflow of gas inferred from the X-ray and measurements. The line profiles, fluxes, and kinematics of the H58 and H59 lines agree with those of RRLs at different frequencies confirming the accuracy of the previous, more difficult, high frequency observations. We find that the EVLA is an order of magnitude more efficient for extragalactic RRL observations than the VLA. These observations demonstrate both the power of the EVLA and the future potential of extragalactic RRL studies with the EVLA.
1 Introduction
How stars form is one of the most important physical questions in astrophysics today. While we have viable theories that explain how star formation occurs in the Milky Way (Zinnecker & Yorke, 2007; McKee & Ostriker, 2007), we do not yet understand how stars form in galaxies with different conditions than those in the Milky Way. A key piece of the puzzle is quantitative information about the physical conditions in the interstellar medium (ISM) in extragalactic star-forming regions with a wide range of metallicities, total masses, and star formation rates. Studies of young star-forming regions still embedded in their natal clouds of dust and dense gas are particularly important; these embedded regions give us crucial information about the ISM before the newly-formed stars have destroyed their birth environments and thus tell us about the conditions in which stars form. However, these regions are poorly understood because they are heavily obscured in the optical and near-infrared (), which limits the utility of “standard” optical/IR nebular diagnostic lines.
Radio recombination lines (RRLs) are powerful tracers of the physical properties of obscured thermal gas. These lines occur when electrons make transitions between high levels () of an excited atom (Roelfsema & Goss, 1992; Gordon & Sorochenko, 2009). For typical extragalactic spatial resolutions, RRLs act like density filters with higher frequency lines tracing higher density gas (Zhao et al., 1997). Observations of RRLs at multiple, widely spaced frequencies constrain the density and filling factor of the thermal gas in a star-forming region without being affected by the significant extinction from the dust and gas within the star-forming region. RRLs also provide kinematic information about the thermal gas and estimates of the ionizing photon flux, the star formation rate, and the star formation efficiency. Unfortunately, the use of RRLs outside the Milky Way system has been limited to a dozen bright, nearby galaxies because these lines are faint (a few percent above the continuum) and have large velocity widths ( 100 ). Moreover, the higher frequency RRLs, which trace the higher density thermal gas and thus younger star forming regions, have been particularly challenging to observe because the bandwidths needed to observed these lines were larger than the maximum available bandwidth of the previous generation of instrumentation.
Work by Anantharamaiah and collaborators established the Very Large Array (VLA) as a powerful instrument for extragalactic RRL observations (e.g., Anantharamaiah et al., 1993; Zhao et al., 1996; Anantharamaiah & Goss, 1996; Zhao et al., 1997; Phookun et al., 1998; Anantharamaiah et al., 2000; Das et al., 2001; Mohan et al., 2001, 2002; Roy et al., 2005; Mohan et al., 2005; Roy et al., 2008).111Roy et al. (2005, 2008) also include data from the Australia Telescope Compact Array. Most of these observations were at frequencies 8.3 GHz; this was the highest frequency for which the VLA correlator had a large enough velocity coverage to observe the entire line using a single correlator tuning. Observations of RRLs at higher frequencies (43 GHz) by Rodríguez-Rico and collaborators required combining four correlator tunings in post-processing for the necessary velocity coverage (Rodríguez-Rico et al., 2004, 2005, 2006; Rodríguez-Rico et al., 2007a, b). While those observations provided vital information on the high density gas in several systems, they may introduce systematic uncertainties in the line profile and in the continuum subtraction, particularly for very broad lines.
The bandwidth of the National Radio Astronomy Observatory (NRAO) Expanded Very Large Array (EVLA; Perley et al., 2011)222The National Radio Astronomy Observatory is a facility of the National Science Foundation operated under cooperative agreement by Associated Universities, Inc. WIDAR correlator and the improved sensitivity and additional frequency coverage of the EVLA receivers are opening new frontiers in RRL studies. These improvements will make observations of these lines significantly more efficient than with the VLA enabling us to broaden the sample of galaxies with RRL measurements. We present observations taken as part of the EVLA Resident Shared Risk Observing (RSRO) program AK726 to test the RRL capabilities of the EVLA. The electronics of the EVLA are completely new, so the performance of the EVLA for detecting these lines cannot be directly extrapolated from the very successful attempts using the VLA.
For our pilot study, we chose NGC 253, a nearby galaxy with a nuclear starburst (Ulvestad & Antonucci, 1997; Johnson et al., 2001; Fernández-Ontiveros et al., 2009). This galaxy is an ideal source to test the RRL capabilities of the EVLA because of its strong, well-studied RRL emission; it has measurements of 11 different RRLs from H166 to H40 (Seaquist & Bell, 1977; Mebold et al., 1980; Anantharamaiah & Goss, 1990, 1996; Puxley et al., 1997; Mohan et al., 2002, 2005; Rodríguez-Rico et al., 2006). We present observations of two, previously undetected RRLs (H58 and H59). We demonstrate that the EVLA produces results comparable to previous VLA observations in an eighth of the time and allows simultaneous observations of multiple RRLs. With the bandwidth of the EVLA WIDAR correlator, we are able to more accurately derive the line profile and make excellent, simultaneous measurements of the continuum. We use the H58 and H59 lines to constrain the density of the thermal gas in NGC 253, estimate the ionizing photon flux, and explore the kinematics of the thermal gas in the nuclear region.
We assume a distance to NGC 253 of 3.4 Mpc (1″ is 16 pc), which is the mean of the distances determined from three different fields using the tip of the red giant branch method (Dalcanton et al., 2009).
2 Data Reduction
The data were taken with the EVLA in DnC configuration on 2010 September 22, 25-30. The angular resolution was approximately 1.8″ with a field of view of 1.4′. The resolution corresponds to a physical resolution of 30 pc, which is five to ten times the size of a typical massive star cluster. While these observations cannot resolve individual clusters, they are also unlikely to resolve out diffuse emission associated with the clusters.
We observed H58 (32.85220 GHz) and H59 (31.22332 GHz), which were previously undetected in NGC 253. We configured the correlator to provide two basebands, each containing eight adjacent 128 MHz wide sub-bands with 128 channels and dual polarization. We tuned the basebands to the sky frequencies corresponding to H58 and H59 for NGC 253. The sensitivity at the edges of the sub-bands decreases, which increases the noise in this region of the spectrum by a factor of . The placement of the line peak at the edge of a sub-band results in the noise being higher in the region with the line peak. However, this placement allows very accurate measurements of the flux in the line wings.
We used J0137+3309 (3C48) and J0542+4951 (3C147) as absolute flux density calibrators, J0319+4130 as the bandpass calibrator, and J0137-2430 as the complex gain calibrator. The total on-source time was 57 minutes.
We used CASA333http://casa.nrao.edu to calibrate the data using the standard EVLA high frequency calibration method444http://casaguides.nrao.edu with three modifications. First, since at the time these data were calibrated there were no Ka-band flux density calibrator models, we used the K-band flux density calibrator models. The next two modifications were used to ensure that each individual sub-band was on the same flux density scale. The average opacity value for the central two spectral windows was used as the opacity value for all spectral windows in a baseband. Since the opacity values typically vary by only 2-3% across the entire baseband, this does not introduce any significant systematic effects. Finally, since the flux density derived for the complex gain calibrator was the same (within the errors) for each sub-band in one baseband, we set the flux density of the complex gain calibrator for each sub-band to be the average of the flux densities determined for the complex gain calibrator.
We self-calibrated using the continuum emission deriving one solution for each baseband. We continuum subtracted the data in space and combined the line data (shifting to the same reference frequency) and the continuum data. Table 1 lists the image properties.
3 Results
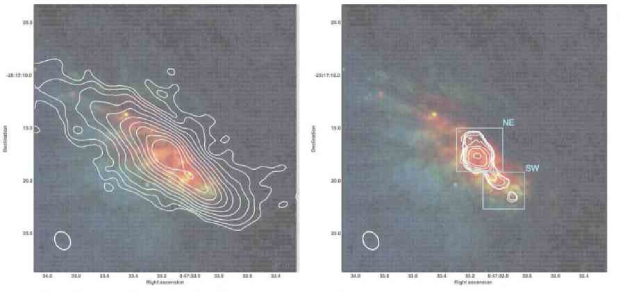
Accurate measurements of both the RRL and continuum emission are necessary to model the RRL emission. Previous RRL observations sacrificed continuum sensitivity to detect and spectrally resolve the RRL. The bandwidth of the EVLA allows us, for the first time, to make sensitive, simultaneous measurements of both the RRL and continuum emission. Figure 1 shows the 33 GHz continuum and integrated H58 line flux density for NGC 253 overlaid on an HST image of the optical and IR emission. We do not show the 32 GHz or the H59 data since they are very similar. The strongest RRL emission is coincident with the peak of the radio continuum emission. There is another extended region of RRL emission toward the southwestern portion of the disk. Following Rodríguez-Rico et al. (2006), we refer to these regions as the northeastern (NE) and southwestern (SW) regions. We measured the flux in the NE region using a rectangle with a bottom left corner of () and a top right corner of () and the SW region using a rectangle with a bottom left corner of () and a top right corner of ().
The extinction in this region is extremely high. In the HST image, blue (B-band) represents unobscured young star formation, while the red (Paschen ) traces obscured recent star formation. The RRL emission is coincident with the highly extincted recent star formation south of the dust lane. The higher resolution of the HST data allows us to distinguish many of the individual star formation regions that are not resolved in the RRL observations. Even at the larger spatial resolution of the EVLA data, we can distinguish two separate, obscured star-forming regions associated with primary and secondary radio continuum and RRL peaks.
The distribution of the H58 line and 33 GHz continuum emission are similar to the distribution of the H53 line and 43 GHz continuum determined by Rodríguez-Rico et al. (2006). Both data sets have similar noise levels. The observing times required to reach these sensitivities, however, are drastically different. The on-source observing time for the data presented in Rodríguez-Rico et al. (2006) was 8 hours, while the H58 data was obtained in 57 minutes. The observations presented in Rodríguez-Rico et al. (2006) only measured one line and a small amount of continuum, while we measured two lines as well as obtaining excellent continuum data at both line frequencies. This comparison shows that the EVLA is at least an order of magnitude more efficient than the VLA for extragalactic RRL observations. The 8 GHz bandwidth of the full correlator will deliver even higher observing efficiencies by providing simultaneous observations of at least four RRLs at these frequencies.
Figure 2 shows channel maps for the H58 emission. The NE and SW regions have different kinematics. The NE region covers a wide range of velocities from to 360 to, while the SW region covers a much narrower range in velocities (190 to 300 ). The central velocities of the NE and SW region are offset by approximately 60 . Anantharamaiah & Goss (1996) attribute the complex H92 velocity field to either a tumbling bar potential, the merger or accretion of another galaxy, or a warp in the disk in the nuclear region. Rodríguez-Rico et al. (2006) suggest that the RRL velocity structure could also be the result of a outflow driven by the nuclear starburst. There is additional X-ray and evidence (Strickland et al., 2000; Westmoquette et al., 2011) supporting a nuclear outflow.
Figure 3 shows the spectrum for the entire line emitting region and for the NE and SW regions. As expected from the models of these lines, the higher frequency (H58) line has a higher peak flux density than the lower frequency line (H59). The H58 and H59 line profiles for the entire RRL region are similar to the line profiles reported by Rodríguez-Rico et al. (2006) and show the presence of several kinematic components discussed in detail by Mohan et al. (2005). We averaged every three channels in the H58 cube together to compare the peak of the H58 line profile to the peak of the H53 line profile from Rodríguez-Rico et al. (2006). The line profiles agree well. The H53 peak line flux density is larger than the H58 peak line flux density, again in agreement with phenomenological expectations.
We fit Gaussians to the H58 and H59 line profiles. While Gaussians are not the best fit for the data because of the multiple velocity components, these fits allow us to directly compare our results to the fits for other RRLs in the literature. Table Unveiling Extragalactic Star Formation Using Radio Recombination Lines: An EVLA Pilot Study with NGC 253 gives the parameters for the fit to the lines as well as the fits presented in Rodríguez-Rico et al. (2006). The H58 and H59 measurements in this paper agree with the measurements of the line flux from the literature. Differences between the flux measurements for each region in the current and archival data can be attributed to differences in the regions selected. The differing velocity widths of the H58 and H59 are due to systematic uncertainties in the Gaussian fits because of multiple velocity components and the different sensitivities of the two images. The signal to noise of the H58 data is higher than that for the H59 data because the H59 line is fainter than the H58 line and the noise in the H59 cube is slightly higher.
Extragalactic RRL emission is modeled as a collection of HII regions, each with an identical electron density (), size (), and temperature (), immersed in a region of diffuse radio continuum emission (Puxley et al., 1991; Anantharamaiah et al., 1993, 2000). We use the method of Zhao et al. (1997) to estimate the range of densities consistent with the H58 line data to compare with those derived in the literature using other RRLs. Assuming a typical non-thermal spectral index (-0.7) and a temperature of K, H58 line flux and continuum flux density are consistent with electron densities of . This corresponds to an ionizing photon flux of s-1. Using Equation (1) in Anantharamaiah et al. (2000), we obtain star formation rates averaged over the lifetime of OB stars of 2 in the RRL emission region. The electron density, ionizing photon fluxes, and star formation rate estimates derived from the H58 line agree with those in the literature (Mohan et al., 2005; Rodríguez-Rico et al., 2006). Our ionizing photon flux is slightly higher than the ionizing photon flux derived by Mohan et al. (2005).
We use the derived ionizing photon flux and the measured line widths to estimate whether the nucleus of NGC 253 is gravitationally bound (e.g. Turner et al., 2003). We estimate the mass of the cluster from the number of ionizing photons using Leitherer et al. (1999). We assume that the cluster was formed in an instantaneous burst, is 3 Myr old (Fernández-Ontiveros et al., 2009), and has a Salpeter IMF with an upper mass limit of 100 , which gives a cluster mass of M⊙. The mass of the ionized gas derived by Rodríguez-Rico et al. (2006) is negligible compared to the cluster mass. The line emitting region is 53 pc by 135 pc. The escape velocity for the nucleus is then between 17 and 26 . This width is much smaller than the velocity width of the RRL emission. We assume that the RRL line widths are dominated by the motion of the gas since they are much larger than the intrinsic width of a RRL from a single HII region (). The escape velocity is still much smaller the RRL velocity width if we consider only the NE region. There we derive an ionizing photon flux of , a cluster mass of M⊙ and an escape velocity of 25 . These calculations show that the central region of NGC 253 is most likely not gravitationally bound, supporting the hypothesis that there is an outflow of gas from the nucleus of this galaxy.
Although RRLs provide an extinction-free tracer of the gas ionized by the cluster, the use of RRL data may underestimate the number of ionizing photons if the photons are absorbed by dust rather than ionize hydrogen. Therefore, the mass of the cluster is a lower limit. To obtain an escape speed comparable to the RRL velocity width, the number of ionizing photons would have to be underestimated by a factor of 45.
4 Conclusions
We have presented observations of the H58 and H59 RRLs and the continuum emission at 32 and 33 GHz from the nucleus of NGC 253. We measure integrated line fluxes of and W m-2 for the H58 and H59 lines respectively. We constrain the thermal gas density to cm-3. We derive an ionizing photon flux of s-1. These estimates of the density and ionizing photon flux are consistent with estimates from the literature (Mohan et al., 2002, 2005; Rodríguez-Rico et al., 2006).
The kinematics of the thermal gas in NGC 253 are complex. The NE region has a broader velocity width (170 – 200 ) than the SW region (145 – 159 ). From our estimate of the ionizing photon flux, we estimate a cluster mass for the nuclear region of NGC 253 of M⊙. The escape velocity for this mass is only 17 to 26 : much lower than the H58 and H59 velocity widths. Therefore, the nuclear region of NGC 253 is most likely not gravitationally bound. We suggest that an outflow of gas from the nuclear region is the most likely explanation for the thermal gas kinematics of NGC 253. The presence of this outflow has been inferred from X-ray (Strickland et al., 2000) and (Westmoquette et al., 2011) observations.
In contrast to previous VLA high frequency RRL observations, we were able to detect not one, but two RRLs, and make much more sensitive measurements of the continuum in an eighth of the time on source. Accurate measurements of both the RRL and continuum emission are necessary to model the RRL emission from these regions in detail. The EVLA is currently an order of magnitude more efficient for high frequency RRL observations than the VLA. The EVLA observing efficiency will increase even further once the full 8 GHz bandwidth is available.
These observations demonstrate the potential of the EVLA to revolutionize extragalactic RRL observations. Future EVLA observations will be able to use RRLs to measure the properties of the thermal gas in a wider variety of galaxies. Ultimately, these observations will lead to a quantitative picture of how the properties of the ISM affect the resulting stellar populations.
References
- Anantharamaiah & Goss (1990) Anantharamaiah, K. R., & Goss, W. M. 1990, in Astrophysics and Space Science Library, Vol. 163, IAU Colloq. 125: Radio Recombination Lines: 25 Years of Investigation, ed. M. A. Gordon & R. L. Sorochenko, 267–+
- Anantharamaiah & Goss (1996) Anantharamaiah, K. R., & Goss, W. M. 1996, ApJ, 466, L13+
- Anantharamaiah et al. (2000) Anantharamaiah, K. R., Viallefond, F., Mohan, N. R., Goss, W. M., & Zhao, J. H. 2000, ApJ, 537, 613
- Anantharamaiah et al. (1993) Anantharamaiah, K. R., Zhao, J.-H., Goss, W. M., & Viallefond, F. 1993, ApJ, 419, 585
- Dalcanton et al. (2009) Dalcanton, J. J., Williams, B. F., Seth, A. C., Dolphin, A., Holtzman, J., Rosema, K., Skillman, E. D., Cole, A., Girardi, L., Gogarten, S. M., Karachentsev, I. D., Olsen, K., Weisz, D., Christensen, C., Freeman, K., Gilbert, K., Gallart, C., Harris, J., Hodge, P., de Jong, R. S., Karachentseva, V., Mateo, M., Stetson, P. B., Tavarez, M., Zaritsky, D., Governato, F., & Quinn, T. 2009, ApJS, 183, 67
- Das et al. (2001) Das, M., Anantharamaiah, K. R., & Yun, M. S. 2001, ApJ, 549, 896
- Fernández-Ontiveros et al. (2009) Fernández-Ontiveros, J. A., Prieto, M. A., & Acosta-Pulido, J. A. 2009, MNRAS, 392, L16
- Gordon & Sorochenko (2009) Gordon, M. A., & Sorochenko, R. L., eds. 2009, Astrophysics and Space Science Library, Vol. 282, Radio Recombination Lines
- Johnson et al. (2001) Johnson, K. E., Kobulnicky, H. A., Massey, P., & Conti, P. S. 2001, ApJ, 559, 864
- Leitherer et al. (1999) Leitherer, C., Schaerer, D., Goldader, J. D., González Delgado, R. M., Robert, C., Kune, D. F., de Mello, D. F., Devost, D., & Heckman, T. M. 1999, ApJS, 123, 3
- McKee & Ostriker (2007) McKee, C. F., & Ostriker, E. C. 2007, ARA&A, 45, 565
- Mebold et al. (1980) Mebold, U., Shaver, P. A., Bell, M. B., & Seaquist, E. R. 1980, A&A, 82, 272
- Mohan et al. (2001) Mohan, N. R., Anantharamaiah, K. R., & Goss, W. M. 2001, ApJ, 557, 659
- Mohan et al. (2002) —. 2002, ApJ, 574, 701
- Mohan et al. (2005) Mohan, N. R., Goss, W. M., & Anantharamaiah, K. R. 2005, A&A, 432, 1
- Perley et al. (2011) Perley, R. A., Chandler, C. J., Butler, B. J., & Wrobel, J. M. 2011, ApJ Letters, in press
- Phookun et al. (1998) Phookun, B., Anantharamaiah, K. R., & Goss, W. M. 1998, MNRAS, 295, 156
- Puxley et al. (1991) Puxley, P. J., Brand, P. W. J. L., Moore, T. J. T., Mountain, C. M., & Nakai, N. 1991, MNRAS, 248, 585
- Puxley et al. (1997) Puxley, P. J., Mountain, C. M., Brand, P. W. J. L., Moore, T. J. T., & Nakai, N. 1997, ApJ, 485, 143
- Rodríguez-Rico et al. (2007a) Rodríguez-Rico, C. A., Goss, W. M., Turner, J. L., & Gómez, Y. 2007a, ApJ, 670, 295
- Rodríguez-Rico et al. (2005) Rodríguez-Rico, C. A., Goss, W. M., Viallefond, F., Zhao, J.-H., Gómez, Y., & Anantharamaiah, K. R. 2005, ApJ, 633, 198
- Rodríguez-Rico et al. (2007b) —. 2007b, ApJ, 668, 625
- Rodríguez-Rico et al. (2006) Rodríguez-Rico, C. A., Goss, W. M., Zhao, J.-H., Gómez, Y., & Anantharamaiah, K. R. 2006, ApJ, 644, 914
- Rodríguez-Rico et al. (2004) Rodríguez-Rico, C. A., Viallefond, F., Zhao, J.-H., Goss, W. M., & Anantharamaiah, K. R. 2004, ApJ, 616, 783
- Roelfsema & Goss (1992) Roelfsema, P. R., & Goss, W. M. 1992, A&A Rev., 4, 161
- Roy et al. (2008) Roy, A. L., Goss, W. M., & Anantharamaiah, K. R. 2008, A&A, 483, 79
- Roy et al. (2005) Roy, A. L., Goss, W. M., Mohan, N. R., & Anantharamaiah, K. R. 2005, A&A, 435, 831
- Seaquist & Bell (1977) Seaquist, E. R., & Bell, M. B. 1977, A&A, 60, L1+
- Strickland et al. (2000) Strickland, D. K., Heckman, T. M., Weaver, K. A., & Dahlem, M. 2000, AJ, 120, 2965
- Turner et al. (2003) Turner, J. L., Beck, S. C., Crosthwaite, L. P., Larkin, J. E., McLean, I. S., & Meier, D. S. 2003, Nature, 423, 621
- Ulvestad & Antonucci (1997) Ulvestad, J. S., & Antonucci, R. R. J. 1997, ApJ, 488, 621
- Westmoquette et al. (2011) Westmoquette, M. S., Smith, L. J., & Gallagher, III, J. S. 2011, ArXiv e-prints
- Zhao et al. (1996) Zhao, J.-H., Anantharamaiah, K. R., Goss, W. M., & Viallefond, F. 1996, ApJ, 472, 54
- Zhao et al. (1997) —. 1997, ApJ, 482, 186
- Zinnecker & Yorke (2007) Zinnecker, H., & Yorke, H. W. 2007, ARA&A, 45, 481
| Frequency | Beam | PA | Noise | Velocity Resolution | Bandwidth | |||
|---|---|---|---|---|---|---|---|---|
| Line/IF | GHz | Type | Robust | ″ | ° | MHz | ||
| H58 | 32.85220 | Line | 0 | 49.1 | 0.75 | 18.3 | ||
| H59 | 31.22331 | Line | 0 | 60.3 | 1.3 | 19.2 | ||
| IF1 | 33.0 | Continuum | 0 | 58.5 | 0.09 | 768 | ||
| IF2 | 32.0 | Continuum | 0 | 64.8 | 0.16 | 768 |
| Region | Line | GHz | mJy | mJy | Ref. | |||
|---|---|---|---|---|---|---|---|---|
| total | H58 | 32.85220 | 2 | |||||
| total | H59 | 31.22331 | 2 | |||||
| NE | H58 | 32.85220 | 2 | |||||
| NE | H59 | 31.22331 | 2 | |||||
| SW | H58 | 32.85220 | 2 | |||||
| SW | H59 | 31.22331 | 2 | |||||
| Archival Data | ||||||||
| total | H53 | 43.3094 | 1 | |||||
| total | H92 | 8.3094 | 1 | |||||
| NE | H53 | 43.3094 | 1 | |||||
| NE | H92 | 8.3094 | 1 | |||||
| SW | H53 | 43.3094 | 1 | |||||
| SW | H92 | 8.3094 | 1 | |||||
References. — (1) Rodríguez-Rico et al. (2006); (2) This work