Chemical evolution during gas-rich galaxy interactions
Abstract
We analyse a set of galaxy interactions performed by using a self-consistent chemo-hydrodynamical model which includes star formation, Supernova feedback and chemical evolution. In agreement with previous works, we find that tidally-induced low-metallicity gas inflows dilute the central oxygen abundance and contribute to the flattening of the metallicity gradients. The tidally-induced inflows trigger starbursts which increase the impact of SN II feedback injecting new chemical elements and driving galactic winds which modulate the metallicity distribution. Although -enhancement in the central regions is detected as a result of the induced starbursts in agreement with previous works, our simulations suggest that this parameter can only provide a timing of the first pericentre mainly for non-retrograde encounters. In order to reproduce wet major mergers at low and high redshifts, we have run simulations with respectively 20 and 50 percent of the disc in form of gas. We find that the more gas-rich encounters behave similarly to the less rich ones, between the first and second pericentre where low-metallicity gas inflows are triggered. However, the higher strength of the inflows triggered in the more gas-rich interactions produces larger metal dilutions factors which are afterward modulated by the new chemical production by Supernova. We find that the more gas-rich interaction develops violent and clumpy star formation triggered by local instabilities all over the disc before the first pericentre, so that if these galaxies were observed at these early stages where no important tidally-induced inflows have been able to develop yet, they would tend to show an excess of oxygen. We find a global mean correlation of both the central abundances and the gradients with the strength of the star formation activity. However, the correlations are affected by orbital parameters, gas inflows and outflows, suggesting that it might be difficult to determine it from observations. Overall, our findings show that a consistent description of the gas dynamics and stellar evolution along the interactions is necessary to assess their effects on the chemical properties of the interstellar medium.
keywords:
galaxies: formation, galaxies: evolution, galaxies: interactions, galaxies: abundances.1 Introduction
Galaxy interactions are considered a key process in galaxy formation since these violent events could be able to redistribute mass and angular momentum very efficiently (e.g. Barnes & Hernquist, 1996; Tissera, 2000; Di Matteo et al., 2008). As a consequence, chemical elements can be stirred up affecting their distribution and metallicity patterns such as gradients. There are numerous observational works dedicated to the study of galaxy pairs (e.g. Sérsic & Pastoriza, 1967; Tinsley & Larson, 1978; Barton et al., 2000; Lambas et al., 2003; Nikolic et al., 2004; Alonso et al., 2006; Woods et al., 2006; Ellison et al., 2008, 2010; Patton et al., 2011). But only in the last few years, it has been possible to focus on the effects of galaxy interactions on chemical abundances. Interacting galaxies, galaxy pairs, ultra-luminous infrared galaxies, and merger remnants have been found to exhibit low gas-phase metallicity at a given stellar mass compared with the mean mass-metallicity relation (e.g. Kewley et al., 2006; Rupke et al., 2008; Ellison et al., 2008; Michel-Dansac et al., 2008; Peeples et al., 2009; Sol Alonso et al., 2010). Recently, Kewley et al. (2010) analysed the metallicity gradients of galaxy pairs in detail confirming the central dilution and gradient flattening previously reported by several authors. These trends have been interpreted as a consequence of low-metallicity inflows triggered by galaxy interactions. Indeed, these interacting galaxies are in majority spirals which, in the nearby Universe, hold a gas-phase metallicity gradient (e.g. Zaritsky et al., 1994; Dutil & Roy, 1999; Moustakas et al., 2010). The presence of metallicity gradients could explain the decrease of the central abundances when low-metallicity inflows are triggered during interactions. There are also some galaxies in pairs with abundances departing significantly from the mass-metallicity relation such as those reported by Michel-Dansac et al. (2008); Peeples et al. (2009); Sol Alonso et al. (2010). Hence, there are still effects of galaxy interactions which demand further understanding.
By using cosmological chemo-hydrodynamical simulations, Perez et al. (2006) showed for the first time that the interacting galaxies tend to have lower central metallicity when compared to isolated galaxies of similar stellar mass. These authors showed that the decrease of central abundances could be explained in terms of gas inflows triggered during the interactions. More recently other numerical works have confirmed these findings by using different simulations and hypothesis (Rupke et al., 2010a; Montuori et al., 2010). Particularly, Rupke et al. (2010a) studied the evolution of metallicity profiles by using hydrodynamical simulations to recreate the major interaction of galaxies with a gas mass fraction similar to that used in our less gas-rich simulations. However, these authors did not consider new star formation activity and the subsequent chemical enrichment of the interstellar medium as we do in our work.
In this paper, we use a chemical model grafted onto GADGET-2, which allows the description of the chemical enrichment of baryons as the merger evolves. Our code also includes a self-consistent model of SN feedback (Scannapieco et al., 2006), so mass-loaded galactic outflows can be triggered without including mass-depend parameters. This code includes the chemical model of Mosconi et al. (2001) which describes the enrichment of baryons by Type Ia and Type II SNe. Hence, the simulations analysed in this work follow the dynamical evolution together with the chemical evolution of baryons as the interaction takes place.
This paper is organized as follows. In Section 2, we describe the code and the initial conditions designed for this work. In Section 3, we explore wet interactions at low redshift while Section 4 analyses a more gas-rich encounter, in order to reproduce typical wet interactions at high redshift. Finally, we summarize our findings in Section 5.
2 Numerical simulations
We performed a set of hydrodynamical simulations of interacting pre-prepared disc galaxies of comparable masses. The simulations were run by using a version of GADGET-2 (Springel, 2005) modified by Scannapieco et al. (2005, 2006) to include the chemical model of Mosconi et al. (2001) and a new SN feedback model developed to provide an improved description of the interstellar medium (ISM) and the injection of energy and metals generated by SNe. The multiphase and SN feedback model developed by Scannapieco et al. (2005, 2006) allow the coexistence of gas clouds with different thermodynamical properties and are able to describe the injection of energy from young stars into the ISM producing the self-regulation of the star formation activity as well as triggering galactic outflows without the need to introduce mass-dependent parameters or to change discontinuously particle momentum to start a wind or temporary suppression of radiative cooling. This scheme has been successful at reproducing the star formation activity during quiescent and starburst phases and is able to trigger mass-loaded winds with strength dependent on the potential well of the systems (e.g. Scannapieco et al., 2006; De Rossi et al., 2010; Sawala et al., 2011; Scannapieco et al., 2011).
Chemical elements are synthesized in the stellar interiors, and ejected into the ISM by SNe. The chemical model describes the enrichment by SNII and SNIa, providing information on certain individual chemical elements. We also assume that each SN injects an amount of energy into the ISM, (cf Table 1). SNII and SNIa are originated from different progenitors with different rates, yields and time-scales. We assume that SNII are generated by stars more massive than 8 M⊙ after yrs. We adopt the yields given by Woosley & Weaver (1995). For SNIa the chemical model assumes lifetimes randomly distributed in the range yrs and yields from W7 model of Thielemann et al. (1993). The SN feedback model is able to generate galactic outflows powerful enough to transport enriched material outside the galaxies (Scannapieco et al., 2008). Thus, these simulations provide us with the evolution of the dynamical and the chemical properties of the baryons as galaxy interactions proceed.
We run three major merger simulations (1:1) varying the orbital parameters (SimI, SimII, and SimV) with the same star formation and SN feedback model. We also performed a run (SimIV) with the same initial conditions as SimII but decreasing the energy release by each SN event (ESN) and a run (SimIII) with the same orbital parameters but without star formation and feedback activity. This last experiment is comparable to those analysed by Rupke et al. (2010a). In order to represent wet mergers at low redshift, these experiments (from SimI to SimV) were run with a 20 percent of the disc in form of gas. Finally, SimVI has the same orbital, star formation and feedback parameters as SimII but the gas fraction in the disc has been increased to up 50 per cent in order to simulate a wet encounter at high redshift. The parameters of the simulations are summarized in Table 1.
Initial conditions correspond to disc galaxies composed of a DM halo, a bulge component (modeled by a NFW and a Hernquist profiles, respectively) and an exponential disc, with a total baryonic mass of . For the less gas-rich simulations, we use dark matter particles, stars distributed in the stellar disc and the bulge, and particles to represent the disc gas component with an initial gas resolution of M. For the more gas-rich experiment, we re-calculate the number of particles so as to keep similar mass resolution. Total stellar masses change according to the gas content in the galaxy discs, being for the less gas-rich experiment and for the more gas-rich simulation. A gravitational softening of kpc was adopted for the gas particles, kpc for the stars, and kpc for the dark matter. Galaxies live in DM halos with circular velocities of . All these experiments are set to have the same elliptical orbits, according to Toomre & Toomre (1972), with pericentre distance of kpc and circularity parameter . These orbital values are consistent with those obtained from the analysis of cosmological simulations (e.g. Khochfar & Burkert, 2006). We have kept them fixed so that changes in the chemical and dynamical properties can only be adscribed to the different angular momentum orientation. A larger orbital distribution might be of interest to analyse possible dependences in the future.
The gas component is initially assumed to have been pre-enriched by the existing stars, following a metallicity gradient statistically consistent with observations. We assigned an initial amount of chemical elements to the gas particles in order to reproduce the mean observational gradient reported by Dutil & Roy (1999), which for the less gas-rich simulations is dex kpc-1 with a central oxygen abundance of 9.2. Thus, the initially simulated galaxies are located onto the observed mass-metallicity relation (Tremonti et al., 2004). For the more gas-rich simulation (SimVI), the initial metallicity gradient is somewhat steeper ( dex kpc-1) and the central metallicity lower (by 0.7 dex) than the less gas-rich galaxies. By doing that, these more gas-rich simulated galaxies are then initially onto the mass-metallicity relation observed at high redshift by Maiolino et al. (2008). Note that the exact adopted values are not critical since we are interested in the relative evolution of the metallicity.
| Simulation | () | ESN ( erg/s) | |
|---|---|---|---|
| SimI | 0.20 | ||
| SimII | 0.20 | ||
| SimIII (no SF) | 0.20 | ||
| SimIV | 0.20 | ||
| SimV | 0.20 | ||
| SimVI | 0.50 |
3 Metallicity evolution of wet mergers in the local Universe
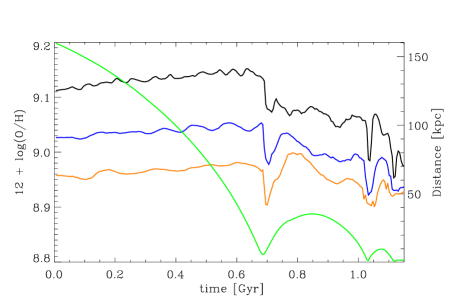
In this section, we analyse the effects of galaxy interactions on the central metallicity in wet local encounters. Taking SimI as an example, we show in Fig. 1 the evolution of the gas-phase O/H abundance of one member of the galaxy pair111The other member of the pair have a similar behaviour. as the interaction proceeds. The evolution of the interaction can be followed by the relative distances between the center of masses of the interacting systems, plotted in the same figure. As it can be seen, there is a clear evidence of a decrease in the central gas-phase metallicity which can be correlated with the first and the second pericentre. Several previous works have shown that during a close encounter, strong tidal torques can develop, re-distributing angular momentum and producing gas infall (e.g. Barnes & Hernquist, 1996; Mihos & Hernquist, 1996; Tissera, 2000; Di Matteo et al., 2008).In the case that a metallicity gradient exists, the infalling gas will tend to have lower metallicity than that of baryons in the central region producing a dilution as it is clearly shown by our simulation (see also Rupke et al., 2010a; Montuori et al., 2010).
In order to quantify the chemical changes as a function of time, we compute the central abundances inside concentric spheres of different radius in the range from 1 kpc to 10 kpc. As an example, Fig. 1 shows the gas-phase oxygen abundance measured inside a sphere of 2 kpc, 4 kpc, and 6 kpc of radius. As it can be appreciated, as one moves inwards, the signals get noisier since the number of particle decreases. If one moves to larger radius, the signal decreases as chemical abundances start to be dominated by the external regions. As a compromised between these two effects, we select kpc (blue line) to define the central region where we will perform the analysis of central metallicities.
In order to understand the decrease in the central abundances shown by Fig. 1, we analyse the evolution of the central gas inflows and their abundances. We compute the central gas inflow at a certain time as the ratio between the new accreted gas mass within and the total gas content within the same radius. Fig. 2a shows the evolution of this central gas inflow as the interacting galaxies approach each other. We find that the gas inflow remains constant in around until the first close passage when it rises up to . From the second pericentre, the gas inflow steadily increases up to around . This gas inflow is dominated by low-metallicity material as it can be appreciated from Fig. 2b (solid line) where we plot its O/H abundance. The accretion of this low-metallicity gas dilutes the central oxygen abundance as shown by the continuous decrease detected after the first pericentre (Fig. 2b, dotted line). The main drops in central abundances correlate with the occurrence of the pericentres driven by important gas inflows (Fig. 2a). Additionally, the gas inflow is also responsible for triggering new star formation activity (Fig. 2c). In SimI, the SFR increases by a factor 3 from the first pericentre as the interaction continues fueling the gas inflow (Fig. 2a,c). As a consequence of this increase in the SFR, the enrichment by SNII also increases, diminishing the effects of chemical dilution previously imprinted by the low-metallicity gas inflows.
The increase of the SFR is also reflected in the -enhancement, [O/Fe], of the gas in the central region (dotted line of Fig. 2d). This central -enhancement is present from the first pericentre but is much stronger around the second one. Note that the infalling gas into the central region is low -enhanced as expected in a disc galaxy such as that of the Milky Way (solid line of Fig. 2d), indicating that the increase of oxygen in the central region is principally due to SNII associated to the central starburst. These general results are in agreement with those reported by Montuori et al. (2010) although these authors did not consider chemical enrichment self-consistently. As we will discuss in the next section, our simulations allow us to make further advances on this issue.
Previous works (e.g. Barnes & Hernquist, 1996; Di Matteo et al., 2008; Cox et al., 2008; Hopkins et al., 2009) have already reported how star formation histories of interacting systems depend on the initial conditions and orbital parameters. Hence, the trends shown in Fig. 2 for SimI might vary among the analysed simulations as we will discuss in next sections.

3.1 Could the -enhancement clock the interaction?
As already shown for SimI, the -enhancement starts to be detected after the first close passage. However, the most significant increase is recorded after the second one. In order to analyse if the -enhancement could be used to time the interaction as suggested by Montuori et al. (2010), we study the ISM enrichment history along the interactions and its dependence on different orbital configurations.
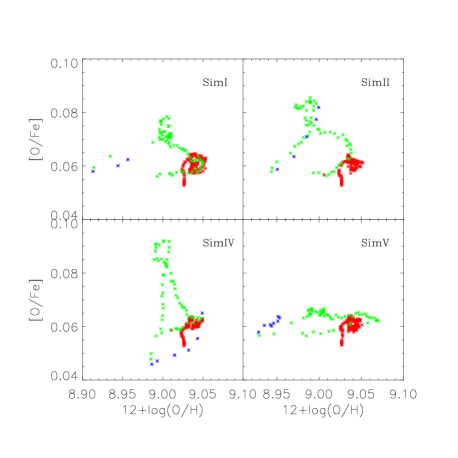
Fig. 3 shows the evolution of [O/Fe] in the central regions for different simulations with different orbital parameters: SimI, SimII and SimV. We also include SimIV which assumes a lower energy per SN event but otherwise has the same parameters as SimII. We find that before the first close passage (red points), the different simulations exhibit no significant variations in the (O/H) nor [O/Fe] values. However, different feedback parameters and orbital configurations impact differently on the ISM chemical enrichment during the interacting phase between the first two pericentres (green points). As a general result, we find an increase of the [O/Fe], except for the coplanar retrograde orbit (SimV).
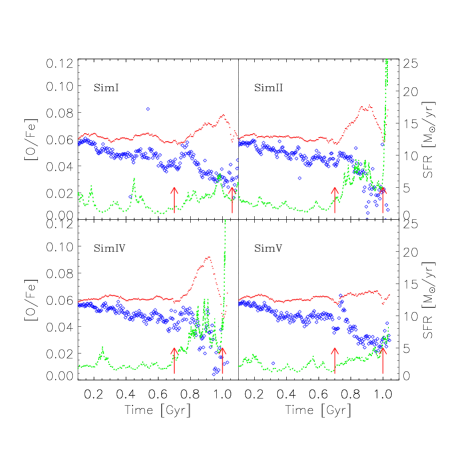
In order to understand these differences in the -enhancement, Fig. 4 shows the central -enhancement and the SFR for one of the interacting galaxies in each simulation. As expected, the central -enhancement (red dotted lines) correlates with the star formation activity (green lines). We find that between the first and the second pericentre the [O/Fe] reaches the highest values for coplanar direct orbits (SimII and SimIV), decreases as inclination increases (SimI), and is almost negligible for the coplanar retrograde interaction (SimV). Note that in agreement with previous results by Di Matteo et al. (2007), we find that coplanar direct interactions trigger stronger starburts than coplanar retrograde configurations during the pre-merger phase (see Fig. 8 of their paper). We also find that the simulation with standard feedback (SimII) has slightly lower levels of the [O/Fe] and SFR, than the case of low energy feedback (SimIV) because in the later, SN feedback drives weaker galactic outflows, being less efficient at transporting material out of the central regions.
As discussed previously by Montuori et al. (2010), the -enhancement observed in interacting galaxies before the final coalescence of systems might date the interaction. However, we find that this is valid when the -enhancement is only regulated by the star formation process. In this case, the increase of [O/Fe] during the interacting phase would indicate the occurrence of a recent starburst (approximately 1 Gyr), because the ISM have not had enough time to be heavily enriched by SNIa yet. On the contrary, the detection of a decreasing [O/Fe] value would indicate that SNIa had time to release Fe into the ISM, which means that the time elapsed since the last starburst is longer than approximately Gyr. Our simulations which follow the dynamical and chemical evolution along the interaction suggest that other factors are also involved in the regulation of the -enhancement. As can be seen for SimI, SimII and SimIV (Fig. 4), the increase in the -enhancement after the first pericentre is followed by a drop before the second pericentre. We find that this dilution of the central -enhancement is caused by the low [O/Fe] enhancement of the very important gas inflow (open blue symbols in Fig. 4), triggered during the second close approach of the galaxies. This gas inflow vanish the clear traces in the central abundances left by the star formation activity, restarting the clock to date the interaction.
Hence, our simulations suggest that the -enhancement can only indicate the proximity to the first pericentre, providing extra information on the parameters of the encounter since those with orbits close to coplanar retrograde configurations would tend to have very mild enhancement (SimV in Fig. 4). However, our findings also suggest that the chance to observe close galaxy pairs with central -enhancement might be low, because of the short time interval over which it could be detected (less than approximately 0.2 Gyr according to our experiments).
3.2 Gas-phase metallicity profiles of wet low-redshift interactions
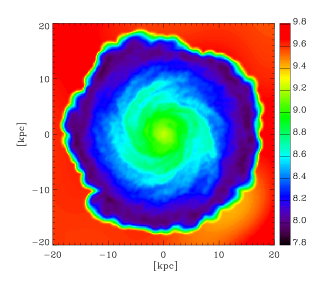
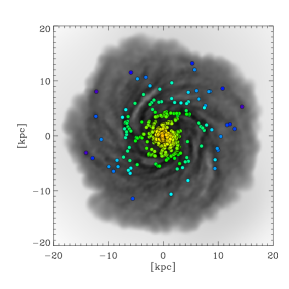
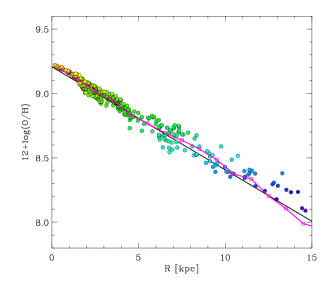
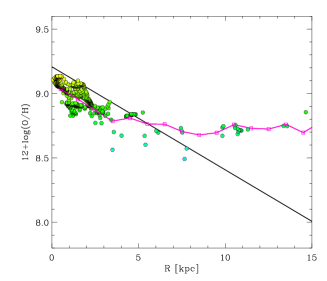
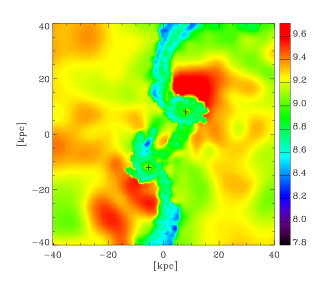
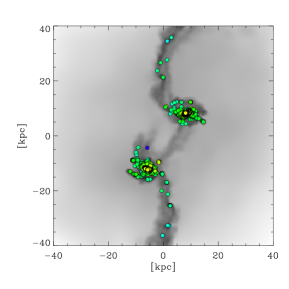
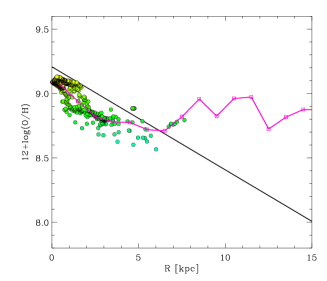
As shown in the previous section, galaxy-galaxy interactions have a clear effect on the central abundances and the star formation of wet interacting systems at low redshift caused by the dynamical perturbation induced on the gas component. In order to illustrate how this affect the gas-phase metallicity profiles, we show a sequence of oxygen abundance maps which plot the spatial distribution for the interacting galaxies of SimI at different stage of the interaction, with their corresponding oxygen abundance profiles (Fig. 5). It can be appreciated how the metallicity profile changes as the interacting system gets closer. This evolution is mainly related to the flattening of the profile caused by a decrease of central metallicities and a simultaneous increase of the abundances in the external region of the disc. We also show in Fig. 5 (right panel) that the abundance gradients computed by radial binning of all the gaseous particles are in good agreements with the gradients determined with only the abundances of star-forming regions, as it is done with observations.
3.2.1 Internal oxygen abundance profiles
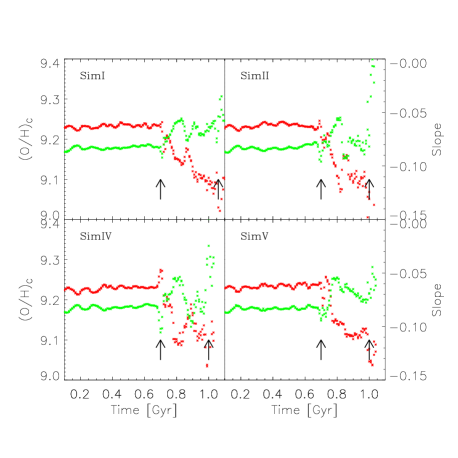
In order to quantify the evolution of internal metallicity profiles, we carry out a linear regression fit to estimate the central oxygen abundances, (O/H)C, and slopes. The internal profiles are defined in the range of 3 kpc. The inner radial limit corresponds to three times the gravitational softening used for baryons, and for the external radius, kpc corresponds to approximately three scale-lengths of the initial stellar disc.
Fig. 6 shows the linear fitting coefficients of the radial profiles for different simulations. As it can be appreciated, there is a significant evolution of internal profiles after the first pericentre, which is consistent with a central dilution of abundances as expected from the discussion of the previous subsection. In agreement with observations (Kewley et al., 2006; Rupke et al., 2008) and previous numerical works (Rupke et al., 2010a), the drop in (O/H)C is about 0.2 dex (red points). We also find that the final metallicity gradients are flatter than those in earlier stages of the interaction (green points) in agreement with Kewley et al. (2010, and references therein); Rupke et al. (2010, and references therein).
Note that although the evolution of internal profiles seems to be not very sensitive to different orbital configurations in wet major mergers at low redshift, our results show some evidence that galaxies in coplanar direct orbits (SimII and SimIV of Fig. 6) experience a larger flattening than those in coplanar retrograde ones (SimV in Fig. 6).
3.2.2 External oxygen abundance profiles
As mentioned above, the external abundance profiles rise as the galaxy interaction proceeds. This is a common feature to all simulations, hence, we will take SimI again for illustration purposes.
We define the external region of the gaseous disc as everything outside kpc, which also denotes quite well the radius where the outer profiles depart from that defined by the central region (Fig. 5). Then, we estimate the fraction of gas which has gotten into the external disc between two available time intervals, as well as the metallicity of this gas as a function of time.
As can be seen from Fig. 7a, close to each pericentre, the external disc of interacting systems receives a significant fraction of gas, principally close to the second one ( at the second pericentre). This gas comes from the inner regions of the disc as the arms get opened and distorted by tidal forces (Fig. 5). As a consequence, this gas tends to have high oxygen abundances (Fig. 7b, solid line), which partially contribute, after the first pericentre, to increase the mean external abundances by dex (Fig. 7b, dotted line). This result is in agreement with Rupke et al. (2010), who find that tidal tails transport metal-enriched gas from the galaxy inner regions to the outskirts.
On the other hand, there is new star formation activity triggered in the external regions, on the spiral arms as can be seen from Fig. 5. These new stars will also contribute with new SN II to the enrichment of the external ISM. Therefore, the evolution of the external abundances are produced by the combined effects of these two processes: i) the in situ SF activity and ii) the gas-rich material coming from inner regions as the interaction takes place and the spiral arms get distorted.

4 Metallicity evolution in wet high-redshift mergers
In previous sections, we analyse wet low-redshift interactions of galaxies with around 20 per cent of the disc in the form of gas. Here, we will discuss the metallicity evolution in interacting systems when the initial amount of gas is increased up to 50 per cent (SimVI). This scenario is suitable for studying wet galaxy encounters at high redshift.
For this simulation, we have chosen the same orbital configuration of SimII, but with a modified initial distribution of baryons in order to start with more gas-rich systems (cf. Table 1). We have also adopted the same star formation and SN parameters as for SimII. The initial abundance gradient has been adjusted to be consistent with the observations of the mass-metallicity relation at high redshift. Particularly, we used the observations of Maiolino et al. (2008) at . Hence, the initial zero point is lower and the gradient steeper than in the case of less gas-rich interactions (see Section 2).
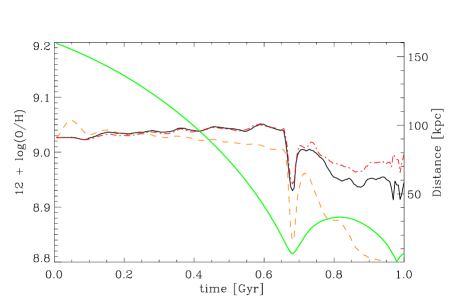
Fig. 8a shows the gas inflows for one of the galaxy members in SimVI. In this case, the amount of gas that falls into the central region is more significant than in its less gas-rich counterpart throughout the whole simulated time interval. Particularly after the second pericentre, the gas inflow roughly duplicates that of the less gas-rich interacting galaxies.
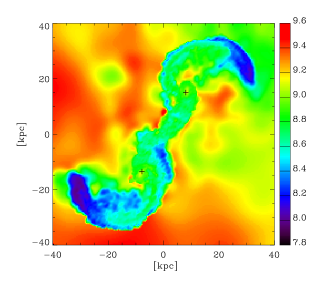
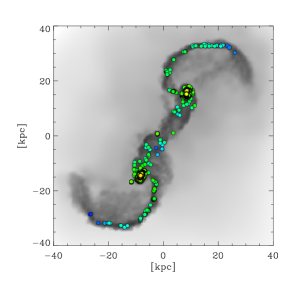
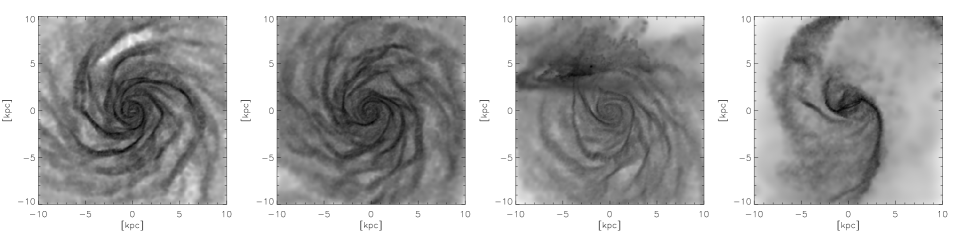
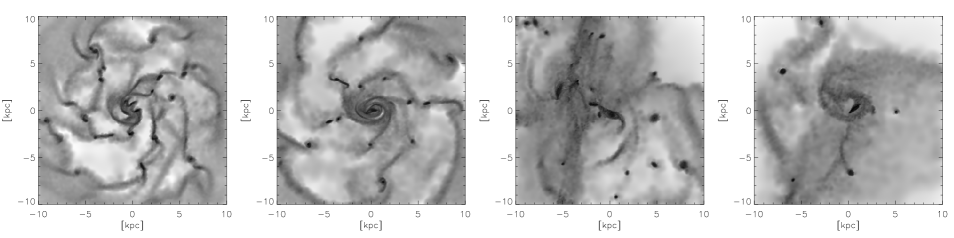
The comparison of the SFR evolution of more gas-rich galaxies (Fig. 8b) with that of their less gas-rich counterparts (Fig. 2c) shows that long before the first close passage, the SFR of the more gas-rich system is more active (around 30 Myr) than that of their less gas-rich counterpart. This is mainly due to the higher fraction of gas available for star formation. Previous works (Bournaud et al., 2007, 2008) have suggested that gas-rich galaxies might experience greater instability on the gaseous disc which can lead to an intense star formation activity via fragmentation and clump formation. In order to check this behaviour in our simulations, we compare the evolution of gaseous discs for galaxies in SimI and SimVI. Fig. 9 shows projected gas distributions of one member of the interacting system in SimI (upper panels) and in SimVI (lower panels), computed for different snapshots during the interaction. From these figures it is clear that, while the gaseous disc in the less gas-rich simulation evolves more smoothly, in the more gas-rich system it has highly fragmented and formed high density clumps where the gas satisfies the condition to form stars in agreement with previous works222Our less gas-rich simulation also shows clumps along the disc but with a significant lower level of fragmentation than in the more gas-rich counterpart. The contribution of these clumps to the SF activity in the less gas-rich mergers and a comparison with observations will be carried out in a future paper.. We checked that the Jeans mass is resolved by at least 4 gas particle so that fragmentation can be numerically described. As it can be appreciated in the first low panel, the more gas-rich system shows high level of disk fragmentation well before the first close passage at 0.3 Gyr, when the two interacting galaxies are separated by more than 100 kpc and consistent with the peak in the SFR (see Fig. 8b). This suggests that the internal fragmentation of gas-rich discs is principally driven by their own self-gravity. To prove that this early strong SF activity is not induced by the interaction, we run an isolated galaxy case with the same star formation and SN parameters. The clump formation is also present in our isolated galaxy run. Previous works have shown that galaxy interactions reinforce the level of disc fragmentation for mergers at low and high redshifts (Teyssier et al., 2010; Bournaud et al., 2011, respectively). The detailed analysis of this issue will be part of a future paper focused on clump formation in isolated and interacting disc galaxies.
After the intense SF activity reported during the early stage of interaction, the SFR in the more gas-rich galaxies begins to decline with two subsequent maxima shortly after the first and second pericentres, respectively (Fig. 8b). The induced star formation activity during the close encounters is less important than that expected considering the strong gas inflows experienced by these galaxies at these stages of evolution (Fig. 8a). We investigate which mechanism could be operating against the triggering action of gas inflows to inhibit the SF activity. We analysed the thermodynamical properties of the gas, finding that its internal energy (dotted line of Fig. 8b), increases continuously fed by the SN feedback. This process is responsible of heating up and blowing away an important fraction of gas with an increasing efficiency as the galaxy approaches the second pericentre when it loses of its initial gas mass ( is lost at the first pericentre and more than at the merging phase). As a consequence, the level of star formation activity is not only directly correlated with the strength of the gas inflows but it is also modulated by the SN feedback which is, in this simulation, more important than in the less gas-rich interactions because of the larger amount of available gas to feed star formation.
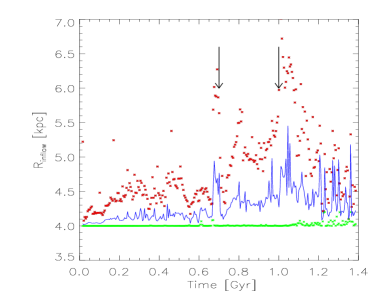
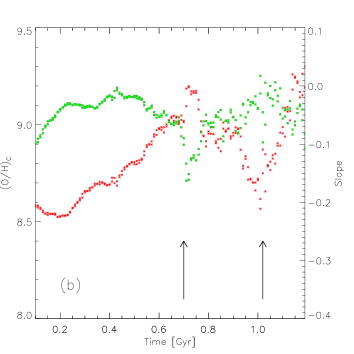
We investigate the chemical evolution of the ISM by analysing the O/H abundances and -enhancements as in the less gas-rich interactions. Fig. 8c shows the evolution of oxygen abundance of the infalling gas and of the central region. From this figure we can see that the central metallicity of the gas increases steadily up to the first pericentre. We can also appreciate that the gas inflows, driven into the central regions during the first main starburst, are increasingly oxygen-rich as a consequence of the on-going important star formation activity. This is a consequence of the first early starburst which is not present in less gas-rich interactions. However, from the first to the second pericentre, the low metallicity of the infalling gas produces the oxygen dilution of the central region just as in wet local interactions (Fig. 2b). The different levels of enrichment of these gas inflows are due to their different origins: high-metallicity inflows involved gas located nearby the central region while lower metallicity inflows come from more external ones. Since, our discs have initially metallicity gradients, these different origins imply different levels of enrichment. To visualize this, in Fig. 10 (upper panel) we show the minimum, maximum, and the median location on the disc plane of those gas particles which will be immediately incorporated into the gas inflows333The location is determined as the distance of a given particle to the center of mass just before it moves into the central region, .. Before the first pericentre most of the gas that falls into the central regions comes from about kpc and hence, is principally driven by internal dynamics while during the interactions the tidally driven gas inflows are able to transport material inward from further away regions of the disc as can be seen in Fig. 10 (upper panel).
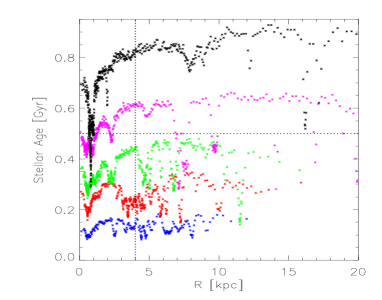
In Fig. 10 (lower panel) we show the stellar age gradients as a function of time. We can see sharp drops in the profiles as signatures of a discontinuous SF distribution along the disc, reflecting the clumpy SF activity. Profiles in blue, red, and green show the evolution of the SF distribution before the first pericentre. As shown by these profiles, the strong SF activity reported during this period (Fig. 8b) is located not only in the central region but also extended in the outskirt of the galaxy, contributing to enrich the ISM. As the interaction goes on, the main star formation activity takes place principally in the central regions which gets rejuvenated.
As a consequence of the contribution of a low-metallicity gas inflows during the close interaction (between the two first pericentres) the central O/H abundance decreases by dex (Fig. 8c, dotted line). The fact that the central oxygen abundance decreases more slowly than that of the infalling gas, at this stage of the interaction, is a consequence of the SF activity being more concentrated in the central region, continuously supplying new chemical elements via SNII events. After the second pericentre, we observe a second SFR enhancement driven by new gas inflow (Figs. 8a,b). This SF activity is very centralized in the nuclear region of the galaxy as shown in Fig. 10 (lower panel), producing the increase of the central O/H abundance (Fig. 8c, dotted line).
Finally, we also investigate the -enhancement of wet encounters at high redshift. Fig. 8d shows that the initial [O/Fe] value is consistent with the -enhancement observed in less gas-rich interactions (Fig. 2d). The subsequent evolution of the -enhancement shows that immediately after the second pericentre and simultaneously to the SFR enhancement, the central [O/Fe] (Fig. 8d, dotted line) exhibits a sharp increase produced by the important increase of SNII feedback associated to the more active central SF. After this -enhancement, we find a significant drop in the central [O/Fe] values of around 0.8 dex. This drop is caused by the injection of Fe elements into the ISM by SNIa, whose progenitors formed 1 Gyr before, during the main starbursts.

4.1 Oxygen abundance profiles of wet interactions at high redshift
In this section, we quantify the effect of wet interactions at high redshift on the gas-phase metallicity profiles. Similarly to the case of wet interactions in the local Universe, the evolution of metallicity profiles in the more gas-rich interacting galaxies show a clear flattening and the central dilution of O/H abundances. We quantify the evolution of the metallicity profiles by performing linear regressions. Fig. 11 shows the (O/H)C and slopes as a function of time (red and green points, respectively).
As expected, we find that the evolution of (O/H)C matches that of the central abundances computed within (see dotted line of Fig. 8c). We can see an increase of the (O/H)C in around 0.6 dex during the approaching phase while after the first pericentre, the decrease reflects the impact of the low-metallicity inflows driven by the interactions. These low-metallicity inflows produce a decrease of dex in the oxygen central abundance while in less gas-rich counterparts, the decrease is of dex towards the final merging stage (Fig. 6).
The evolution of the gradients shows an approximately constant slope until the first pericentre where the profiles get more negative as a result of the oxygen carried into the central region by the early metal-rich inflows. However, from the first pericentre there is a continuous mean flattening of the metallicity profiles which gets even slightly positive around the second pericentre where again, it starts to be get steeper toward more negative values as more oxygen is pumped in by SNII produced during the second tidally-induced starburst (see Fig. 8b).
5 Discussion
Several interesting aspects remain to be understood or even acknowledged in galaxy interactions and their impact on chemical properties. Numerical simulations are, indeed, the most suitable tool to study them. Different authors with different techniques and levels of complexity have made important contributions (e.g. Perez et al., 2006; Rupke et al., 2010a; Montuori et al., 2010) to this area over the last years. All works agree to show the central abundance dilution due to low-metallicity inflows triggered during the interaction.
Our simulations allow us to contribute further to explore the role played by the induced SF and SN feedback in modulating the strength of this metallicity dilution and the evolution of the metallicity gradients. Particularly, we run SimIII which only follows the dynamics of the gas with fixed metallicity assigned according to an initial abundance profile. No new star formation activity is permitted in SimIII. As it can be appreciated by comparing the evolution of the central oxygen abundances in SimII and SimIII in Fig. 12, neglecting the subsequent star formation and chemical enrichment leads to an overestimation of the metallicity dilution (and flattening of the gradients).
One of the effects of star formation is the generation of new SN II which contributes with new chemical elements and also pumps energy into the ISM. The strongest the gas inflows, the strongest the starbursts and consequently, the impact of SN feedback which can heat up and blow away significant fractions of the remaining enriched gas, regulating the subsequent star formation activity and modulating the chemical enrichment. In SimIV we use a lower energy input for SN event and thus, reducing the impact of energy feedback. As a consequence, a more intense star formation can develop producing a higher chemical enrichment than in SimII. From Fig. 12 we can see that the central oxygen abundance is very similar to that of SimII until the first pericentre while after that, the mean oxygen abundance in SimIV is larger since the impact of the mass-loaded outflows are weaker and are not so efficient at transporting material outside the central region and at inhibiting the star formation activity (the effects on the star formation rate, -enhancement and metallicity profiles can be visualized comparing results from SimII and SimIV in Figs. 3, 4, and 6). Hence, it is important to model the on-going star formation activity in a self-consistent way with energy and chemical SN feedback in order to have a more comprehensive picture of the evolution of the metallicity and gradients during galaxy interactions.
As a consequence of this complex interplay of various physical processes, we find that some a priory obvious correlations are actually difficult to detect. One example of this is the use of -enhancement to clock the interaction as we have already discussed in Section 3.1. Another expected correlation is that between the strength of the central starbursts and the metallicity dilution. In Fig. 13 we plot the slopes of the metallicity gradients and the central oxygen abundances as a function of star formation rate for wet low-redshift interactions. We can see that globally there is a correlation so that the highest the star formation rate, the strongest the metallicity dilution and the shallower the abundance profiles. However, the relations depend strongly on the orbital parameters. SimI and SimV have weaker starbursts than SimII but nevertheless, they experienced metallicity dilution in the central regions due to the tidally-induced gas inflows. Hence, according to our findings, it might be difficult to establish this correlation observationally where galaxy pairs can be observed at different stages of evolution and with a variety of orbital parameters.
Regarding the gas-richness, from Fig.11 we can see that, although there is a global trend in diluting central metallicity and in flattening the mean gradients, there are also fluctuations which correlate with the triggering of inflows and the injection of fresh oxygen by the new SN II. Nevertheless, the mean metallicity dilution is stronger than the less gas-rich counterpart (Fig. 6). Hence, the gas-richness is another key factor.
Depending on the astrophysical properties and orbital parameters, galaxies in pairs can be located differently on the mean mass-metallicity relation depending on the stage of the interaction at which they are observed. This effect might be particularly relevant for the study of high redshift galaxies and could be at the origin of the apparent increase with redshift of the scatter in the mass-metallicity relation. It could also explain the presence of outliers in the local mass-metallicity relation. For example, more gas-rich systems observed just as they are first approaching might be dominated by the massively and clumpy star formation activity taking place at all radii, before the interaction can actually trigger larger scale inflows capable to transport low-metallicity gas into the central region. Hence, these galaxies might show an excess of oxygen (e.g. Michel-Dansac et al., 2008).


6 Conclusion
By using hydrodynamical simulations of interacting pre-prepared galaxies of comparable masses, we study the chemical evolution of the interstellar medium during the interactions. Our simulations include self-consistently, SN feedback and a detailed chemical model, which allows us to follow the evolution of the gas-phase metallicity from the initial to the final stages of an interaction. These simulations constitute a unique set to study the effects of interactions on chemical properties.
We analyse the different chemical response to galaxy interactions, varying orbital configurations, strength of energy SN feedback and initial gas fractions in the galaxy discs. Particularly, we focused our study on wet interactions in the local Universe. For comparison, we also analysed a more gas-rich interaction in order to reproduce wet mergers typical of high redshift.
Our main results can be summarized as follows:
1) We find that a low-metallicity gas inflow developed from the first close passage dilutes the central oxygen abundance and triggers starbursts at the first and second pericentre. We find that the amplitude of the central oxygen dilution of close galaxy pairs is fairly consistent with observations. This dilution is observed with a large scatter for interacting systems separated less by than 30 kpc. The amplitude varies according to orbital configurations and phases of interactions.
During the interactions the metallicity gradients get quite shallower with fluctuations, such as sometimes they are a slightly positive gradient. Both the release of new chemical elements and energy by SNII, produced during the tidally-induced starburst, modulates the strength of the central dilution and the metallicity gradients. This behaviour seems in good agreements with what it is observed for galaxy pairs (observations by Kewley et al., 2006, 2010). We note that it is not possible from these simulations to test the claims of Cresci et al. (2010) since our boundary conditions are not consistent with a cosmological scenario where gas accretion from the intergalactic medium can fuel the galaxies.
2) We find an increase of the interstellar [O/Fe] values, observed after the first pericentre as suggested by previous works. This -enhancement does not only reflect the tidally-induced star formation activity but is also affected by galactic outflows and the abundances of the gas inflows. As a consequence, we show that the -enhancement can only indicate the proximity to the first pericentre and in those encounters with non coplanar retrograde orbits. After the first pericentre, gas inflows might dilute the central [O/Fe] values, erasing the trace left by the star formation activity, and restarting the clock to date the interaction. We also notice that the period of time where this enhancement could be observed is quite short Gyr).
3) More gas-rich interactions show massive and clumpy star formation on the disc from early stages of the interaction. During the interaction, from the first pericentre to the final stages, we find similar behaviours as in the case of the less gas-rich runs with the particularities imprinted by the more gas availability. Gas-richness has an impact on the strength of low-metallicity gas inflows which in the simulated interaction, are able to dilute the central abundances by dex, a factor of 2.5 larger than in its less gas-rich counterpart. There are important variations in the central abundances and gradients as the interaction of more gas-rich galaxies proceeds due to the competition between various processes, such as the injection of new chemical elements after starbursts, the action of outflows which blow away part of the enriched material, and the gas dynamics of clumpy discs.
4) We find a correlations between the metallicity gradient, the central chemical abundance and the strength of the star formation activity. However, the slope and scatter of these correlations depend on orbital parameters, SN outflows and gas-richness. Hence, it is not a simple relation which can be easily unveiled observationally. The metallicity gradients are affected by the strength of the central nuclear starbursts and the extended star formation detected in the outer regions of the galaxies. Star formation in clumps are also found to play a role in modulating the metallicity gradients. A detailed analysis of disc fragmentation as a function of gas richness will be carried out in a forthcoming paper.
Our results suggest that metallicity evolution is closely related to gas dynamics during the encounters. Denying processes that affects the gas dynamics and its level of enrichment such as star formation and SN feedback, can contribute either to overestimate or underestimate the effects on the central abundance dilution or metallicity gradients. These findings show that there are still many issues to be addressed in galaxy interactions and their role in chemical evolution.
Acknowledgments
We thank the referee, F. Bournaud, for a constructive report. PBT thanks ISIMA 2010 for the hospitality and challenging environment which allowed part of this work to be done. This work was partially supported by the Consejo Nacional de Investigaciones Científicas y Técnicas (PIP 2009/0305), Agencia Nacional de Promoción Científica y Técnica (PICT 32342 (2005)), Max Planck 245 (2006), the Agence Nationale de la Recherche (ANR-08-BLAN-0274-01).
References
- Alonso et al. (2006) Alonso M. S., Lambas D. G., Tissera P., Coldwell G., 2006, MNRAS, 367, 1029
- Sol Alonso et al. (2010) Sol Alonso M., Michel-Dansac L., & Lambas D. G. 2010, A&A, 514, A57
- Barnes & Hernquist (1996) Barnes J. & Hernquist L. 1996, ApJ, 471, 115
- Barton et al. (2000) Barton E. J., Geller M. J., & Kenyon S. J. 2000, ApJ, 530, 660
- Bournaud et al. (2007) Bournaud, F., Elmegreen, B. G., & Elmegreen, D. M. 2007, ApJ, 670, 237
- Bournaud et al. (2008) Bournaud, F., et al. 2008, A&A, 486, 741
- Bournaud et al. (2011) Bournaud, F., et al. 2011, ApJ, 730, 4
- Cox et al. (2008) Cox, T. J., Jonsson, P., Somerville, R. S., Primack, J. R., & Dekel, A. 2008, MNRAS, 384, 386
- Cresci et al. (2010) Cresci, G., Mannucci, F., Maiolino, R., Marconi, A., Gnerucci, A., & Magrini, L. 2010, Nature, 467, 811
- De Rossi et al. (2010) De Rossi, M. E., Tissera, P. B., Pedrosa, S. 2010 A&A, 519, 89
- Di Matteo et al. (2007) Di Matteo P., Combes F., Melchior A.-L., & Semelin B. 2007, A&A, 468, 61
- Di Matteo et al. (2008) Di Matteo P., Bournaud F., Martig M., Combes F., Melchior A.-L., & Semelin B. 2008, A&A, 492, 31
- Dutil & Roy (1999) Dutil Y., & Roy J.-R. 1999, ApJ, 516, 62
- Ellison et al. (2008) Ellison S. L., Patton D. R., Simard L., & McConnachie A. W. 2008, AJ, 135, 1877
- Ellison et al. (2010) Ellison, S. L., Patton, D. R., Simard, L., McConnachie, A. W., Baldry, I. K., & Mendel, J. T. 2010, MNRAS, 407, 1514
- Hopkins et al. (2009) Hopkins, P. F., Cox, T. J., Younger, J. D., & Hernquist, L. 2009, ApJ, 691, 1168
- Kewley et al. (2006) Kewley L. J., Geller M. J., & Barton E. J. 2006, AJ, 131, 2004
- Kewley et al. (2010) Kewley L. J., Rupke D., Jabran Zahid H., Geller M. J., & Barton E. J. 2010, ApJL, 721, L48
- Khochfar & Burkert (2006) Khochfar, S., Burkert, A. 2006, A&A, 445, 403
- Lambas et al. (2003) Lambas D. G., Tissera P. B., Alonso M. S., & Coldwell G. 2003, MNRAS, 346, 1189
- Maiolino et al. (2008) Maiolino R., et al. 2008, A&A, 488, 463
- Michel-Dansac et al. (2008) Michel-Dansac L., Lambas D. G., Alonso M. S., & Tissera P. 2008, MNRAS, 386, L82
- Mihos & Hernquist (1996) Mihos J. C. & Hernquist L. 1996, ApJ, 464, 641
- Montuori et al. (2010) Montuori M., Di Matteo P., Lehnert M. D., Combes F., & Semelin B. 2010, A&A, 518, A56
- Mosconi et al. (2001) Mosconi M. B., Tissera P. B., Lambas D. G., & Cora S. A. 2001, MNRAS, 325, 34
- Moustakas et al. (2010) Moustakas J., Kennicutt R. C., Tremonti C. A., Dale D. A., Smith J.-D. T., & Calzetti D. 2010, ApJS, 190, 233
- Nikolic et al. (2004) Nikolic B., Cullen H., & Alexander P. 2004, MNRAS, 355, 874
- Patton et al. (2011) Patton, D. R., Ellison, S. L., Simard, L., McConnachie, A. W., & Mendel, J. T. 2011, MNRAS, 14
- Peeples et al. (2009) Peeples M. S., Pogge R. W., & Stanek K. Z. 2009, ApJ, 695, 259
- Perez et al. (2006) Perez M. J., Tissera P. B., Scannapieco C., Lambas D. G., & de Rossi M. E. 2006, A&A, 459, 3
- Rupke et al. (2008) Rupke D. S. N., Veilleux S., & Baker A. J. 2008, ApJ, 674, 172
- Rupke et al. (2010a) Rupke, D. S. N., Kewley, L. J., & Barnes, J. E. 2010a, ApJL, 710, L156
- Rupke et al. (2010) Rupke, D. S. N., Kewley, L. J., & Chien, L.-H. 2010b, ApJ, 723, 1255
- Sawala et al. (2011) Sawala, T., Guo, Q., Scannapieco, C., Jenkins, A., White, S.D.M., 2011 MNRAS, in press
- Scannapieco et al. (2005) Scannapieco C., Tissera P. B., White S. D. M., & Springel V. 2005, MNRAS, 364, 552
- Scannapieco et al. (2006) Scannapieco C., Tissera P. B., White S. D. M., & Springel V. 2006, MNRAS, 371, 1125
- Scannapieco et al. (2008) Scannapieco C., Tissera P. B., White S. D. M., & Springel V. 2008, MNRAS, 389, 1137
- Scannapieco et al. (2011) Scannapieco C., White S. D. M., Springel V. & Tissera P. B. 2011, arXiv1105.0680S
- Sérsic & Pastoriza (1967) Sérsic J. L., & Pastoriza M. 1967, PASP, 79, 152
- Springel (2005) Springel V. 2005, MNRAS, 364, 1105
- Teyssier et al. (2010) Teyssier, R.; Chapon, D. & Bournaud, F. 2010, ApJ 720, 149
- Thielemann et al. (1993) Thielemann, F.-K., Nomoto, K., & Hashimoto, M. 1993, Origin and Evolution of the Elements, 297
- Tinsley & Larson (1978) Tinsley B. M., & Larson R. B. 1978, ApJ, 221, 554
- Tissera (2000) Tissera P. B. 2000, ApJ, 534, 636
- Toomre & Toomre (1972) Toomre A. & Toomre J., 1972, ApJ 178, 623
- Tremonti et al. (2004) Tremonti C. A. et al. 2004, ApJ, 613, 898
- Woods et al. (2006) Woods, D. F., Geller, M. J., & Barton, E. J. 2006, AJ, 132, 197
- Woosley & Weaver (1995) Woosley S. E., & Weaver T. A. 1995, ApJS, 101, 181
- Zaritsky et al. (1994) Zaritsky D., Kennicutt R. C., Jr., & Huchra J. P. 1994, ApJ, 420, 87