A polarized neutron diffraction study of the field-induced magnetization in the normal and superconducting states of Ba(Fe1-xCox)2As2 (=0.65)
Abstract
We use polarised neutron diffraction to study the induced magnetization density of near optimally doped Ba(Fe0.935Co0.065)2As2 (=24 K) as a function of magnetic field ( T) and temperature ( K). The -dependence of the induced moment in the superconducting state is consistent with the Yosida function, characteristic of spin-singlet pairing. The induced moment is proportional to applied field for . In addition to the Yosida spin-susceptibility, our results reveal a large zero-field contribution which does not scale with the field or number of vortices and is most likely due to the van Vleck susceptibility. Magnetic structure factors derived from the polarization dependence of 15 Bragg reflections were used to make a maximum entropy reconstruction of the induced magnetization distribution in real space. The magnetization is confined to the Fe atoms and the measured density distribution is in good agreement with LAPW band structure calculations which suggest that the relevant bands near the Fermi energy are of the and type.
pacs:
74.70.Xa, 74.25.Jb, 74.25.N-, 75.25.-jI Introduction
The discovery of superconductivity in iron-based materials such as LaO1-xFxFeAs Kamihara et al. (2008) has ignited intense interest in this field. The common features of the iron-based superconductors appear to be that they are semi-metals which have electron and hole Fermi surface pockets, separated by a wavevector Guo . Experiments have demonstrated the existence of strong spin excitations with this same wavevector for superconducting compositions. It is widely believed that iron-based superconductivity is mediated by these spin excitations resulting in superconducting states such as , where the sign of the gap changes between different Fermi surface sheets.
Of particular interest in the iron-based superconductors is the structure of the superconducting gap and the nature of the low-energy electronic states. Penetration depth Fletcher et al. (2009) and thermal conductivity studies Reid et al. (2010) of a number of materials (e.g. LaFePO, KFe2As2 and BaFe2(As1-xPx)2) show evidence for low-energy quasiparticle excitations which could be due to nodes in the superconducting order parameter.
Ba(Fe1-xCox)2As2 is a good system to study since it is possible to grow large single crystals with homogeneous doping. It has been studied widely by various probes including angle-resolved photoemission spectroscopy (ARPES) Terashima et al. (2009), scanning tunnel microscopy (STM) Yin et al. (2009), penetration depth Gordon et al. (2010); Luan et al. (2011), SR Williams et al. (2009), heat capacity Gang et al. (2010); Gofryk et al. (2011) and thermal conductivity Reid et al. (2010). Even in this single system, different gap characters have been proposed as a function of doping, including fully and nodally gapped structures Terashima et al. (2009); Yin et al. (2009); Gordon et al. (2010); Williams et al. (2009); Gang et al. (2010); Gofryk et al. (2011); Reid et al. (2010).
Here we use half-polarized neutron diffraction to measure the susceptibility and induced magnetization in the normal and superconducting states of near optically doped Ba(Fe1-xCox)2As2 (). Our measurements shed light on the electronic structure and the nature of the low energy electronic states in both phases. By measuring the flipping ratios of a number of Bragg peaks, we are able to extract the spatial Fourier components of the induced magnetization density . In a metal, this provides information about the electronic states near the Fermi energy. We compare our results with a band structure calculation. In addition to measuring the , we also made a detailed study of the temperature and magnetic field dependence of the induced magnetization by measuring a single Bragg peak in detail.
The paper is organised as follows. In Sec. II we introduce the polarized beam method used in our experiment and report our unpolarized structural refinement of Ba(Fe1-xCox)2As2 (). In Sec. III we report our determination of the real space magnetization density induced by an applied magnetic field. We also present the results of a LAPW calculation of the magnetization density distribution. In Sec. IV, we report measurements of the induced magnetization in the superconducting state as a function of magnetic field and temperature. We discuss the significance of our observations with respect to the superconductivity in Ba(Fe1-xCox)2As2 () and other experimental results. This is followed by a summary of our conclusions.
II Background
II.1 Polarized Neutron Diffraction Studies of the Induced Magnetization
Polarized neutron scattering experiments can directly measure the real-space magnetization density in the unit cell, induced by a large magnetic field . Due to the periodic crystal structure, the applied magnetic field induces a magnetization density with spatial Fourier components , where are the reciprocal lattice vectors, such that
| (1) |
and is the volume of the unit cell. The Fourier components of the magnetization density are given by
| (2) |
Neutrons interact with matter through the strong nuclear force and electromagnetic interaction. For neutrons with initial and final spin polarisations and , the total scattering cross section is
| (3) | |||||
where m and is the nuclear structure factor. The sign of the first (magnetic) term in Eq. 3 can be changed by reversing the incident neutron polarization. Thus we are able to isolate the interference term between the nuclear and magnetic scattering. In this experiment we measure the flipping ratio , defined as the ratio of the cross-sections with neutrons parallel and anti-parallel to the applied magnetic field. Because the induced moment is small, the experiment is carried out in the limit . In this limit, the flipping ratio derived from Eq. 3 is,
| (4) |
As the nuclear structure factors are known from the crystal structure, Eq. 4 directly gives .
II.2 Experimental Details
The Ba(Fe1-xCox)2As2 () single crystal used in this study was prepared by a self-flux method Chu et al. (2009), had approximate dimensions 6 1.5 0.2 mm3 and a mass of 1.8 mg. Similar samples were used in our previous studies Lester et al. (2009, 2010). Resistivity and magnetization measurements on crystals from the same batch identified the superconducting transition temperature (onset)=24 K and showed no evidence of magnetic order down to 2 K. The bulk susceptibility in a 5 T field measured using a SQUID magnetometer was T-1 f.u.-1. We note that the expected upper critical field applied in the plane for this composition is 55 T Kano et al. (2009).
Neutron scattering experiments were performed at the Institut Laue-Langevin, Grenoble, France. An initial unpolarized structural refinement was performed using the 4-circle D9 spectrometer with Å. The results are shown in Table 1.
| Atom | Position in I4/mmm | B (Å2) | ||
|---|---|---|---|---|
| Ba | 2a | 0.023(16) | ||
| Fe/Co | 4d | 0.110(10) | ||
| As | 4e | 0.083(11) | ||
| =22.4(1.2) rad-1 | ||||
Polarized beam measurements of the flipping ratio were made on the D3 spectrometer. The sample was mounted on a thin aluminium post with the direction vertical and parallel to the applied field. Data was collected with an incident wavelength Å and a 0.5 mm Er filter (to reduce higher order contamination in the incident beam). Flipping ratios for equivalent reflections were collected, averaged and corrected for the finite beam polarization and extinction effects. The sample was cooled through at each field measured when collecting data in the superconducting state.
III Induced Magnetization Distribution
III.1 Results
| (Å-1) | (fm f.u.-1) | (m f.u.-1) | ||||
|---|---|---|---|---|---|---|
| 2 | 2 | 0 | 0.3611 | 0.83 0.3 | 36.16 | 3.1 0.9 |
| 0 | 0 | 2 | 0.0780 | 4.98 0.3 | -16.88 | -10.0 0.5 |
| 1 | 1 | 2 | 0.1967 | 3.75 0.5 | 19.93 | 7.5 0.8 |
| 2 | 2 | 2 | 0.3694 | 1.90 0.6 | -16.54 | -3.1 1.0 |
| 0 | 0 | 4 | 0.1560 | 6.49 0.5 | 12.19 | 8.0 0.6 |
| 1 | 1 | 4 | 0.2386 | 3.08 0.5 | -24.46 | -7.6 1.1 |
| 2 | 2 | 4 | 0.3933 | 0.8 1.3 | 12.04 | 0.9 1.5 |
| 1 | 1 | 6 | 0.2956 | 1.61 0.2 | 32.68 | 5.5 0.9 |
| 0 | 0 | 8 | 0.3120 | 1.58 0.4 | 29.32 | 4.9 0.8 |
| 2 | 2 | 8 | 0.4772 | 1.18 0.7 | 28.90 | 1.8 1.5 |
| 0 | 0 | 10 | 0.3900 | 1.12 0.5 | -25.57 | -2.8 1.2 |
| 1 | 1 | 10 | 0.4298 | 4.52 1.2 | 10.42 | 4.4 1.2 |
| 2 | 2 | 10 | 0.5315 | 3.60 2.9 | -25.11 | -1.1 2.2 |
| 0 | 0 | 12 | 0.4681 | 0.72 0.6 | 23.42 | 2.9 1.2 |
| 1 | 1 | 12 | 0.5017 | 3.29 4.5 | -12.16 | -4.6 1.9 |
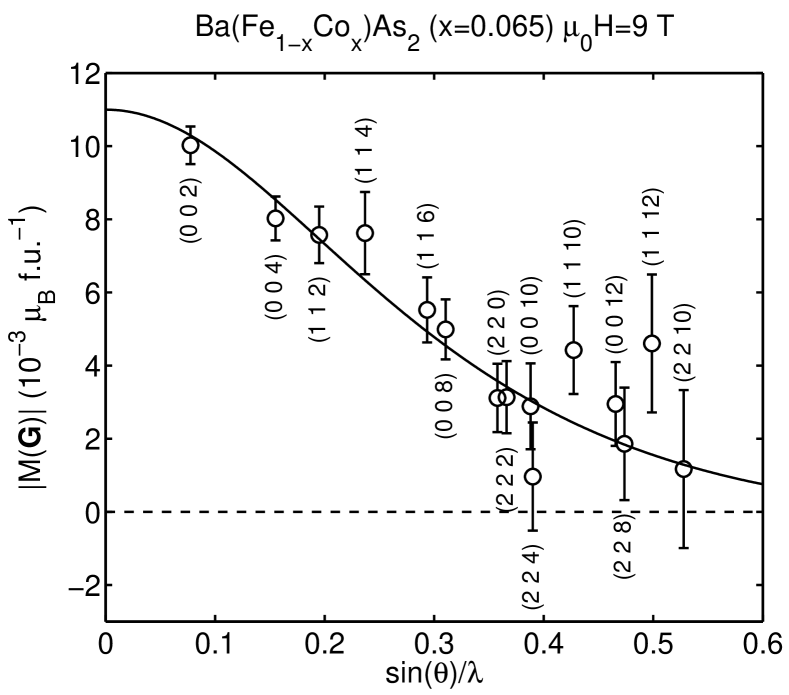
We measured the magnetization induced by a 9 T magnetic field applied along the direction in the normal state at =30 K. Table 2 shows the measured flipping ratios under these conditions and the extracted Fourier components of the magnetization density. Fig. 1 shows plotted against . If Fe were the only magnetic atom, then the sign of is determined by the geometric structure factor for the Fe atoms and is the effective form factor of the Fe atom. The solid line in Fig. 1 is the standard calculated isotropic atomic form factor for Fe2+ Brown (1992). Deviations from an isotropic form factor are expected at larger or . Our results are in broad agreement with a recent study of Ba(Fe1-xCox)2As2 Prokes et al. (2011). The main differences between the present data and the data presented in Ref. Prokes et al., 2011 are: (i) the present study has higher statistical accuracy (ii) the value of for =(002) is larger relative to the other points in the present study. Our extinction model shows that the (002) peak has the largest extinction correction factor of 1.26.
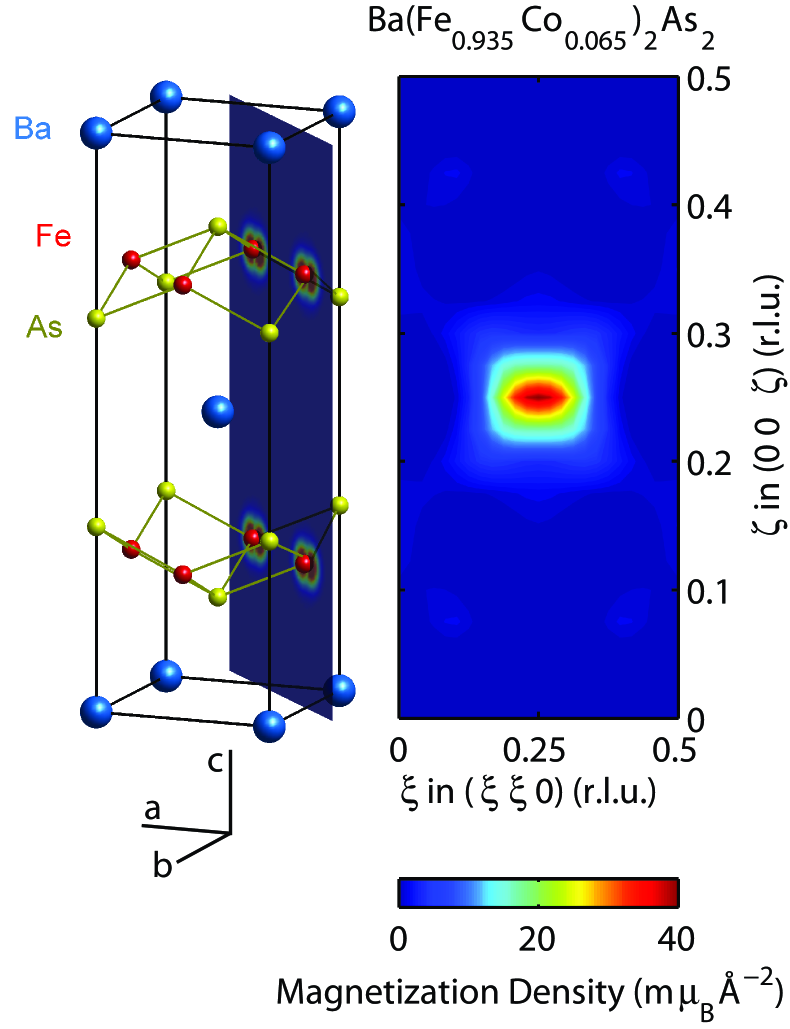
We used the maximum entropy method (MaxEnt) Ski ; Papoular and Gillon (1990); Gul ; Brown et al. (2010) to make a model-free reconstruction of the magnetization density in real space. Flipping ratios for reflections of the type were collected, this allowed the reconstruction of the magnetization density projected down the direction onto the plane as illustrated in the left panel of Fig. 2. The result of the reconstruction is shown in the right panel of Fig. 2. As expected, the magnetization density is localized mostly on the Fe atoms. The magnetization “cloud” appears to be slightly extended along the directions. Our results are in broad agreement with Ref. Prokes et al. (2011), however we observe no significant magnetization density on the Ba sites. A recent study of the paramagnetic state of the parent antiferromagnet BaFe2As2 Brown et al. (2010) is also broadly consistent with our results. The main difference in the BaFe2As2 case is that the magnetization extends more towards the As atoms.
III.2 Electronic Structure Calculations
Induced form factor measurements have been widely used to determine the nature of the electrons responsible for paramagnetism in solids. In metals, the induced magnetization arises from a redistribution of electrons between up and down states near the Fermi energy. Thus, we probe the nature of the electronic wavefunctions for states near the Fermi energy. In order to understand our results further, we have carried out electronic structure calculations using the WEIN2k package Bla .
The linear augmented plane-wave (LAPW) method Sin was used to obtain the electronic structure and spin density of Ba(Fe1-xCox)2As2 (). We used a full-potential LAPW method with the generalized gradient approximation (GGA). In the case of doped compositions, we used the virtual crystal approximation (VCA) Nordheim (1931). We used the lattice parameters and atom position for the Ba(Fe1-xCox)2As2 structure shown in Table. 2 for both compositions. The muffin-tin radii were chosen to be 2.5, 2.37 and 2.11 atomic units (a.u.) for Ba, Fe and As respectively, with the quantity set to 7, where is the smallest muffin-tin radius and is the plane wave cutoff. For integrations we used 726 -points in the irreducible Brillouin zone. In the LAPW method, the charge (spin) density is represented by a plane wave expansion in the interstitial region and as a combination of radial functions times spherical harmonics inside the muffin-tin spheres.
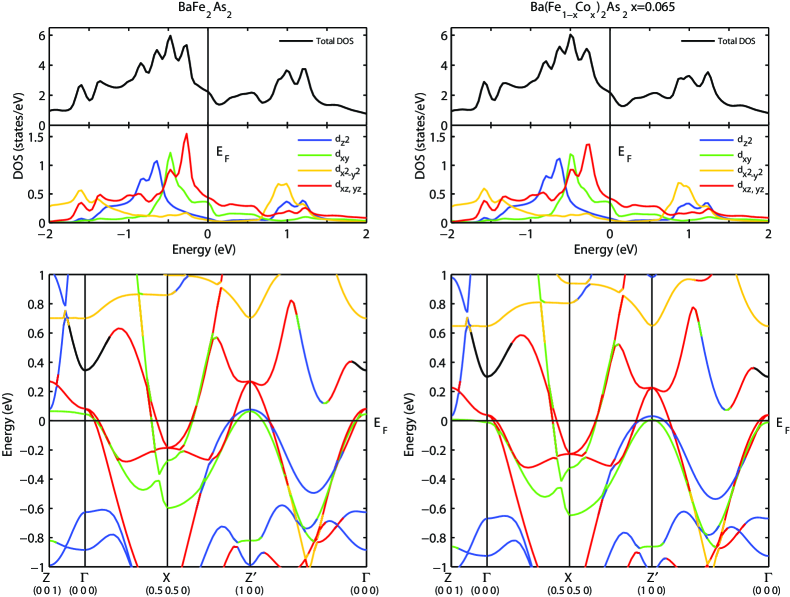
Fig. 3 shows the bandstructure calculated in the tetragonal phase for Ba(Fe1-xCox)2As2 for =0 and =0.065. Our calculations generally agree with others in the literature Singh (2008); Thirupathaiah et al. (2010); Andersen and Boeri (2011); Colonna et al. (2011), in particular, they show that the states near the Fermi energy are predominately of and character.
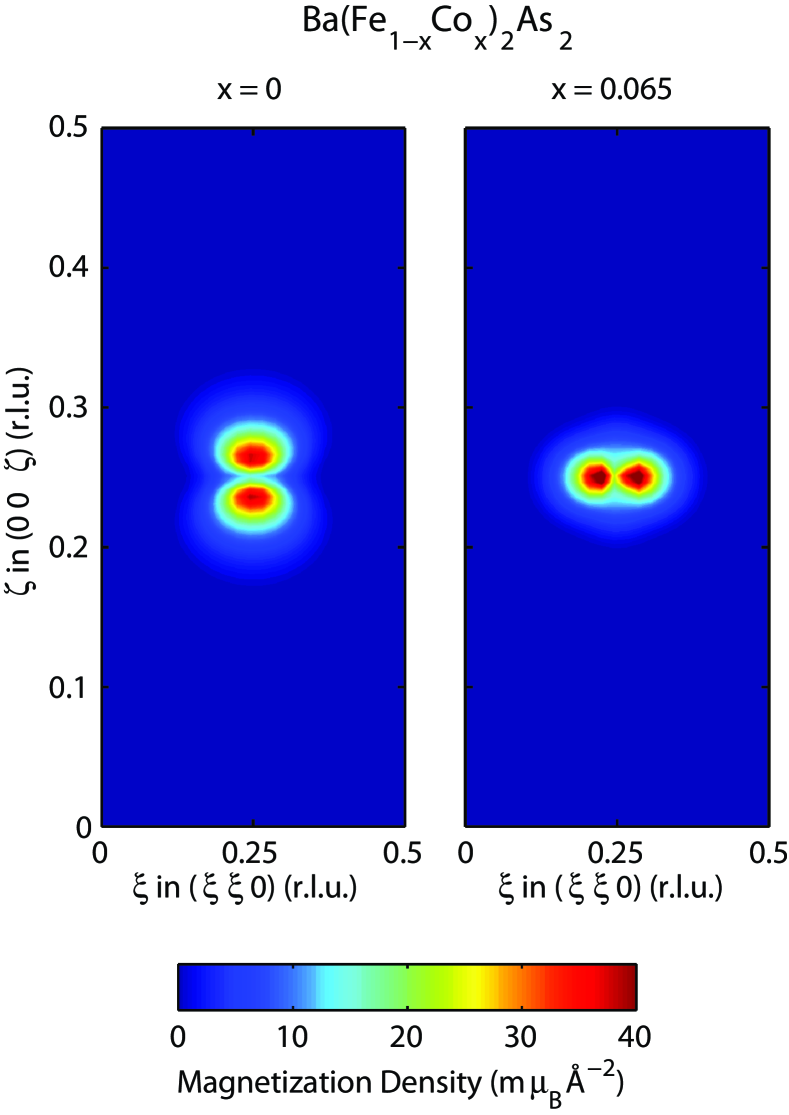
Spin polarized calculations were carried out in the tetragonal state with the ferromagnetic magnetization constrained to be 0.01 per unit cell to mimic the effect of an applied magnetic field. The results were then scaled to the measured magnetization at 9 T for comparison purposes. The results are shown in Fig. 4. The calculation shows reasonable agreement with our maximum entropy reconstruction in that the magnetization density is extended along the direction. However, the reconstruction from our experimental data does not show the two maxima along predicted in the calculation. This is presumably because our data have insufficient Fourier components to resolve these features. We also carried out a calculation for BaFe2As2 () in the paramagnetic tetragonal state with the same structural parameters (but no Co potential) to demonstrate the sensitivity of the magnetization distribution to the bandstructure. Notice that the change in electronic structure between and causes a rotation of the calculated pattern in Fig. 4.
IV Temperature and Field Dependence of the Magnetization
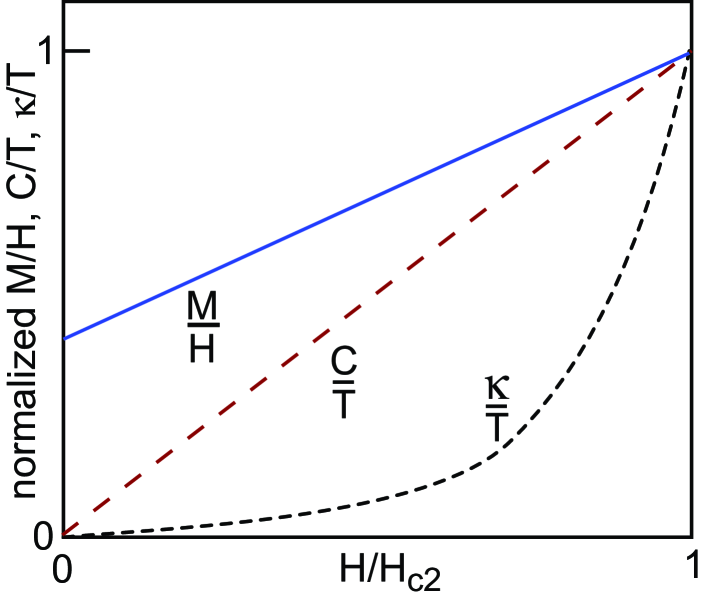
The measurement of the field and temperature dependence of bulk magnetization in the mixed state of a superconductor provides information about the nature of the superconductive pairing. Thermal conductivity Reid et al. (2010) and specific heat measurements Moler et al. (1997) in the mixed state have been extremely useful in probing the low energy quasi particles and identified the gap structure of a number of superconductors. In particular, the field dependence of the electronic contributions to and in the limit is sensitive to the symmetry of the superconducting gap function Shakeripour et al. (2009) (see Fig. 5).
Complementary information is contained in . However, studies of the bulk magnetization in the mixed state of superconductors are not possible by conventional means, e.g. SQUID magnetometery, because of the presence of a large diamagnetic contribution. Polarized neutron diffraction and NMR Knight shift measurements Ning et al. (2008); Oh et al. (2011) can be used to make magnetization measurements in the mixed state. The polarized neutron diffraction technique used here is unique because it directly measures the total magnetization including spin and orbital contributions. This technique was first used by Shull and Wedgwood in 1963 to study V3Si Shull and Wedgwood (1966) and has subsequently been applied to such varied superconductors as UPt3 Stassis et al. (1986), YBa2Cu3O7-δ Boucherle et al. (1993) and Sr2RuO4 Duffy et al. (2000).
IV.1 Results
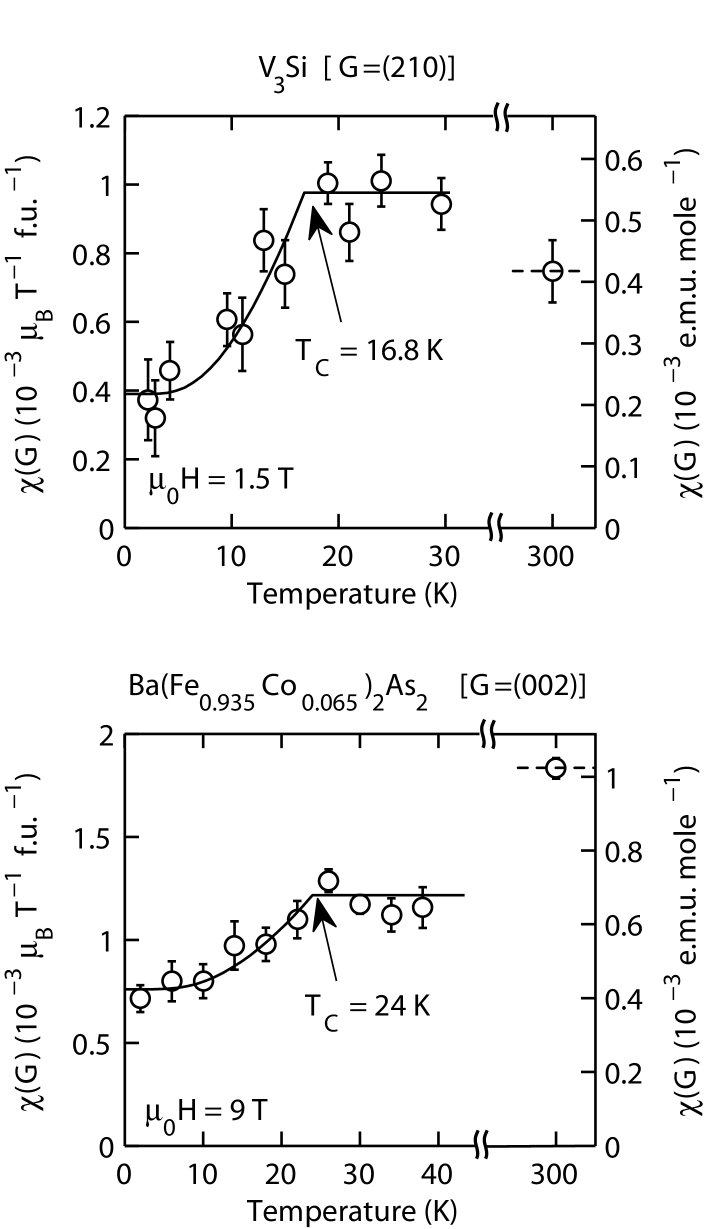
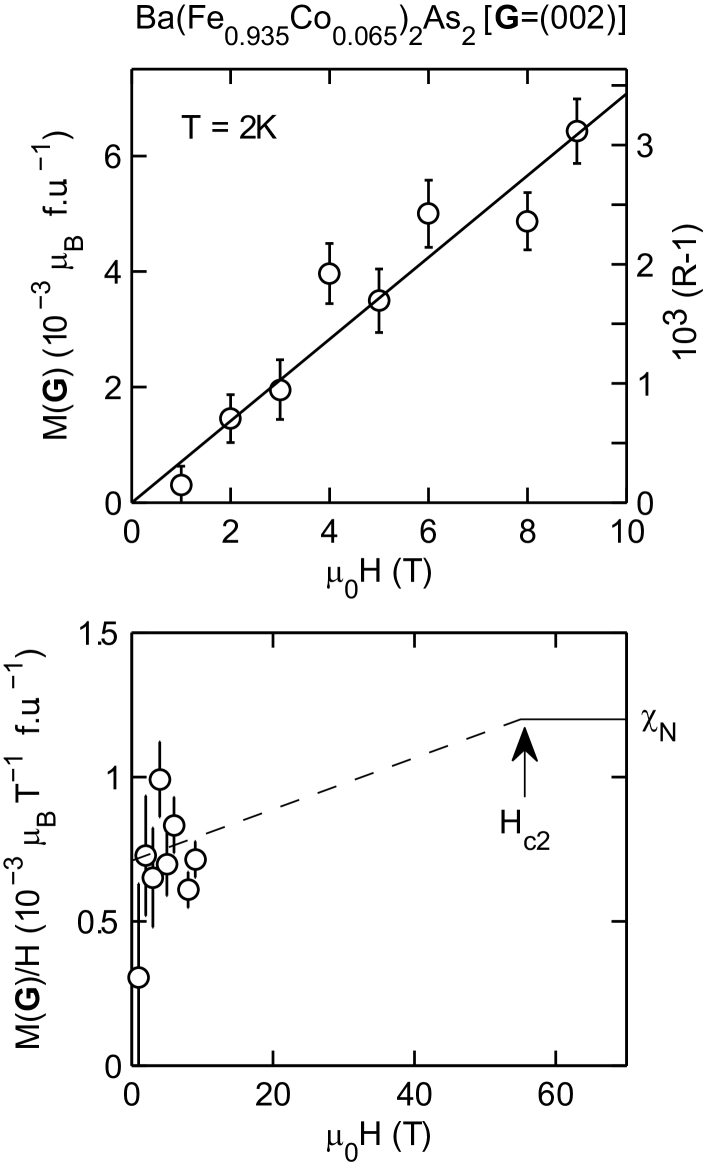
We used the (002) Bragg peak to make our measurement since this requires little correction to give the magnetization, for an isotropic Fe2+ ion. Fig. 6 shows the temperature dependence the induced magnetization of Ba(Fe1-xCox)2As2 (=0.065) for T. The temperature dependence shows the characteristic Yosida dependence expected for singlet pairing Yosida (1958), this is consistent with measurements of the NMR Knight shift in the same compound Ning et al. (2008); Oh et al. (2011). There is a large susceptibility in the limit. A large residual contribution is also observed in V3Si Shull and Wedgwood (1966) and this has been attributed to the van Vleck contribution Clogston et al. (1962). The presence of large van Vleck contribution has also been inferred Grafe et al. (2008); Graser et al. (2009) from NMR knight shift measurements on other iron-based superconductors. Fig. 7(top panel) shows the field dependence of the induced magnetization. over the field range of the present experiment ( T). When we plot the susceptibility [see Fig. 7(bottom panel)], we find that the value as and is about of the normal state value measured at in the present experiment.
IV.2 Interpretation
We measured the static response at finite wavevector to an (approximately) uniform magnetic field, that is, M_s ; SF_ . The atomic nature of solids means that the induced magnetization is spatially modulated on an atomic scale (see Fig. 2). Neutrons diffract from this modulation. In the mixed state of a superconductor, there is an additional diamagnetic magnetization (which gives rise to the vortex lattice), which is not detected in the present experiment. The signal from the vortex lattice is only present at small wavevectors (scattering angles) and can be studied by neutrons using small angle scattering techniques. In the following discussion we do not include the superconducting diamagnetic response.
The magnetic susceptibility in -band metals has several components: atomic diamagnetic, van Vleck (“orbital” or “interband”) and spin. The atomic diamagnetic contribution in BaFe2As2 has been estimated Brown et al. (2010) to be small and is neglected here. Only the spin contribution is expected to be suppressed by singlet Cooper pairing, thus we write the spatially averaged induced magnetization in the mixed state as:
| (5) |
where is the orbital susceptibility and is the spin magnetization. In an -wave superconductor the density of states due to the introduction of vortices is Volovik (1993); Caroli et al. (1964). Thus the spin magnetization should vary as . The temperature dependence is given by the Yosida function Yosida (1958), . The present experiments (Fig. 7) show that the differential susceptibility has a large finite value in the limit and constant for T. This is consistent with the finite response being due to a van Vleck contribution. It should be noted that there is also NMR evidence for a residual susceptibility in BaFe2(As0.67P0.33)2 Nakai et al. (2010) and BaFe(Fe0.93Co0.07)2As2 Oh et al. (2011). Specific heat measurements also suggest that there can be a sizeable residual quasiparticle density of states in BaFe(Fe1-xCox)2As2 Gang et al. (2010); Gofryk et al. (2011); Res . We cannot rule out the possibility that this is related to the residual susceptibility observed by neutron scattering.
There has been considerable debate about the nature of the superconducting gap in Ba(Fe1-xCox)2As2. In principle, a detailed measurement of the -dependence of the induced moment could be used to distinguish between different models for the gap. Unfortunately, the statistical noise in the present data is relatively high. Thus we make only a basic comparison with a singlet -wave state. Within the statistical error of our data, the temperature dependent component of the induced moment is well described by a Yosida temperature dependence (see Fig. 6) with K meV.
V Conclusions
We have used a polarised neutron diffraction technique to measure the induced magnetization density of near optimally doped Ba(Fe0.935Co0.065)2As2 (=24 K) as a function of magnetic field and temperature. The induced magnetization is confined to the Fe atoms with an oblate distribution spread out in the plane. The distribution is in reasonable agreement with a full potential LAPW band structure calculation which suggests that the relevant bands near the Fermi energy are of the and type.
The -dependence of the induced moment in the superconducting state is consistent with the Yosida function characteristic of spin-singlet pairing, and the induced moment is proportional to applied field for . We observe a large residual susceptibility . This is most easily interpreted as being due to the van Vleck contribution present in other -band systems, but may also signal a residual quasiparticle density of states.
VI Acknowledgements
We thank P. J. Brown, A. Carrington, P. J. Hirschfeld and I. I. Mazin for helpful discussions. Work at Stanford was supported by the Department of Energy, Office of Basic Energy Sciences under contract DE-AC02-76SF00515.
References
- Kamihara et al. (2008) Y. Kamihara, T. Watanabe, M. Hirano, and H. Hosono, J. Am. Chem. Soc. 130, 3296 (2008).
- (2) A new class of materials AFexSe2 (A=K, Rb,Cs,Tl) Guo et al. (2010) has recently been discovered. How these fit into the general picture remains to be seen Mazin (2011).
- Fletcher et al. (2009) J. D. Fletcher, A. Serafin, L. Malone, J. G. Analytis, J.-H. Chu, A. S. Erickson, I. R. Fisher, and A. Carrington, Phys. Rev. Lett. 102, 147001 (2009).
- Reid et al. (2010) J.-P. Reid, M. A. Tanatar, X. G. Luo, H. Shakeripour, N. Doiron-Leyraud, N. Ni, S. L. Bud’ko, P. C. Canfield, R. Prozorov, and L. Taillefer, Phys. Rev. B 82, 064501 (2010).
- Terashima et al. (2009) K. Terashima, Y. Sekiba, J. H. Bowen, K. Nakayama, T. Kawahara, T. Sato, P. Richard, Y.-M. Xu, L. J. Li, G. H. Cao, Z.-A. Xu, H. Ding, and T. Takahashi, PNAS 106, 7330 (2009).
- Yin et al. (2009) Y. Yin, M. Zech, T. L. Williams, X. F. Wang, G. Wu, X. H. Chen, and J. E. Hoffman, Phys. Rev. Lett. 102, 097002 (2009).
- Gordon et al. (2010) R. T. Gordon, H. Kim, N. Salovich, R. W. Giannetta, R. M. Fernandes, V. G. Kogan, T. Prozorov, S. L. Bud’ko, P. C. Canfield, M. A. Tanatar, and R. Prozorov, Phys. Rev. B 82, 054507 (2010).
- Luan et al. (2011) L. Luan, T. M. Lippman, C. W. Hicks, J. A. Bert, O. M. Auslaender, J.-H. Chu, J. G. Analytis, I. R. Fisher, and K. A. Moler, Phys. Rev. Lett. 106, 067001 (2011).
- Williams et al. (2009) T. J. Williams, A. A. Aczel, E. Baggio-Saitovitch, S. L. Bud’ko, P. C. Canfield, J. P. Carlo, T. Goko, J. Munevar, N. Ni, Y. J. Uemura, W. Yu, and G. M. Luke, Phys. Rev. B 80, 094501 (2009).
- Gang et al. (2010) M. Gang, Z. Bin, C. Peng, W. Zhao-Sheng, F. Lei, S. Bing, S. Lei, R. Cong, and W. Hai-Hu, Chinese Physics Letters 27, 037402 (2010).
- Gofryk et al. (2011) K. Gofryk, A. B. Vorontsov, I. Vekhter, A. S. Sefat, T. Imai, E. D. Bauer, J. D. Thompson, and F. Ronning, Phys. Rev. B 83, 064513 (2011).
- Chu et al. (2009) J.-H. Chu, J. G. Analytis, C. Kucharczyk, and I. R. Fisher, Phys. Rev. B 79, 014506 (2009).
- Lester et al. (2009) C. Lester, J.-H. Chu, J. G. Analytis, S. C. Capelli, A. S. Erickson, C. L. Condron, M. F. Toney, I. R. Fisher, and S. M. Hayden, Phys. Rev. B 79, 144523 (2009).
- Lester et al. (2010) C. Lester, J.-H. Chu, J. G. Analytis, T. G. Perring, I. R. Fisher, and S. M. Hayden, Phys. Rev. B 81, 064505 (2010).
- Kano et al. (2009) M. Kano, Y. Kohama, D. Graf, F. Balakirev, A. S. Sefat, M. A. Mcguire, B. C. Sales, D. Mandrus, and S. W. Tozer, J. Phys. Soc. Jap. 78, 084719 (2009).
- Becker and Coppens (1974) P. J. Becker and P. Coppens, Acta Cryst. A 30, 129 (1974).
- (17) The extinction calculation assumed a Lozentzian mosaic distribution with a domain radius nm.
- (18) The signs (phases) of and depend of the origin chosen for unit cell in Eq. 2. The values in Table 1 are used here.
- Brown (1992) P. J. Brown, “International tables for crystallography.” (Kluwer, Dordrecht, 1992) p. 391.
- Prokes et al. (2011) K. Prokes, A. Gukasov, D. N. Argyriou, S. L. Bud’ko, P. C. Canfield, A. Kreyssig, and A. I. Goldman, EPL (Europhys. Lett.) 93, 32001 (2011).
- (21) Maximum Entropy and Bayesian Methods, edited by J. Skilling (Kluwer, Dordrecht, 1989).
- Papoular and Gillon (1990) R. J. Papoular and B. Gillon, Europhys. Lett. 13, 429 (1990).
- (23) S. F. Gull and J. Skilling, MEMSYS III Quantified Maximum Entropy Subroutine Library, Meldreth, U.K., 1989.
- Brown et al. (2010) P. J. Brown, T. Chatterji, A. Stunault, Y. Su, Y. Xiao, R. Mittal, T. Brückel, T. Wolf, and P. Adelmann, Phys. Rev. B , 024421 (2010).
- (25) P. Blaha, K. Schwarz, G. K. H. Madsen, D. Kvasnicka, and J. Luitz, WIEN2k, An augmented Plane Wave+Local Orbitals Program for Calculating Crystal Properties (Karlheinz Schwarz, Techn. Universität Wien, Austria, 2001. ISBN 3-9501031-1-2).
- (26) David J. Singh and Lars Nordström, Planewaves, Pseudopotentials and the LAPW Method (Springer, New York, 2006).
- Nordheim (1931) L. Nordheim, Annalen der Physik 401, 607 (1931).
- Singh (2008) D. J. Singh, Phys. Rev. B 78, 094511 (2008).
- Thirupathaiah et al. (2010) S. Thirupathaiah, S. de Jong, R. Ovsyannikov, H. A. Dürr, A. Varykhalov, R. Follath, Y. Huang, R. Huisman, M. S. Golden, Y.-Z. Zhang, H. O. Jeschke, R. Valentí, A. Erb, A. Gloskovskii, and J. Fink, Phys. Rev. B 81, 104512 (2010).
- Andersen and Boeri (2011) O. Andersen and L. Boeri, Annalen der Physik 523, 8 (2011).
- Colonna et al. (2011) N. Colonna, G. Profeta, A. Continenza, and S. Massidda, Phys. Rev. B 83, 094529 (2011).
- Moler et al. (1997) K. A. Moler, D. L. Sisson, J. S. Urbach, M. R. Beasley, A. Kapitulnik, D. J. Baar, R. Liang, and W. N. Hardy, Phys. Rev. B 55, 3954 (1997).
- Shakeripour et al. (2009) H. Shakeripour, C. Petrovic, and L. Taillefer, New J. Phys. 11, 055065 (2009).
- Boaknin et al. (2003) E. Boaknin, M. A. Tanatar, J. Paglione, D. Hawthorn, F. Ronning, R. W. Hill, M. Sutherland, L. Taillefer, J. Sonier, S. M. Hayden, and J. W. Brill, Phys. Rev. Lett. 90, 117003 (2003).
- Ning et al. (2008) F. Ning, K. Ahilan, T. Imai, A. S. Sefat, R. Jin, M. A. McGuire, B. C. Sales, and D. Mandrus, J. Phys. Soc. Jap. 77, 103705 (2008).
- Oh et al. (2011) S. Oh, A. M. Mounce, S. Mukhopadhyay, W. P. Halperin, A. B. Vorontsov, S. L. Bud’ko, P. C. Canfield, Y. Furukawa, A. P. Reyes, and P. L. Kuhns, Phys. Rev. B 83, 214501 (2011).
- Shull and Wedgwood (1966) C. G. Shull and F. A. Wedgwood, Phys. Rev. Lett. 16, 513 (1966).
- Stassis et al. (1986) C. Stassis, J. Arthur, C. F. Majkrzak, J. D. Axe, B. Batlogg, J. Remeika, Z. Fisk, J. L. Smith, and A. S. Edelstein, Phys. Rev. B 34, 4382 (1986).
- Boucherle et al. (1993) J. Boucherle, J. Henry, R. J. Papoular, J. Rossat-Mignod, J. Schweizer, F. Tasset, and G. Uimin, Physica B 192, 25 (1993).
- Duffy et al. (2000) J. A. Duffy, S. M. Hayden, Y. Maeno, Z. Mao, J. Kulda, and G. J. McIntyre, Phys. Rev. Lett. 85, 5412 (2000).
- Yosida (1958) K. Yosida, Phys. Rev. 110, 769 (1958).
- Clogston et al. (1962) A. M. Clogston, A. C. Gossard, V. Jaccarino, and Y. Yafet, Phys. Rev. Lett. 9, 262 (1962).
- Grafe et al. (2008) H.-J. Grafe, D. Paar, G. Lang, N. J. Curro, G. Behr, J. Werner, J. Hamann-Borrero, C. Hess, N. Leps, R. Klingeler, and B. Büchner, Phys. Rev. Lett. 101, 047003 (2008).
- Graser et al. (2009) S. Graser, T. A. Maier, P. J. Hirschfeld, and D. J. Scalapino, New J. Phys. 11, 025016 (2009).
- (45) In this section we choose the unit cell origin to be at an Fe site. With this convention is positive and corresponds to a positive susceptibility.
- Volovik (1993) G. E. Volovik, JETP Lett. 58, 469 (1993).
- Caroli et al. (1964) C. Caroli, P. G. D. Gennes, and J. Matricon, Phys. Lett. 9, 307 (1964).
- Nakai et al. (2010) Y. Nakai, T. Iye, S. Kitagawa, K. Ishida, S. Kasahara, T. Shibauchi, Y. Matsuda, and T. Terashima, Phys. Rev. B 81, 020503 (2010).
- (49) Ref. Gofryk et al., 2011 report that the residual specific heat can be reduced by annealing.
- Guo et al. (2010) J. Guo, S. Jin, G. Wang, S. Wang, K. Zhu, T. Zhou, M. He, and X. Chen, Phys. Rev. B 82, 180520 (2010).
- Mazin (2011) I. Mazin, Physics 4, 26 (2011).