GOODS-Herschel: The far-infrared view of star formation in AGN host galaxies since
Abstract
We present a study of the infrared properties of X-ray selected, moderate luminosity (i.e, ) active galactic nuclei (AGNs) up to z3, in order to explore the links between star formation in galaxies and accretion onto their central black holes. We use 100 and 160 fluxes from GOODS-Herschel – the deepest survey yet undertaken by the Herschel telescope – and show that in the vast majority of cases (i.e., 94 per cent) these fluxes are dominated by emission from the host galaxy. As such, these far-infrared bands provide an uncontaminated view of star formation in the AGN host galaxies. We find no evidence of any correlation between the X-ray and infrared luminosities of moderate AGNs at any redshift, suggesting that star-formation is decoupled from nuclear (i.e., AGN) activity in these galaxies. On the other hand, we confirm that the star formation rates of AGN hosts increase strongly with redshift; by a factor of from to for AGNs with the same range of X-ray luminosities. This increase is entirely consistent with the factor of 25–50 increase in the specific star formation rates (SSFRs) of normal, star-forming (i.e., main-sequence) galaxies over the same redshift range. Indeed, the average SSFRs of AGN hosts are only marginally (i.e., per cent) lower than those of main-sequence galaxies at all surveyed redshifts, with this small deficit being due to a fraction of AGNs residing in quiescent (i.e., low-SSFR) galaxies. We estimate that per cent of moderate luminosity AGNs are hosted in main-sequence galaxies, per cent in quiescent galaxies and per cent in strongly starbursting galaxies. We derive the fractions of all main sequence galaxies at that are experiencing a period of moderate nuclear activity, noting that it is strongly dependent on galaxy stellar mass (); rising from just a few per cent at M⊙ to 20 per cent at M⊙. Our results indicate that it is galaxy stellar mass that is most important in dictating whether a galaxy hosts a moderate luminosity AGN. We argue that the majority of moderate nuclear activity is fuelled by internal mechanisms rather than violent mergers, which suggests that high redshift disk instabilities could be an important AGN feeding mechanism.
keywords:
Keywords1 Introduction
Over the past two decades a significant bank of evidence has developed demonstrating, to first order, the close links between the growth of galaxies and their resident black holes (e.g., the similarity between the black hole accretion and star formation histories of the Universe, the tight correlation between black hole and galaxy bulge masses; Ferrarese & Merritt 2000; Gebhardt et al. 2000; Häring & Rix 2004; Boyle & Terlevich 1998; Franceschini et al. 1999; Merloni 2004). Results from some theoretical models suggest that these links arise through feedback processes between the galaxy and its accreting black hole, regulating their respective growths (e.g., Granato et al. 2004; Di Matteo et al. 2005; Hopkins et al. 2006). However, outside these models the physical mechanisms driving this expected feedback are poorly understood, primarily due to a lack of constraints from observations. Indeed, it is still a matter of debate whether all levels of nuclear activity directly impact star formation (or vice-versa), or whether the scale of their influence is a function of AGN or galaxy properties (e.g., AGN luminosity, galaxy mass, redshift).111Here and throughout we use the term “nuclear activity” to explicitly refer to accretion onto a black hole (i.e., AGN) rather than, for example, intense nuclear star formation. Measuring the simultaneous levels of nuclear and star formation activity taking place within the galaxy population is crucial if we are to determine how or, indeed, if these processes are causally linked.
Measuring the stellar properties of a galaxy (including star formation activity) when faced with contamination from an AGN presents a significant challenge. The most commonly used diagnostics rely on optical spectral features (e.g., the 4000 Å break, the strengths of the H absorption and O ii emission lines), which have been applied extensively to large scale spectral surveys to measure the properties of large numbers of AGN host galaxies (e.g., Kauffmann et al. 2003; Silverman et al. 2009). However, spectral diagnostics are not immune to AGN contamination and optical diagnostics, in particular, are susceptible to the effects of reddening. By contrast, the far-infrared (hereafter, FIR) regime is largely impervious to obscuration and, except in the most extreme cases (e.g., Hony et al. 2011), provides a measure of the star formation activity of the host galaxy that is largely uncontaminated by the AGN (e.g., Netzer et al. 2007; Hatziminaoglou et al. 2010). However, it is only with the recent availability of Spitzer and, more crucially, Herschel that we have been able to measure the FIR emission of AGN hosts at high enough redshifts to probe the epochs during which most stellar and black hole mass in the Universe was built up (i.e., ; Mullaney et al. 2010; Xue et al. 2010; Shao et al. 2010). These first FIR studies of AGNs in the high redshift Universe had to contend with relatively low infrared detection fractions (typically 20 per cent) and, as such, relied heavily on stacking analyses. By contrast, in this study we use data from the deepest FIR survey yet undertaken by Herschel to reach a FIR detection rate of 40 per cent. For the first time, we can use individual detections to explore the trends between AGN and star formation activity to high redshifts (i.e., ), only resorting to stacking analyses to confirm, rather than identify, correlations derived from FIR observations.
The FIR output of a galaxy provides a direct measure of the rate at which that galaxy is forming stars (i.e., the star formation rate, or SFR; e.g., Kennicutt 1998). Clearly, SFRs are a crucial element in most, if not all, studies exploring the links between nuclear activity and galaxy growth. However, it has recently become apparent that the SFRs of normal star-forming galaxies are roughly proportional to galaxy stellar mass (e.g., Noeske et al. 2007; Elbaz et al. 2007; Daddi et al. 2007; Pannella et al. 2009a; Dunne et al. 2009; Magdis et al. 2010), meaning systematic differences in the stellar masses of difference populations of galaxies (such as AGNs and non-AGNs) will also show as differences in their SFRs. Specific star-formation rates (i.e., the level of star formation per unit stellar mass; SSFR), by contrast, take this “mass effect” into account, providing a measure of the relative growth rates of galaxies. As such, SSFRs give us a clear picture of how rapidly a given galaxy is forming stars relative to its star-formation history.
Specific SFRs could also help to distinguish the fuelling mechanisms that drive both nuclear and star formation activity. It is now becoming increasingly evident that almost all star formation takes place in one of two regimes: the majority “main-sequence” (Noeske et al. 2007) and the less common compact “starbursts”, with the latter having significantly higher (i.e., factors of ) SSFRs. Interestingly, it seems that the type of regime is closely linked to the physical process driving the star formation activity, with starbursts being induced by major mergers, while internal processes (e.g., disk instabilities, turbulence) drive main-sequence star formation (e.g., Elbaz et al. 2007; Tacconi et al. 2008; Daddi et al. 2010b; Genzel et al. 2010; Elbaz et al. 2011). Since both major mergers and internal processes can also channel gas and dust into the central regions of a galaxy (e.g., Mihos & Hernquist 1996; Kormendy & Kennicutt 2004; Hopkins & Hernquist 2006), it is relevant to question how nuclear activity fits within this regime. Until recently, nuclear activity was often considered to be closely linked to major merger events – largely due to the high fractions of highly luminous, “quasar class” AGNs that appear to be associated with merging systems (e.g., Sanders et al. 1988; Sanders & Mirabel 1996; Surace et al. 1998; Canalizo & Stockton 2001; Ivison et al. 2010). However, a number of recent morphological studies of AGN hosts have presented evidence to suggest that more moderate levels of nuclear activity (i.e., sub-quasar; ) are typically associated with internally-evolving galaxies undergoing secular evolution rather than major-mergers (e.g., Grogin et al. 2005; Schawinski et al. 2011; Cisternas et al. 2011). On the other hand, measuring morphologies and identifying evidence of mergers can be problematic, especially at high redshifts where source faintness can introduce systematic effects. Specific SFRs, therefore, provide a direct, independent means to distinguish between merger and internally induced star formation with which to verify such claims.
In this paper, we use data from the deepest surveys yet undertaken at FIR wavelengths (i.e., GOODS-Herschel; hereafter, GOODS-H; P.I.: D. Elbaz) to measure the SFRs and SSFRs of X-ray selected AGN-hosting galaxies to . We use X-ray selection as it provides the most accurate measure of nuclear activity, largely free from host contamination and less affected by obscuration than, for example, optical wavelengths. Throughout our analyses we use the Swift-BAT sample of AGNs as a local comparison sample as they have similar X-ray properties as the high redshift AGNs in the deep GOODS fields. Here, we largely focus on moderate luminosity AGNs (i.e., – ) which are responsible for the majority of the integrated X-ray output of AGNs in the Universe (e.g., Ueda et al. 2003; Hasinger et al. 2005; Hopkins et al. 2007; Aird et al. 2010). Although, whether they represent the majority of black hole growth depends on the adopted bolometric correction factor.222 The luminosity-dependent correction factor of Marconi et al. (2004) suggests that more luminous quasars dominate black hole growth, although Vasudevan & Fabian (2007) argue against such a simple luminosity-dependent bolometric correction factor. Our principal aim is to compare the SFRs and SSFRs of these moderate AGN hosts against the general galaxy population to establish whether (a) the levels of star formation activity around moderate luminosity AGNs differ from the general galaxy population and (b) merger or internally driven processes have dominated their stellar and black hole mass build up.
This paper is structured as follows: in §2 we describe our data acquisition and processing, while in §3 we describe the stacking procedure that we use to ensure we consider the FIR output of all X-ray AGNs in our sample, in addition to those that are formally detected. We describe how we convert FIR fluxes into SFRs and SSFRs in §4 before presenting our results in §5, where we demonstrate that moderate luminosity AGNs typically reside in main-sequence galaxies. In §6 we interpret these results in terms of our current understanding of galaxy growth and consider the fraction of main-sequence galaxies containing AGNs. Finally, we summarise our findings in §7.
2 Data
Our main focus is the analysis of the FIR emission (measured by Herschel) of X-ray detected AGNs, as this provides a more accurate measure of the SFRs of AGN hosts than the mid-infrared (hereafter, MIR; e.g, Mullaney et al. 2010). However, an important aspect of our analyses also incorporates MIR data (from Spitzer) to derive the average MIR to FIR SEDs of AGNs in the Chandra Deep Fields (hereafter, CDFs; see §5.3). We use optical and near-infrared (hereafter, NIR) photometry to estimate host galaxy stellar masses (hereafter, ), which we combine with SFRs to calculate SSFRs. To aid in the interpretation of the deep (i.e., high redshift) CDF data, we make use of archival IRAS data for the Swift-BAT sample of local X-ray AGNs. In this section, we describe our X-ray AGN selection (§2.1), the FIR, MIR, optical and NIR data and the cross-matching between these regimes (§2.2 and §2.3). We end this section with a description of the Swift-BAT sample (§2.4).
2.1 X-ray data
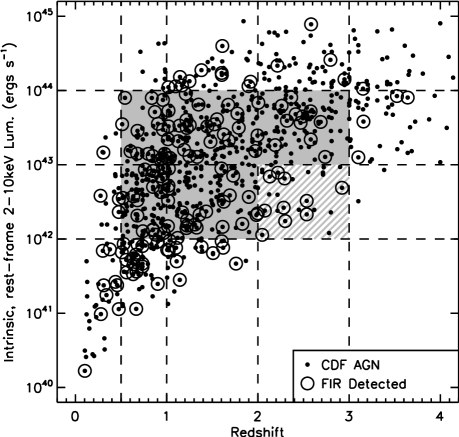
Our initial sample selection is the 1243 X-ray sources detected in the 2 Ms CDF-N and 4 Ms CDF-S surveys, as reported in the Alexander et al. (2003) and Xue et al. (2011) main catalogues, respectively.333We wish to make it clear that, throughout, we use the “CDFs” notation to refer to both Chandra Deep Fields and use CDF-S to refer to the Chandra Deep Field South only. The vast majority of sources in these combined catalogues have been identified as AGNs (i.e., 978 , or 79 per cent), with the remainder identified as either stars (i.e., 24 , 2 per cent) or starbursting galaxies (i.e., 241 , 19 per cent). We use the classifications of Bauer et al. (2004) and Xue et al. (2011) to select only AGNs from the CDF-N and CDF-S catalogues, respectively. Both classification schemes combine information derived from the optical (spectra and/or photometry) and X-ray regimes to differentiate between the different classes of object. Redshifts and absorption-corrected 2-10 keV luminosities (i.e., ) for each X-ray AGN in the CDF-N catalogue were taken from the catalogue described in Bauer et al. (2004). For the CDF-S we used the values from Xue et al. (2011), converting their 0.5–8 keV to 2-10 keV luminosities by assuming a constant conversion factor, , appropriate for the constant spectral index (i.e., ) used to derive their values. It should be noted that the estimates reported by Xue et al. (2011) were derived using simple band ratios to estimate the absorbing column densities, rather than the more detailed spectral fitting approach carried out by, for example, Bauer et al. (2004). However, Xue et al. (2011) report that, when available, values derived from spectral fitting generally agree (i.e., to within 30 per cent) with those estimated using band ratios (although this factor may be higher for highly obscured sources). Of the 978 X-ray detected AGNs in the combined fields, 879 (i.e., 90 per cent) have either a spectroscopic (i.e., 480 ; 55 per cent) or photometric (i.e., 399 ; 45 per cent) redshift measurement. The adopted X-ray luminosities have been corrected for absorption on the basis of X-ray spectral analyses and X-ray band ratios (Xue et al. 2011; Bauer et al. in prep). As a key goal of this study is to explore the infrared properties of AGNs as a function of AGN power (i.e., ) and redshift, we only consider those 879 AGNs for which these parameters are known. The – distribution of these AGNs is shown in fig. 1. As for all flux limited surveys there is a clear Malmquist bias within this sample. Despite this, the regions of the parameter space spanning and – are well sampled and we mainly focus our attention on the 564 AGNs within these ranges, although we stress caution when interpreting the results from the single , – bin, due to the low number of detected X-ray AGNs in this redshift and range (i.e., 29 X-ray AGNs).
2.2 Mid and far-infrared data
To characterise the MIR and FIR properties of our sample of X-ray AGNs, we used the deepest data currently available at 16, 24, 100 and 160 : the Spitzer IRS peak-up survey (16 ; Teplitz et al. 2011; hereafter, GOODS-IRS), the GOODS-Spitzer Legacy survey (24 ; P.I.:Mark Dickinson), and the GOODS-H survey (100 and 160 ; Elbaz et al. 2011). The 16 observations and data reduction are described in full in Teplitz et al. (2011) but, to summarise, they resulted in a pair of mosaics with pixel scales of 0.9″ and average 3 depths of 40 and 65 Jy in the northern and southern fields, respectively. The 24 observations resulted in a pair of final mosaics with a pixel scale of 1.2″ and a point-source 5 sensitivity limit of 30 Jy in both fields. The GOODS-H observations are described in Elbaz et al. (2011) and the final images were produced following the procedure outlined in Berta et al. (2010). In total, the GOODS-H program consists of 124.6 hours of PACS observations (Poglitsch et al. 2010) in the northern field, and 264 hours in the southern field (31.1 hours of SPIRE observations were also obtained for the northern field, but we do not use these longer wavelength data here). The final images have pixel scales of 1.2″ (100 ) and 2.4″ (160 ). At 100 the 5 sensitivities are 1.7 mJy and 1.2 mJy in the northern and southern fields, respectively, while at 160 they are 4.5 mJy and 3.5-4.5 mJy, respectively.444The 100 and 160 surveys cover the same region of sky.
Although the various X-ray and infrared surveys are roughly centred on the same positions on the sky (i.e., [RA, Dec]: :, : for the northern field; :, : for the southern field), because of the different fields of view and observing modes of the various instruments they do not cover exactly the same region of the sky. Because of this, roughly 53 , 70 and 47 per cent (i.e., 465 , 614 , 409 ) of the X-ray AGNs in our sample with known redshifts and are covered by the GOODS-IRS, GOODS-Spitzer and GOODS-H surveys, respectively. Roughly 44 per cent (i.e., 391 ) of our X-ray AGN sample is covered by all three surveys, although we only use data from all three when deriving the average infrared SEDs of the X-ray AGNs in our sample (see §5.3); we use only FIR fluxes from the GOODS-H survey to calculate (see §4.1).
To identify 16 µm counterparts to the X-ray AGNs in the CDFs we used the publicly available catalogue of Teplitz et al. (2011). The fluxes reported in the 16 catalogue were obtained by performing PSF-fitting using the positions of 5 sources from the 3.6 µm GOODS catalogue as priors (see Dickinson et al. in prep.). The 16 catalogue lists the fluxes of all sources detected at in the 16 µm band and contains 1309 sources across both CDFs. The 24 µm catalogue, which is also based on the positions of , 3.6 µm priors, contains 5188 sources across both CDFs at . The 100 µm and 160 µm fluxes were calculated in a similar fashion by performing PSF fitting at the positions of the 24 µm priors. As we are exploring general trends in the FIR properties of X-ray AGNs, rather than focusing on individual sources, we use a relatively low detection threshold of 3 at 100 µm and 160 µm to maximise the number of sources in our sample. Across both GOODS-H fields there are 1324 and 1095 Herschel sources that satisfy this criteria at 100 and 160 , respectively.
We used positional matching to identify infrared counterparts to the X-ray sources in each infrared band. Because there is no significant difference between the spatial resolutions of the 16 and 24 images we used the same 3.0″ matching radius for both wavelengths, which we noted in Mullaney et al. (2010) provides the best compromise between finding real matches while reducing the number of spurious matches. The 100 and 160 positions are from 24 priors (which are, in turn, based on IRAC 3.6 priors), so there was no need to perform any matching for these bands. At 16 , we identified 192 matches (i.e., at 16 ) to the X-ray detected AGNs with measured redshifts (i.e., 41 per cent of those covered by this survey). At 24 we identify 449 matches (i.e., 73 per cent) while at 100 and 160 we identify 174 (i.e., 43 per cent) and 140 (i.e., 34 per cent) matches, respectively (i.e., in each of the 24, 100 and 160 bands). 555Here, the percentages refer to the fraction of sources detected in the region covered by each individual survey, i.e., not the fraction covered by all three surveys. The larger numbers of matches at 24 compared to at 16 is due to the increased depth of the 24 survey. Approximately 25 per cent (i.e., 99 ) of the X-ray AGNs with measured redshifts covered by all three surveys are detected in all four bands. In each band the expected fraction of spurious matches is less than 2 per cent (calculated using the same procedures as outlined in Mullaney et al. 2010).
For each of the four infrared bands considered, the depth of the observations are different in the two fields. Furthermore, the depth of the observations also vary as a function of position within each field, especially in the 16 band. Therefore, when combining the individual fluxes to derive mean values, we take into account these differences by weighting as 1/error2 of the measured flux.
2.3 Optical and near-infrared data
We use optical and NIR photometry to estimate the host galaxy masses of the X-ray AGNs in our sample (see §4.2). A detailed description of the multi-wavelength catalog assembly and of the photometric redshift and stellar mass estimation will be given in a separate paper (Pannella et al. in prep.). In the following, and for the sake of completeness, we will briefly describe the data set and the procedures used.
In the GOODS-N field we have built a PSF-matched multi-wavelength catalog with 10 passbands from U to 4.5 . The optical, NIR and IRAC data used here are presented in Capak et al. (2004), Wang et al. (2010) and Dickinson et al. (in prep.), respectively. A Ks-band selected catalog has been built using source extractor (Bertin & Arnouts 1996) in dual image mode. To compensate for the different resolution of the images we have applied corrections based on the growth curve of “bona-fide” point-like sources.
For the northern field photometric redshift determination closely follows the procedure described in Pannella et al. (2009b) and Strazzullo et al. (2010). When comparing to the spectroscopic sample of Barger et al. (2008), we reached a relative (i.e., ) photo- accuracy of 4 per cent with 3 per cent of catastrophic outliers (i.e. objects with ). For the southern field we have used the spectroscopic or photometric redshifts reported in Xue et al. (2011) throughout and used photometry from the GOODS-MUSIC survey (Santini et al. 2009) to estimate stellar masses (to ensure consistency, we fixed the redshifts to those of Xue et al. 2011 in these mass calculations). The GOODS-MUSIC catalog provides total magnitudes for a very similar photometric coverage as the GOODS-N field. We refer the reader to Santini et al. (2009) for a detailed description of the catalog content.
We used positional matching to identify the counterparts to the X-ray AGNs in the above catalogues. Rather than matching directly to the X-ray positions themselves (which have a high positional uncertainty, especially at large off-axis angles), we used the positions of their optical counterparts reported in Barger et al. (2003) and Xue et al. (2011) for the northern and southern fields, respectively. We use a matching radius of 0.5″in both fields and match 95 per cent (i.e., 388 ) of the 409 X-ray AGNs with redshift measurements and GOODS-H coverage.
We found that for 27 (i.e., 7 per cent of the total sample covered by GOODS-H) AGNs in the northern field the redshift from the Barger et al. (2003) differed from our own new estimate by a significant amount (i.e., ). We reject these sources entirely from our analyses as we believe that the Barger et al. (2003) photometric redshift is now out-of-date (i.e., has been superseded due to improved photometric/spectroscopic data) meaning the value of is likely incorrect. This ensures that, across both fields, we have used fully consistent redshifts throughout to derive , and .
2.4 The Swift–BAT sample of AGNs
As we described in Mullaney et al. (2010), the Swift-BAT sample of AGNs (Tueller et al. 2008) is currently one of the best local comparison samples for studies of high redshift, X-ray AGNs detected in the CDFs (see Figs. 7 and 10 of Winter et al. 2009 where they plot the and of the Swift-BAT AGN sample). Of the 104 Swift-BAT AGNs for which and have been measured (Winter et al. 2009), 41 have infrared flux density measurements from all four IRAS bands (these 41 objects are hereafter referred to as the BAT/IRAS sample), allowing direct comparison with the infrared properties of the AGNs in the CDFs. All of these AGNs have and are thus “local” in comparison to the –3 CDF AGNs which form our high redshift sample. As none of the Blazars in the Tueller et al. (2008) have measurement reported in Winter et al. (2009) they are automatically excluded from our sample.
3 Mid and far-infrared stacking procedure
By using the deepest FIR observations currently available, we detect roughly 46 per cent of X-ray sources at in either the 100 or 160 bands. This represents a vast improvement over previous FIR surveys (e.g., and per cent for Mullaney et al. 2010 and Shao et al. 2010), respectively. However, we resort to stacking techniques (see §5.1.2) to confirm that the trends observed in the FIR-detected fraction of our sample remain when all X-ray AGNs in our sample are considered (i.e., even those undetected at FIR wavelengths).
As our intention is to explore how the infrared properties (e.g., infrared luminosities, SED shape) change as a function of redshift and nuclear activity, we stack subsamples of our X-ray AGNs separated into six different and bins: all combinations of 0.5–1, 1–2, 2–3 and – and – ; the number of AGNs in each stack are given in column 4 of table 1. These bins cover the region of the – parameter space that benefits from high levels of completeness (see §2.1 and fig. 1). The nature of small, yet deep fields such as the CDFs implies that, while we can probe moderate luminosity (i.e., – ) AGNs to high redshifts, there are only a small number of the rarer, quasar luminosity AGNs in our sample, especially at lower redshifts (i.e., ). Wide, but less deep, infrared surveys such as PEP (Lutz et al. 2011) and HERMES (P.I.: S. Oliver) are needed to fully explore the average infrared properties of both higher luminosity (i.e., ) or, alternatively, lower redshift (i.e., ) AGNs.
We only stack on residual images (i.e., images from which the sources down to 3 have been removed), stacking only those X-ray sources that are undetected in the various infrared bands (i.e., for 16 and for 24 , 100 and 160 ). We take this approach, rather than stacking all X-ray positions on the original images, to reduce the effect of flux boosting from nearby bright sources. However, as the residuals from very bright sources can be strong even after source subtraction, we do not stack at positions that lie within 10″ of sources (equivalently, 65–110 Jy, 1.2–1.7 mJy and 4–4.5 mJy at 16 , 100 and 160 , respectively). The stacked images are produced by summing cut-out images centred on the positions of the infrared-undetected X-ray sources in both fields. Prior to summation, each pixel in the individual cutouts is weighted by the inverse of its RMS noise, determined from RMS maps of the fields. The weighted mean stack is then calculated by dividing the sum of these cutouts by the sum of the weights on a pixel-by-pixel basis, i.e.,
| (1) |
where is the final stacked image, and () represent the individual cutout images and weight map, respectively, and is the total number of cutouts to be combined in the stack. Once the weighted mean stacks have been produced for the sources in each of our bins, we use aperture photometry to measure the flux within a circular aperture placed at the centre of each stacked image. The radius of this aperture depends on the PSF of the observation and thus, ultimately, on the wavelength and instrument: 6″ for both the 16 and 24 wavebands and 9″ and 15″ at 100 and 160 , respectively. Through simulated stacks, we find that the 100 and 160 fluxes extracted through aperture photometry are 70 per cent of those derived from PSF fitting (i.e., the technique used to extract individually detected sources). To correct for this discrepancy, we apply an aperture correction to our stacked fluxes, such that the reported flux is times the flux derived from the stacks. We also include a 15 per cent upwards correction factor to account for the effects of source masking that was performed when removing the low-frequency noise from the raw Herschel images. We then use a weighted mean (here, weighting by number) to combine this flux derived from stacking with the mean flux from the individually detected sources. We follow the same procedure (aside from minor modifications to account for the different image resolutions) to stack in each of the four infrared bands.
The errors on the fluxes derived from these stacks of the undetected sources are calculated by using the same procedure to stack the same number of random positions in the residual frames. We perform this “random stacking” 10,000 times, with the error calculated by taking the standard deviation of the fluxes from these trials.
We use a different bootstrapping approach to calculate the errors on the total mean 100 and 160 fluxes (i.e., those derived by combining the detected and undetected mean fluxes). This “error on the mean” is different from both the error on the stacked fluxes and the standard deviation of the samples. Taking each bin in turn, we randomly select (with replacement) of the sample within that bin, taking no account of whether they are detected or not, and use the procedure outlined above to calculate the weighted mean flux of this sample. This is performed 10,000 times for each bin and the error on the mean is calculated by taking times the standard deviation of the results of these trials.
4 Calculating total infrared luminosities, star formation rates, host galaxy masses and specific star formation rates
One of the main aims of this study is to relate nuclear activity to star formation at . A key measurement is therefore the SFRs and SSFRs of the AGN hosts in our sample. In this section we describe how we measure for the AGN hosts in our sample and convert these into star formation rates. We also describe how we use deep optical and NIR observations to measure the stellar masses of these galaxies, enabling us to calculate their SSFRs.
4.1 Total infrared luminosities and star formation rates
We use the SED library of Chary & Elbaz (2001) to calculate the integrated 8-1000 infrared luminosities (hereafter, ) of the AGN hosts in our sample. These SEDs, when combined with the monochromatic luminosities measured by the 100 and 160 Herschel-PACS bands, have been shown to provide reliable estimates of at the redshifts considered here (e.g., Elbaz et al. 2010). The shapes of the Chary & Elbaz (2001) SEDs are purely a function of infrared luminosity, meaning that each SED has a single characteristic (and vice-versa). We identify the SED that most closely matches the rest-frame monochromatic luminosity (i.e., ) derived from either the observed 100 or 160 flux then integrate this SED between 8-1000 . The choice of FIR waveband depends on the redshift of the source; for 0.5–1.5 sources, we use the 100 band, while for 1.5–3.0 sources, we use the 160 band. This ensures that we always sample roughly the same rest-frame wavelengths (i.e., 40–67 ), thus minimising the systematic uncertainties introduced by -corrections. Roughly 42 per cent (i.e., 144 ) of the X-ray AGNs in our sample that are covered by the GOODS-H footprint are detected in their respective FIR bands; hereafter, we collectively refer to these as being “FIR detected”.
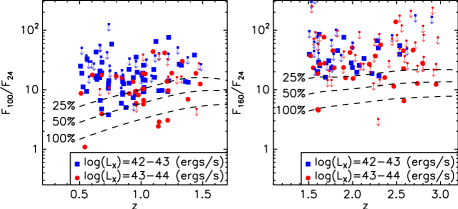
As the Chary & Elbaz (2001) catalogue only includes templates for non-AGN-hosting galaxies, we must ensure that these rest-frame wavelengths are not dominated by the AGN, otherwise the of the host galaxies will be overestimated. For this, we calculate the observed-frame 100 24 and 160 24 flux ratios for the 0.5–1.5 and 1.5–3.0 AGNs, respectively, detected in these bands. These ratios are presented in the left and right panels of fig. 2. Included in these plots are tracks indicating the expected ratios if 25, 50 and 100 per cent of the flux in the 100 and 160 bands arises from the AGN. These tracks are calculated by combining the empirical average-AGN and “SB5” SED templates from Mullaney et al. (2011) and are appropriate for the and ranges considered here. We only calculate when at least per cent of the 100 or 160 flux (depending on redshift) is attributable to the host galaxy. The tracks shown in fig. 2 are largely unaffected by emission or absorption features in the host galaxy templates because the 24 band is always dominated (i.e., per cent) by the AGN when per cent of the observed 100 and 160 flux arises from the host galaxy. That said, the levels of extinction applied to the AGN component can alter these tracks. When the average AGN SED from Mullaney et al. (2011) is used (which already includes a modest amount of extinction) we remove a total of 16 FIR-detected X-ray AGNs from our high redshift (i.e., CDF) sample (i.e., 6 per cent of the sample). If, instead, we were to use a heavily extinguished AGN component (such as that of ESO103–035 or NGC 5506; see Mullaney et al. 2011) the number of rejected sourced would increase by 18 (i.e., by a factor of ), but this would not affect our overall conclusions. We identify 16 of the 41 BAT/IRAS AGNs (i.e., 40 per cent) with 60 flux likely dominated by the AGN, rather than the host galaxy. Since such a high fraction of the BAT/IRAS comparison sample is found to be AGN dominated, removing them entirely from our analyses would give a false impression of the average and star-formation activity of local AGNs (especially at , where two-thirds of BAT/IRAS AGNs are “AGN dominated”). Instead, we assume that their rest-frame 60 fluxes set a hard upper limit on the infrared luminosities of their host galaxies. Star formation rates are calculated from the host galaxy infrared luminosities using the prescription outlined in Kennicutt (1998) assuming a Salpeter (1955) IMF, i.e.,
| (2) |
and assuming L⊙ .
From the rest-frame ultraviolet luminosities we estimate that including the contribution from unobscured star formation (as in e.g., Daddi et al. 2007) would have a negligible effect on our results (i.e., at the level of per cent) and, for simplicity, is neglected from the rest of our analyses.
We use the same procedure to calculate the mean and SFRs of the AGN hosts by treating the mean 100 or 160 flux (derived from stacking analyses) as an individual source at the mean redshift of the subsample. Errors on these average and SFRs are calculated by passing the average FIR flux (see §3) through this process.
4.2 Host galaxy stellar masses and specific star formation rates
Stellar masses were estimated for both fields using the SED fitting code described in detail in Drory et al. (2004) and Drory et al. (2009). We parametrize the possible star formation histories (SFHs) by a two-component model, consisting of a main, smooth component described by an exponentially declining star formation rate , linearly combined with a secondary burst of star formation. The main component timescale varies in Gyr, and its metallicity is fixed to solar. The age of the main component, , is allowed to vary between 0.01 Gyr and the age of the Universe at the object’s redshift. The secondary burst of star formation, which cannot contain more than 10% of the galaxy’s total stellar mass, is modelled as a 100 Myr old constant star formation rate episode of solar metallicity. We adopt a Salpeter (1955) initial mass function for both components, with lower and upper mass cutoffs of 0.1 and 100 M⊙.
Adopting the Calzetti et al. (2000) extinction law, both the main component and the burst are allowed to exhibit a variable amount of attenuation by dust with and for the main component and the burst, respectively. For the GOODS-N field, we have corrected the “aperture magnitude” stellar masses to total stellar masses by means of the ratio of total (FLUX_AUTO) and aperture fluxes in the -band detection image. Of the 346 host-dominated X-ray AGNs with GOODS-H coverage and consistent redshifts (see §2.3), we have been able to calculate stellar masses for 327 (i.e., 95 per cent).
Of course, our mass estimates are based on the assumption that the light in these optical and NIR bands is dominated by the host galaxy, rather than the AGN. While a number of previous studies have found that this is indeed the case for AGNs such as those considered here (e.g. Silverman et al. 2008; Bundy et al. 2008; Xue et al. 2010), we wanted to perform our own tests to confirm that this is true for our sample.
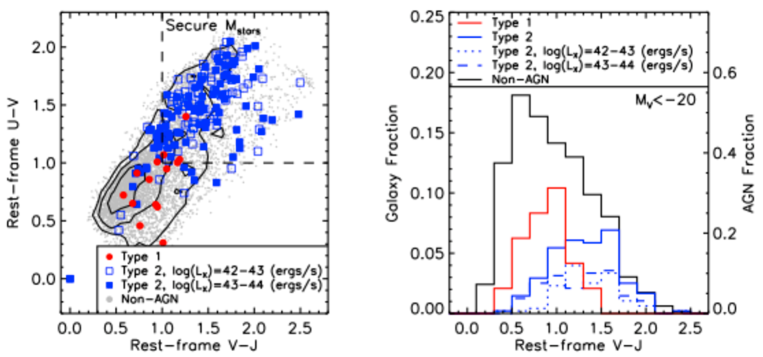
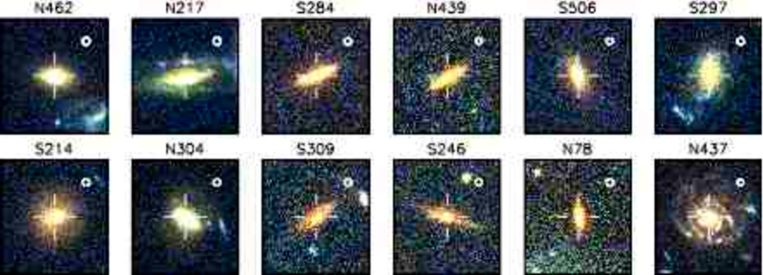
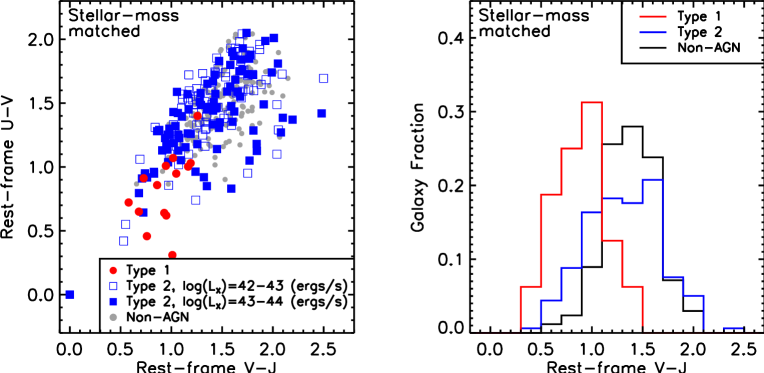
To test whether the optical/NIR fluxes of our AGNs are host-dominated we compare their rest-frame colours against those of the general galaxy population. The central engines of AGNs have blue optical–NIR colours as their broad-band UV to NIR SEDs rise monotonically to shorter wavelength - a result of this light being emitted directly from the accretion disk itself. Therefore, the presence of a dominating AGN will tend to result in the galaxy as a whole (i.e., stellar + AGN components) having a bluer colour than if the AGN were not present. In the left-hand panel of fig. 3 we plot the rest-frame and colours of the AGNs in our sample, separated into Type 1 (i.e., optically unobscured; broad-line) and Type 2 (i.e., optically obscured; narrow-line) AGNs.666Rest-frame colours are calculated in the Buser & Kurucz (1978) and filters and in the band transmission curve of the WIRCam instrument. Also included in this plot are the rest-frame colours of the underlying galaxy population in the GOODS fields. Rather than having particularly blue colours, Type 2 AGNs tend to lie among the redder galaxies in this colour-colour plot, indicating that their active nuclei are obscured and that their optical-NIR SEDs are likely host-dominated. Furthermore, there is no evidence to suggest that more X-ray luminous Type 2 AGNs have systematically different and colours. This is more clearly shown in the right-hand panel of fig. 3, where we plot histograms of the colours of Type 1 and Type 2 (separated according to ) AGNs and the underlying galaxy population. Type 1 galaxies, on the other hand, tend to have much bluer colours, as may be expected if the unobscured light from the accretion disk is dominating the output of the total galaxy. As a precaution, we only use galaxy stellar masses for those AGNs in our sample with rest-frame and . This leaves 255 AGNs in the GOODS-H fields with “secure” masses, of which 115 are FIR detected. However, we note that our conclusions regarding the host galaxy stellar masses and SSFRs do not change if we, instead, include all AGNs in our analyses. We note that per cent of the AGNs in our sample that satisfy these criteria also satisfy /, which Bluck et al. (2011) suggest is a reliable indicator of a host-dominated optical-NIR SED. As a final test, we exploit Hubble Space Telescope B, V, I, z (i.e., ACS) images to check the optical morphologies of the selected galaxies to ensure that they are not dominated by a bright, central point source (i.e., AGN; see Ammons et al. 2011 for a detailed discussion on this point).777Images were retrieved via the ACS GOODS Cutout Service v2.0: http://archive.stsci.edu/eidol_v2.php We find that per cent of galaxies in our sample have clear, extended morphologies (see fig. 4), indicating that their integrated light is dominated by the host galaxy, rather than the AGN. At higher redshifts, it becomes increasingly difficult to assess optical morphologies, so we assume that our rest-frame colour cuts provide the same success rate at all redshifts. However, we also note that recent studies exploiting new NIR data from WFCAM3 on-board Hubble (i.e., the CANDELS survey; P.I.s: H. Ferguson, S. Faber) find that AGN-hosts at these high redshifts have quantitatively similar morphologies to their non-AGN counterparts, again suggesting that their integrated light is dominated by the host galaxy (D. Kocevski, private communication).
We calculate mean stellar masses for each of our and bins and use bootstrapping to calculate the error on these means in a manner consistent with that use to determine the errors on our mean 100 and 160 fluxes (and hence, and SFRs; see §3). Taking each bin in turn, we randomly select (with replacement) of the sample within that bin, and calculate the mean stellar mass of this sample. This is performed 10,000 times for each bin and the error on the mean stellar mass is calculated by taking times the standard deviation of the results of these trials. Errors on the SSFRs are derived by combining the errors on the SFRs and stellar masses in quadrature. Mean stellar masses and their associated errors for the AGNs in each of our and redshift bins are given in table 1.
5 Results
In this section we present our results and explore the links between nuclear activity, measured from , and the levels of star formation activity, measured from , taking place in their host galaxies. We also pay particular attention to how star formation activity in AGN host galaxies changes with redshift. First, we consider the per cent of X-ray AGNs for which we are able to calculate host galaxy values and SFRs, noting that we have already excluded any galaxies where the AGN likely dominates the observed FIR flux (see §4.1). Then, we use the results from our stacking analyses to confirm that trends seen in this FIR-detected fraction of our sample extend to the general X-ray AGN population.
5.1 Infrared luminosities and star formation rates of AGN-hosting galaxies
5.1.1 X-ray AGNs detected at 100 and 160
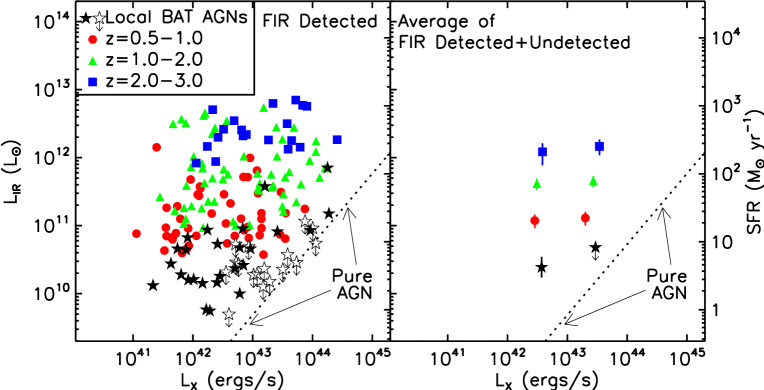
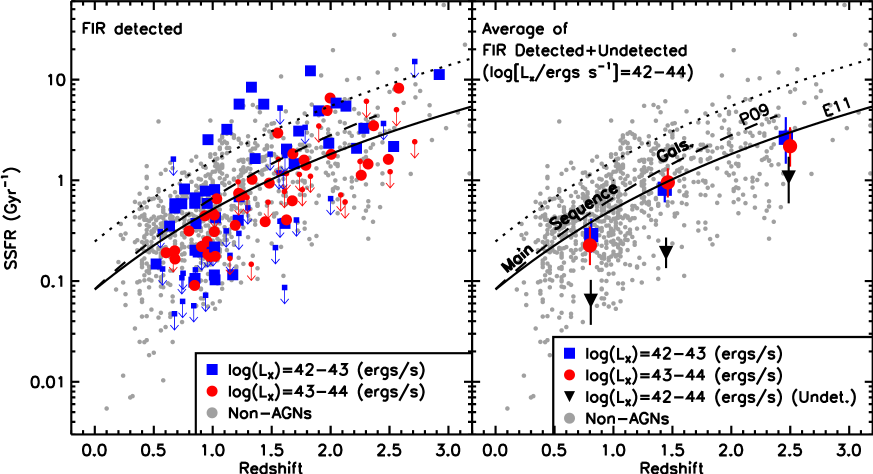
In the left-hand panel of fig. 5 we plot versus for all the FIR-detected AGNs in both the high redshift CDFs and local BAT/IRAS samples. Over the entire sample, which spans over three orders of magnitude in both and , we find no statistically significant correlation between and (Spearman’s rank correlation coefficient: 0.29 ). Furthermore, this – correlation typically gets even weaker when we consider the CDF AGNs in discrete redshift bins (i.e., 0.5–1, 1–2, 2–3; Spearman’s rank: 0.16 , 0.09 and 0.30 , respectively). We note that there is a slightly stronger – correlation within the BAT/IRAS sample (Spearman’s rank: 0.36 ) due to the rise in of the BAT sample at . However, this is likely due to the large fraction of the AGNs in this low redshift sample BAT/IRAS being AGN dominated at 60 (see §4.1). Indeed, the minimum produced by a “pure” AGN increases almost linearly with (Mullaney et al. 2011; indicated by the dotted line in fig. 5). By splitting the sample into redshift bins, we find that, generally, the of AGNs increase strongly with redshift. Indeed, the AGNs in our highest redshift bin (i.e., 2–3) typically have and, correspondingly, SFRs around 1.5 orders of magnitude higher than the BAT/IRAS AGNs with the same X-ray luminosities (see §5.1.2 for a more quantitative breakdown of the increase in the average with redshift). The weak correlation in the unbinned sample arises from a combination of this strong – correlation and an increase in the proportions of more X-ray luminous AGNs in our sample at higher redshifts; a result of both selection effects and a real, observed increase in the average with increasing redshift (e.g., Barger et al. 2005; Hasinger et al. 2005).
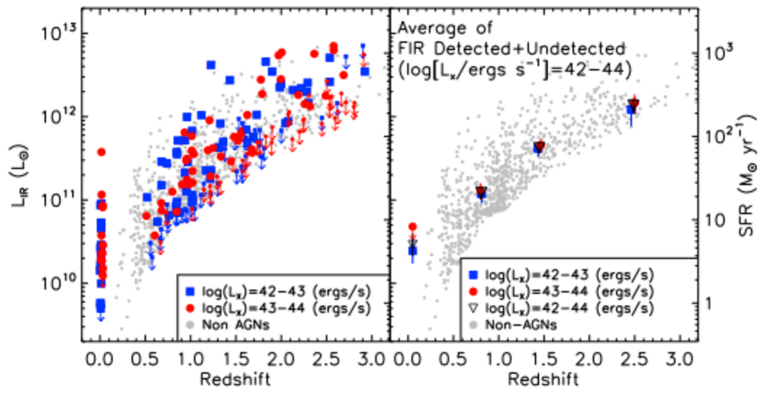
The increase in with increasing redshift is more clearly visible in fig. 6, where we plot as a function of redshift. Here, we have included upper limits on , calculated in the same way as for the detected sources assuming 3 upper limits on the FIR fluxes. Qualitatively, the distribution of AGNs in the – plane is the same as that of the FIR-detected non-AGNs in the same field. As is expected when 60 per cent of a sample is not detected, this plot shows a clear Malmquist bias. However, it is clear that the upper envelope of the - relation increases strongly with redshift; by about 1.5 orders of magnitude from to 3.0, i.e., 2 to L⊙. This trend continues to the low redshifts (i.e., ) spanned by the BAT sample and is too steep to be explained in terms of the increase in the comoving volume of the survey expanding the range of at higher redshifts; the probed comoving volume between is only a factor of 4 times larger than that between .
We have demonstrated that the FIR-detected AGNs in both the high redshift CDF and low redshift BAT samples show no strong increase in with , yet are consistent with a strong increase in with increasing redshift. We will look more closely into the causes and consequences of these results in §5.2 and §6 but, first, we will confirm whether these results still hold when we consider all X-ray AGNs in the GOODS fields, i.e., not just those detected at FIR wavelengths. For this, we resort to stacking analyses.
5.1.2 Results from stacking analyses
By considering only the detected sources in the previous subsection, we sampled only the most intrinsically infrared luminous galaxies at each redshift. In this subsection we consider the contribution of X-ray AGNs that are not formally detected in each of the wavebands by relying on stacking analyses (see §3) to push the average detection threshold beyond what is achievable for individual sources.
In the right-hand panel of fig. 5 we plot the average (derived from stacking analyses) vs. average for CDF AGNs in each of our two bins and three redshift bins (i.e., – and – ; 0.5–1, 1–2 and 2–3). Also included in this plot is the mean-average vs. mean-average of the low redshift BAT/IRAS AGNs. These averages reproduce the same overall trends as those seen in the FIR detected fraction of our sample, i.e., that, within each redshift bin there is no strong correlation between the average and average , but that the average increases strongly with increasing redshift. The average properties, including the average , of the AGNs in each of our and redshift bins are presented in table 1.
The increase in the average of our AGNs with increasing redshift is clearly seen in the right-hand panel of fig. 6, where we plot the average as a function of redshift. The mean of =– AGNs increases by a factor of from to and by a factor of from to . The large uncertainty on the latter of these ratios is due to the small number of =– AGNs in our highest redshift bin (i.e., 29 , of which only 11 are detected at FIR wavelengths). Comparison with the =– AGNs in the BAT/IRAS sample (mean L⊙) reveals an increase in the mean by factors of , and from to , and , respectively.888The errors on the ratios presented in this section reflect the maximum and minimum possible values, the statistical errors will be roughly 30-40 per cent smaller.
We see a similar increase in with redshift for the more X-ray luminous AGNs in our sample (i.e., – ). Considering just the high redshift (i.e., CDF) sample first, there is a factor of increase in the mean between the and bins and a factor increase between the and bins. Comparing with the mean of BAT/IRAS sample AGNs from the same interval ( L⊙) reveals an increase in by factors of at least , and from to , and , respectively.999In reality these ratios are likely considerably higher since the majority of – AGNs from the BAT/IRAS comparison sample have only upper limits for . A similar increase in the of – AGNs with redshift was reported by Lutz et al. (2010) and Shao et al. (2010). These observed increases in are also consistent with the upper limits reported in Mullaney et al. (2010) that were derived from Spitzer 70 observations.
As a check, we also calculated the mean of AGNs in the full – bin and find that they are consistent with the results from the narrower bins (see fig. 6 and table 1). A least-squares fit to the average of these AGNs gives:
| (3) |
where is the age of the Universe in Gyr. The influence of the FIR-undetected AGNs on these average values is clearly seen in the bin, which lies close to the bottom of the distribution of FIR-detected non-AGNs in the same field. This explains why the average of our sample does not rise as quickly with redshift as the FIR-detected galaxies.
Finally, we note that if we instead use volume-averaged bins, (, where is the number of AGNs in each redshift bin and is the surveyed volume between the upper and lower redshift bounds, and ; e.g., Heckman et al. 2004) we find that the infrared luminosity density of AGNs increases by a factor of 3 from z=0.5-1 to z=2-3. This is in general agreement with the increase in the total SFR density over the same redshift range (e.g., Murphy et al. 2009; Magnelli et al. 2011) and implies that the relative galaxy to black hole growth in moderate luminosity AGNs was higher at high redshifts compared to today (assuming that the bolometric corrections, accretion histories etc. have, on average, remained constant throughout; see also §6.2).
We have shown that the GOODS-H observations confirm the results from previous studies of the (far) infrared properties of X-ray selected AGNs over large redshift ranges; i.e., that, within the – interval there is no significant – correlation but and thus SFRs, increases strongly with redshift. In the following subsection we explore whether this increase in with redshift is caused by changes in the stellar mass or the SSFRs (or a mixture of both) of the AGN hosts. We find that it is most likely due to the latter and is broadly consistent with the increase in the SSFRs of star-forming galaxies with increasing redshift.
5.2 Masses and specific star formation rates of AGN-hosting galaxies.
In their study of the sub-mm properties of X-ray selected AGNs, Lutz et al. (2010) showed that the increase in the sub-mm luminosities of – AGNs is consistent with the increase in infrared output of normal, star-forming (hereafter, main-sequence) galaxies. They argue that this could imply that moderate luminosity AGNs typically reside in main-sequence galaxies undergoing internally-induced evolution (as opposed to major-mergers). However, there remains other possible explanations for the increase in of these AGNs; changes in the average mass of AGN-hosting galaxies or a transition from starbursting to main-sequence hosts could also produce similar trends. In this section, we will combine the results outlined above with mass estimates of the host galaxies (see §4.2) to discriminate between these three scenarios.
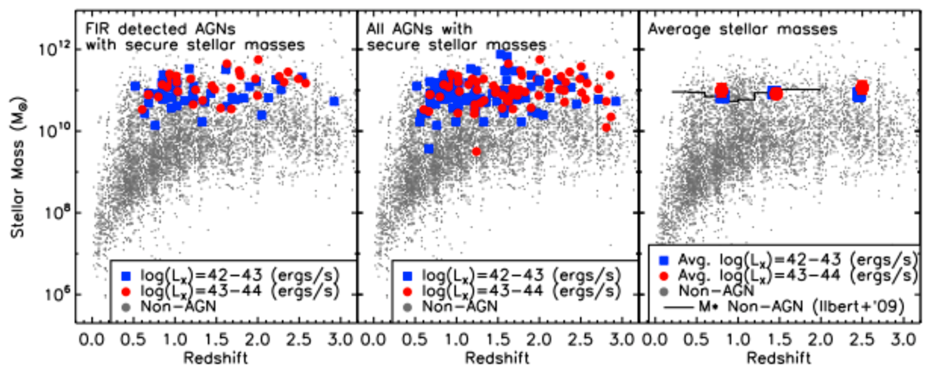
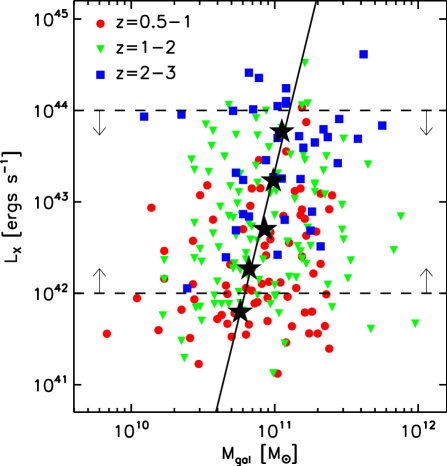
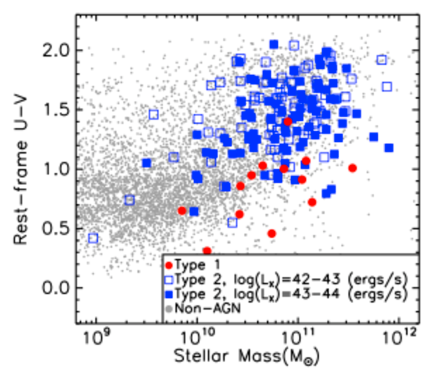
To determine whether the increase in of moderate luminosity AGNs is due to an increase in the average host galaxy mass towards higher redshifts, we plot the stellar masses of the AGNs in our sample as a function of redshift (see fig. 7). In the left-hand panel of fig. 7 we plot those – AGNs that are detected at FIR wavelengths on top of the underlying distribution of stellar masses of non-AGNs in the GOODS fields. We find no significant evolution in the stellar masses of FIR-detected AGN hosts over the redshift range considered (i.e., ), with these moderate luminosity AGNs residing almost exclusively in M⊙ galaxies at all redshifts ( M⊙ for FIR-detected, – AGNs). Xue et al. (2010) reported similar findings for – AGNs in the CDFs out to and this mass range is also similar to that of optical narrow-line selected AGNs in the local Universe (i.e., ; Kauffmann et al. 2003). We get marginally smaller mean stellar masses when we consider all AGNs for which we can calculate secure host galaxy masses (i.e., 69 per cent; see right-panel of fig. 7; M⊙), indicating that detection at FIR wavelengths biases in favour of slightly higher host galaxy stellar masses (although we note that the mean masses are consistent to within 1 uncertainties). Interestingly, the AGNs in our sample show a weak correlation between and host galaxy stellar mass, which can be expressed as:
| (4) |
This corresponds to a change in the median stellar mass of only a factor of across two orders of magnitude change in (i.e., – ; see fig. 8) and is too weak to account for the prevalence of AGNs among only high mass galaxies.101010We note that this correlation remains largely unchanged when we exclude AGNs from our highest redshift bin (i.e., ), suggesting that selection biases do not have a major effect. In other words, the high host galaxy stellar masses of our AGN sample is not the result of a selection effect. We stress that these results only apply to AGNs with – , it is entirely possible that lower luminosity AGNs (including those below the detection threshold of the CDF surveys) reside in lower mass galaxies. However, since there is no significant evolution in the host galaxy stellar masses of moderate luminosity AGNs we can rule out the possibility that the observed increase in their average is due to a systematic increase in their host galaxy stellar mass with redshift. Instead, we must attribute it to an increase in their SSFRs. Next, we consider whether this increase in their SSFRs is consistent with that observed in the general star-forming (i.e., main-sequence) galaxy population, or whether it signifies a transitioning of AGN host galaxies from starbursting galaxies at to main-sequence/quiescent galaxies today.
In the formalism of Elbaz et al. (2011), secure starburst galaxies have SSFRs that are times higher than those of main-sequence galaxies (here, “secure” implies avoiding any contamination from main-sequence galaxies). This is the case at all redshifts, although the SSFRs of main-sequence galaxies increase at higher redshifts. Thus, to determine whether the observed – trend for X-ray AGNs is caused by a transitioning of their hosts from starbursting to main-sequence galaxies, we will compare their SSFRs over the redshift interval of our sample.
In fig. 9 we plot the SSFRs of the – AGN-hosting galaxies in our sample as a function of redshift. Included in these plots are the SSFRs of normal (i.e., non-AGN-hosting) galaxies with – M⊙ detected in GOODS-H, i.e., only those galaxies with stellar masses within the range of the AGNs in our sample. We also include tracks showing the SSFR- trends for main-sequence galaxies reported in Pannella et al. (2009a) and Elbaz et al. (2011; see their Eq. 13).111111 A fit to the SSFRs of the comparison – M⊙ galaxies shown in fig. 9 reproduces Eq. 13 of Elbaz et al. (2011). In the left hand panel of fig. 9 we plot the SSFRs for the FIR-detected AGNs in our sample. The majority (i.e., 81 per cent ) of these AGNs lie within a factor of 3 of the Elbaz et al. (2011) main-sequence trend, with roughly equal numbers of FIR-detected AGNs outside this range having higher or lower SSFRs (i.e., 47 per cent and 53 per cent of outliers, respectively). However, none of the FIR-detected AGNs in our sample have SSFRs lower than 17 per cent of the Elbaz et al. (2011) main-sequence and are thus unlikely to be quiescent galaxies (c.f., Noeske et al. 2007). Later in this section we use the results from our stacking analyses to estimate what fraction of all (i.e., FIR detected and undetected) – AGNs reside in quiescent galaxies. Over the entire redshift range only 8 (i.e., 10 per cent ) of the 77 FIR-detected, – AGNs with secure host galaxy stellar masses have SSFRs typical of starburst galaxies at their redshifts. This number rises to 11 when we include the 3 upper limits of FIR-undetected sources (i.e., 8 per cent of all 130 AGNs within these redshift and bounds).
The trends seen in the FIR-detected fraction of our AGN sample are reflected in the average SSFRs derived from our stacking analyses (see fig. 9, right-hand panel). The average SSFRs of the AGN host galaxies in our sample lie slightly below the Elbaz et al. (2011) trend for main-sequence galaxies. At , and , – AGNs have average SSFRs that are , and per cent of those of typical main-sequence galaxies at their average redshifts, respectively (i.e., , and ).121212The corresponding results for the – bins are , and per cent; for the – bins they are , and per cent. Since we are effectively comparing against the average SSFRs of – M⊙ galaxies (i.e., see footnote 11), it is unlikely that these lower SSFRs are due to the AGN hosts having higher-than-average stellar masses. Despite being slightly lower, the mean SSFRs of the AGNs in our sample show largely the same magnitude increase as main-sequence galaxies, irrespective of ; a factor of from to and a factor of from to for – AGNs.
As we have already seen, none of the FIR-detected AGNs in our sample have SSFRs typical of quiescent galaxies (i.e., per cent of the average SSFR of main-sequence galaxies at a given redshift). However, this still leaves the 60 per cent of AGNs in our sample that remain undetected at FIR wavelengths. We can use the results from our stacking analyses to place constraints on the fraction of these FIR-undetected, – AGNs that reside in quiescent galaxies. Adopting a Monte Carlo approach, we randomly assign a flux to each FIR-undetected source assuming an underlying log-normal SSFR distribution (Rodighiero et al. in prep.), then calculate the average SSFR of these simulated sources. We repeat this process 1000 times, selecting only those trials whose simulated average SSFRs lie within the minimum and maximum bounds derived from our stack. For each successful trial, we calculate the fraction of AGNs with simulated SSFRs below 10 per cent of SSFRMS (i.e., quiescent). In doing so, we estimate that between 13 and 37 (i.e., 16 and 46 per cent, respectively) of the 81 FIR-undetected AGNs between with securely-determined stellar masses have SSFRs that are consistent with those of quiescent galaxies. These numbers correspond to per cent of all – AGNs within this redshift interval. This fraction is similar in size to the average deficit of AGN SSFRs compared to the main-sequence trend, suggesting that the inclusion of quiescent galaxies in our average SSFRs is responsible for this offset (see also §6.1); 131313By excluding the quiescent 157 per cent of hosts from our average SSFRs, we estimate that the SSFRs of star-forming AGN hosts are 95 per cent of those of typical main-sequence (i.e., non-AGN) galaxies (and consistent to within the various uncertainties).. By incorporating the results derived from the FIR-detected AGNs, we estimate that per cent of – AGNs at 0.5–3 reside in starbursting galaxies and per cent reside in main-sequence galaxies. These fractions do not change significantly with redshift and show a slight preference toward main-sequence galaxies compared to the general population. For example, Noeske et al. (2007) found that 56–67 per cent of galaxies (with similar stellar masses as the AGN hosts considered here) are main-sequence, while 30 per cent are quiescent and 1 per cent are starbursts (although Noeske et al. (2007) defined starbursts as having SSFRs 5 times higher than that of main sequence galaxies, rather than 3 times used here).
Whilst we can only place upper limits on the fractions of AGNs that reside in quiescent and main-sequence galaxies, we are able to report that the SSFRs outlined here are not compatible with a view that AGN hosts tend to be strongly starbursting galaxies, nor that moderate luminosity AGNs have transitioned from residing in starburst galaxies at high redshifts to main-sequence galaxies at . This is in general agreement with Xue et al. (2010), although they found that X-ray AGNs in the CDFs have SFRs that are a factor of 2-3 times higher compared to a stellar mass-matched sample of non-AGNs. However, we note that their SFRs were derived from 24 observations, which are more susceptible to contamination from either emission from the AGN or strong spectral features (i.e., PAH lines).
Our results disfavour changes in either the stellar masses of AGN hosts and/or a transitioning of their hosts from main-sequence/quiescent to starbursting galaxies as giving rise to the observed increase in AGN at higher redshifts. We have also shown that the SSFRs of AGN hosts are only marginally lower (i.e., per cent lower), than those of main-sequence galaxies at . This extends the work of Lutz et al. (2010) by quantifying their suggestion that moderate luminosity AGNs typically reside in main-sequence galaxies undergoing internally-induced evolution. We further explore the consequences of this interpretation in §6.
5.2.1 The red rest-frame colours of AGN-hosting galaxies
Here we take a brief aside to address a specific question regarding the rest-frame optical colours of the AGN host galaxies explored in this study: if the majority of moderate-luminosity AGNs reside in star-forming, main-sequence galaxies, then why are their host galaxies generally redder than usually expected for these types of galaxies (i.e, see fig. 3)? The per cent difference in the average SSFRs of AGN hosts is too small to account for their red colours. Instead, the answer likely lies in the high masses of AGN host galaxies. More massive star-forming galaxies tend to be redder than their lower mass counterparts with similar SSFRs due to increased levels of dust obscuration in these galaxies (e.g., Pannella et al. 2009a). Indeed, when we compare the rest-frame colours of our (– ) AGN hosts against those of non-AGN-hosting, main-sequence galaxies with similar stellar masses (i.e., within 0.2 dex of the median stellar mass of the AGN hosts), we find that they are remarkably similar (see Xue et al. 2010 and our fig. 10). This is contrary to a number of recent studies reporting that X-ray AGNs often have rest-frame colours offset from the majority of the galaxy population (i.e., within the so-called “green valley”, rather than either the “red sequence” or “blue cloud”; see our fig. 11), which has been interpreted as evidence of the quenching of star formation by the AGN (e.g. Nandra et al. 2007; Schawinski et al. 2007; Georgakakis et al. 2008; Bundy et al. 2008; Silverman et al. 2008). Instead, once the effects of reddening are correctly taken into account, AGN hosts display largely the same distribution of intrinsic colours as the general galaxy population, as was recently shown by Cardamone et al. (2010). As further confirmation of this, the fractions of main-sequence and quiescent AGN hosts reported here (see §5.2) are broadly consistent with the fractions of star-forming (blue cloud) hosts reported in Cardamone et al. (2010), although they report slightly higher fractions of quiescent (red sequence) hosts (likely due to the different approaches used to identify quiescent galaxies, i.e., infrared vs. optical diagnostics). Thus, the hosts of moderate AGNs have largely the same fundamental stellar properties (i.e., rest-frame colours, SFRs, SSFRs) as their non-AGN-hosting counterparts of similar stellar mass.
5.3 The optical to far-infrared SEDs of X-ray AGNs
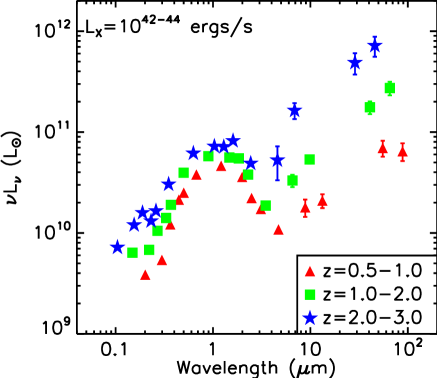
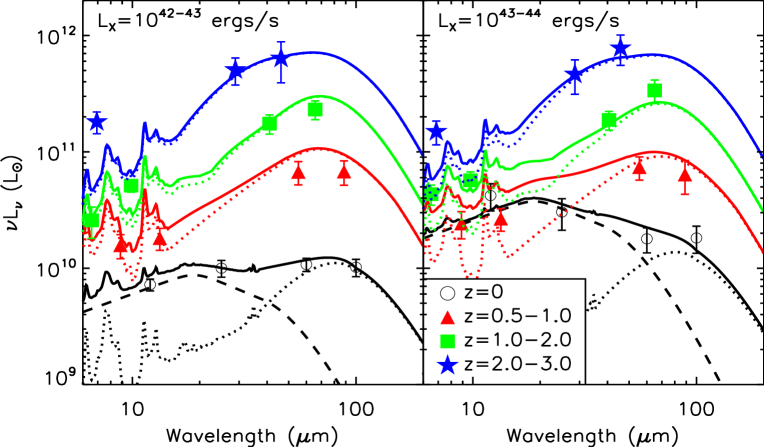
If the observed increase in of AGNs with redshift is solely due to the evolving SSFR of their main-sequence hosts, as our results seem to suggest, we should expect their infrared SEDs to be increasingly dominated by star formation at higher redshifts. In fig. 12 we plot the average rest-frame SEDs traced out by the optical to far-infrared bands for AGNs in each of our redshift bins. While the optical to near infrared portions of the average AGN SEDs show only modest change with redshift, both the mid (i.e., 16 and 24 ) and far-infrared (i.e., 100 and 160 ) portions show a strong increase with increasing redshift, as previously reported by Mullaney et al. (2010). This increase is strongest at FIR wavelengths meaning that the average infrared SED of – AGNs is redder at higher redshifts.
Is the change in the average AGN SED consistent with pure evolution of the SSFR of main-sequence galaxies? To assess this we predict the infrared SEDs of high redshift AGNs by crudely assuming that only the SSFRs of their host galaxies have evolved with redshift, then compare the observed SEDs against these predictions. To generate the predicted SEDs we first fit the average infrared SED of BAT/IRAS AGNs with a model comprising an AGN and a single host galaxy component (see Mullaney et al. 2011 for a description of the fitting procedure). The AGN component derived from this fit is then kept constant throughout. To generate the host-galaxy components for the high redshift AGNs, we estimate the expected of the hosts based on their average stellar masses and redshifts (using Eq. 2 of Pannella et al. 2009a). We then select the SED from the Chary & Elbaz (2001) library that most closely matches this and add it to the AGN component from the fit to produce the total predicted SED (i.e., AGN+host). The SEDs generated in this way are shown in fig. 13 and are roughly consistent with the observed mean AGN SEDs in each redshift bin (the slight discrepancy at MIR wavelengths for our bin is likely due to the increased strength of PAH features in high-z star-forming galaxies compared to the local templates used here; Chary & Pope 2010; Elbaz et al. 2011). Since these predictions only take into account the change in the SSFR from , we may not expect to see any evidence of the reduced SSFRs of AGNs compared to main-sequence AGNs (see §5.1.2) in this plot, especially if AGNs also have similarly reduced SSFRs (e.g., Salim et al. 2007). Whilst this is only a crude analysis, it does show that the whole AGN+host galaxy infrared SED, rather than just the FIR portion, evolves in a manner broadly consistent with an evolving main-sequence SSFR. An important prediction that arises from this scenario is that the average MIR spectra of AGNs are increasingly dominated by host galaxy spectral features (e.g., PAH features) at higher redshifts. We will use archival Spitzer-IRS spectra to determine whether this is the case in a future paper.
6 Discussion
We have used the deepest FIR data currently available to probe the SFRs and SSFRs of AGN host galaxies to . Our main results are: (a) there is no correlation between star formation and in moderate luminosity AGNs (i.e., – ), (b) there is a strong, monotonic, increase in the SFRs and SSFRs of the hosts of these AGNs from to 3 (c) that per cent of AGNs reside in starbursting galaxies, the majority being hosted by main-sequence, star-forming, galaxies and (d) the increase in the SSFRs of the AGN hosts is broadly consistent with the increase in the SSFRs of main-sequence galaxies in general. In this section, we explore the possible implication of these results in terms of our understanding of the co-evolution of AGNs and their host galaxies.
6.1 The influence of moderate luminosity AGNs on star formation
The lack of any strong correlation between and in any of our redshift bins suggests that instantaneous nuclear and global star formation activity are largely decoupled for moderate luminosity AGNs at . At first sight, this would seem to imply that nuclear activity has little impact on the levels of star formation taking place within their host galaxies, bringing the role of AGN/galaxy feedback in the evolution of these systems into question. However, it has recently been reported that nuclear (i.e., kpc), rather than global, SFRs are strongly correlated with black hole accretion rate and, thus, AGN luminosity (Diamond-Stanic & Rieke 2011). This would suggest that the physical links between black hole growth and star-formation activity are localised to central regions of the host galaxy. We should also consider the effects that X-ray variability will have on our results. Since X-ray observations only take a snapshot of nuclear activity, the lack of a correlation between and could simply be due to AGN variability introducing scatter (e.g., Hopkins & Hernquist 2006). One way to test this, which is beyond the scope of this paper, would be to use X-ray stacking analyses to calculate the average of all galaxies as a function of , assuming that a wide cross-section of the galaxy population will sample all stages of AGN variability at a given epoch.
The evidence that the SSFRs of galaxies hosting moderate luminosity AGNs are marginally (i.e., per cent) lower than their non-AGN-hosting counterparts, whilst tentative, may hint to a causal connection between nuclear activity and star formation in their hosts. However, with the data used here, it is difficult to determine whether the AGN is playing a direct role in the transitioning of a galaxy from the main-sequence to a more quiescent state (i.e., quenching). As we suggested in §5.2, it may simply be the case that a non-negligible fraction of moderate luminosity AGNs are triggered in quiescent galaxies, rather than in star-forming galaxies galaxies which then transition to a more quiescent state. Besides, the difference is so slight (and in some of our redshift bins, negligible) it is difficult to argue that quenching by moderate levels of nuclear activity has any significant impact on the star-formation activity of their host galaxies.
As most previous studies of AGN hosts have largely focussed on SFRs, rather than SSFRs, it is difficult to directly compare our findings with these earlier studies. In any case, they have arrived at conflicting conclusions, reporting increased (e.g., Gu et al. 2006, Lacy et al. 2007), suppressed (e.g., Ho 2005, Kim et al. 2006) or no significant difference (e.g., Silverman et al. 2009) in the SFRs of AGN hosts depending on the type/luminosity of the AGNs in their samples and/or selection method. By focussing on SFRs (rather than SSFRs) these earlier studies were susceptible to differences between the masses of their AGN and control (galaxy) samples. However, by comparing the SFRs of mass-matched samples of galaxies (synonymous to comparing SSFRs), Xue et al. (2010) found that the SFRs of AGN hosts at are a factor of 2-3 higher than those non-AGNs, whereas this difference largely disappears at . By contrast, in their study of the ultraviolet-derived SSFRs of galaxies in the local Universe, Salim et al. (2007) found that AGNs have suppressed SSFRs compared to star-forming galaxies, although they found that AGNs had, on average, per cent lower SSFRs, compared to the per cent reported here (see their Figs. 17 and 18). At face value, this latter point may suggest that nuclear activity plays a stronger role in quenching star-formation at low redshifts. However, it is important to note that our sample selection and analyses differ considerably from that of Salim et al. (2007), which may account for some of the disagreements between these studies. In the end, clear evidence of AGN-driven feedback (e.g., Nesvadba et al. 2006; Alexander et al. 2010) will be needed to demonstrate that any suppression of star formation is due to them having a direct, causal influence on their host galaxies.
6.2 The majority of moderate luminosity, distant AGNs reside in normal, star-forming galaxies at all redshifts.
Our results provide convincing evidence that the majority of distant, moderate luminosity AGNs reside in main-sequence, star-forming galaxies. To interpret the implications of this result in terms of the co-evolution of AGNs and their host galaxies, we will consider the typical characteristics of galaxies that lie both on and off the main-sequence.
Main-sequence galaxies tend to be late-type spirals undergoing internally driven evolution (e.g., Noeske et al. 2007). Star formation in these galaxies predominantly takes place in their disks and is likely triggered by internal processes such as turbulence and disk instabilities (e.g., Elmegreen et al. 2007; Genzel et al. 2008). In contrast, starbursting galaxies - the other main category of star-forming galaxies - often show signs of having recently undergone a major merger event (mass ratio ), meaning their star formation is more likely to be merger induced (e.g., Daddi et al. 2007; Elbaz et al. 2007). It is important to note that the starburst phase of a typical major merger is relatively short lived, with only around of the life of the merger being spent in this regime (Di Matteo et al. 2008). However, for the rest of the time, the merger is not actively accelerating star formation beyond what would be expected under normal, internal processes. Finally, at the other extreme are quiescent galaxies that have ceased to be actively forming stars and have SSFRs significantly lower (i.e., per cent; Noeske et al. 2007) than those of typical main-sequence galaxies.
Based on this emerging picture, the results presented here strongly suggest that moderate levels of nuclear activity have mostly taken place in galaxies undergoing internally induced, low efficiency star formation, as opposed to starbursting mergers – a view consistent with the conclusions of Xue et al. (2010). Of course a fraction of these AGNs may reside in merging systems that have ceased starbursting, although even a conservative estimate places this fraction at around per cent.141414Based on per cent of the AGNs in our sample having starburst-level SSFRs, and assuming that a typical merger spends only of its time in a starburst phase. However, even if this is the case, any merging has since ceased triggering starbursts, meaning the merger event is no longer having a significant effect on the star formation activity of these galaxies. Furthermore, since it seems unlikely that a merger can channel material onto a black hole without also inducing significant amounts of star formation, this interpretation also implies that the majority of moderate nuclear activity has been triggered and driven by internal processes since . Since main-sequence galaxies at high redshifts (i.e., ) are often dominated by gravitationally unstable, clumpy disks (e.g., Cowie et al. 1996; Elmegreen et al. 2004; Elmegreen et al. 2007; Förster Schreiber et al. 2006, 2009; Genzel et al. 2008), we speculate that disk instabilities are driving the inflows that lead to nuclear activity in their cores. Indeed, theoretical models have show that the giant clumps can directly fuel black hole growth (e.g., Elmegreen et al. 2008), and can more generally trigger a central gas inflow fuelling an AGN (Bournaud & Dekel, in prep.).
These findings are also consistent with the conclusions of recent studies that have looked at recent merger histories and morphologies of galaxies hosting moderate luminosity AGNs. For example, when they compared the morphologies of AGN-hosting galaxies with those of the general galaxy population, Cisternas et al. (2011) showed that the same fraction of each sample showed signs of recent or ongoing mergers, while Schawinski et al. (2011) used a subsample of 28 X-ray AGNs in the CDFS to show that this was also likely the case at (see also Kocevski et al, submitted, who have performed morphological analyses for a larger sample of AGNs, many of which overlap the sample used in this study). Our results build on these earlier findings by using infrared-derived SSFRs - arguably a more reliable and quantifiable means of identifying main-sequence galaxies - to show that the vast majority of all moderate nuclear activity in these deep fields is accompanied by internally-induced, rather than violent merger-induced star-formation.
Whilst this interpretation appears to apply for moderate luminosity AGNs at all redshifts since , it is particularly pertinent at , when these AGNs dominated the integrated black hole growth taking place in the Universe. Indeed, integrating the analytic AGN X-ray luminosity functions of Ueda et al. (2003) and assuming the luminosity-dependent bolometric correction factor of Marconi et al. (2004) reveals that – AGNs have accounted for 65 per cent of all black hole growth since . Therefore, it would seem that the majority of the volume-averaged black hole mass accretion since has taken place in galaxies undergoing internally-induced evolution, which also appears to be the case for the majority of stellar mass build up over this redshift range (e.g., Bell et al. 2005; Jogee et al. 2009). What this means for the concurrent build up of black hole and stellar mass to today’s – relation will be explored in a follow-up paper (Mullaney et al., in prep.) but it is important to bear in mind that, by assuming the same luminosity functions and bolometric corrections (although see footnote 2), we calculate that the majority (i.e., per cent) of all black hole mass accretion (i.e., growth) in the Universe since would have taken place in more luminous AGNs (i.e., ).
On the other hand, evidence supporting the importance of mergers on the concurrent growth of black holes and their host galaxies has been presented in a number of previous studies. For example, Alexander et al. (2005) showed that per cent of sub-mm galaxies, which often lie above the main-sequence (in terms of SSFR), contain moderate to high luminosity (i.e., log/) AGNs (see also, e.g., Lutz et al. 2005; Valiante et al. 2007; Menéndez-Delmestre et al. 2007; Pope et al. 2008; Coppin et al. 2010). Furthermore, Page et al. (2004) showed that a significant proportion of luminous, absorbed quasars reside in strongly star-forming galaxies (although some of these may now be recognised as main-sequence galaxies at high redshifts). More recently, Feruglio et al. (2011) identified two Compton-thick, luminous (i.e., ) AGNs in the CDF-S whose host galaxies are also undergoing a period of intense star formation. Taken in conjunction with the arguments presented above it is tempting to speculate that, while internal processes have largely driven moderate nuclear activity, external (i.e., non-secular, major-merger driven) processes have played a more major, perhaps dominant, role in the build up of black hole and galaxy bulge mass and, thus, formed today’s – relationship – as suggested by the theoretical models of Hopkins & Hernquist (2006) and recently discussed in Lutz et al. (2010). However, this interpretation would be difficult to reconcile with emerging evidence that long lived, internal processes were the main driver for star formation at these high redshifts (e.g., Daddi et al. 2008, 2010a). Furthermore, Mainieri et al. (2011) recently used a combination of optical spectroscopy and SED fitting to measure the host-galaxy properties of luminous (i.e., ) Type-2 quasars, reporting remarkably similar fractions of main-sequence and quiescent hosts as those found here for moderate luminosity AGNs. If confirmed, such findings would imply that the majority of all nuclear activity has taken place in galaxies undergoing internally-driven evolution and not in major-mergers.
6.3 The fraction of main-sequence galaxies that host AGNs
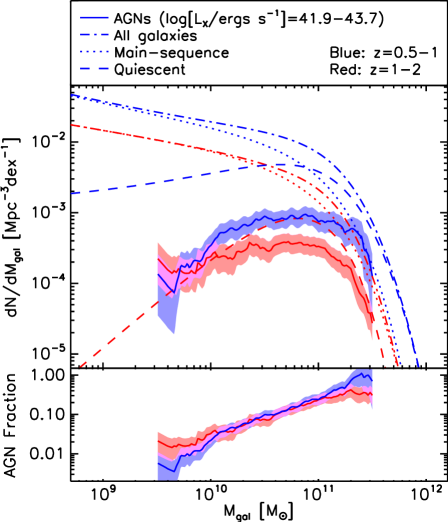
We have shown that the majority (i.e., per cent) of distant, moderate luminosity AGNs reside in main-sequence galaxies. However, these AGNs are not evenly distributed among the main-sequence population. Instead, they preferentially reside in massive galaxies (i.e., M⊙) both locally (e.g., Kauffmann et al. 2003) and at high redshifts (e.g., Silverman et al. 2009; Xue et al. 2010; also our fig. 7).151515It was recently suggested that stellar mass, combined with emission lines, can be used as an effective AGN diagnostic out to (in the “Mass-Excitation” diagram; Juneau et al. 2011). The lack of evolution in the stellar mass of moderate luminosity X-ray AGN since suggests that the diagnostic power of this parameter could be extended to higher redshift. Therefore, while nuclear activity is relatively rare in the overall galaxy population ( per cent of all M⊙ galaxies), a significant fraction of high mass galaxies host moderate luminosity AGNs. We know that locally, up to 80 per cent of M⊙ galaxies are hosting an AGN (Best et al. 2005).
Recently, a number of studies have shown that the mass function of main-sequence galaxies has maintained a roughly constant shape since , with only its normalisation changing with redshift (Ilbert et al. 2010; Peng et al. 2010). The range of characteristic masses at which this mass function turns over (i.e., ) is remarkably similar to the typical stellar masses of galaxies hosting moderate luminosity AGNs (see fig. 7). Whilst the similarity between these two mass ranges may be coincidental, it is interesting to explore it further by considering roughly what fraction of main-sequence galaxies within this mass range host moderate luminosity AGNs.
In their recent study of the rest-frame colours, magnitudes and host galaxy masses of AGNs in the Chandra Deep Fields, Xue et al. (2010) noted that the fraction of galaxies containing AGNs in similar and redshift bins to those considered here (i.e., –1, 1–2, 2–3 and log/41.9–43.7) increases strongly as a function of host galaxy mass, but shows only a weak change with redshift. By combining the AGN fractions calculated in that study with the galaxy stellar mass functions published in Ilbert et al. (2010), we calculate both the mass function and fraction of galaxies hosting moderate luminosity AGNs as a function of galaxy stellar mass (see fig. 14).161616We use the mass function of “intermediate activity” galaxies from Ilbert et al. (2010) as they have roughly the same SSFRs as main-sequence galaxies at the redshifts considered. We find that the fraction of main-sequence galaxies hosting log/41.9–43.7 AGNs increases strongly from 1–2 per cent at 3 M⊙ to 20 per cent at 3 M⊙, although we note the large uncertainties in these fractions at high stellar masses due to the relatively small number of AGNs hosted in M⊙ galaxies in the CDFs (see Xue et al. 2010, Fig 12k). Assuming that nuclear activity is a largely stochastic process, these fractions imply that the duty cycle of AGNs in more massive galaxies is significantly longer than in lower mass galaxies. We can rule out selection effects as producing this strong increase because (a) there is only a very weak correlation between and host stellar mass (see Fig. 8) and (b) the Xue et al. (2010) sample is largely complete within the log/41.9–43.7 range. Similarly, incompleteness due to the effects of X-ray absorption is also unlikely to produce this effect. We again stress that these calculations only apply to AGNs within the log/41.9–43.7 luminosity range.
Whilst we acknowledge that these fractions are only crude estimates, it is clear that a considerable fraction of main-sequence galaxies with masses above the turnover of the galaxy mass function host moderate luminosity AGNs. Incidentally, this turnover is similar to the stellar mass range that has dominated the star formation rate density since . While we are reluctant to over-interpret this result, especially in light of the arguments outlined above, if nuclear activity is necessary to quench the growth of massive galaxies, then there is no lack of it in these galaxies. However, without clear evidence of AGN “feedback” from these moderate luminosity AGNs (e.g., powerful, large scale outflows such as those reported in Nesvadba et al. 2006; Alexander et al. 2010 and Rupke & Veilleux 2011), we are disinclined to take any firm conclusions on AGN quenching from this analysis.
7 Summary
We have used the deepest surveys yet undertaken with the Chandra, Spitzer and Herschel telescopes to explore the infrared properties and star formation rates of the host galaxies of X-ray AGNs out to . By using the ultra-deep GOODS-Herschel observations to identify infrared counterparts to X-ray AGNs in the Chandra Deep Fields we reach an infrared detection rate roughly 2 times higher than any previous far-infrared (i.e., FIR) study of AGNs in these fields. In at least 94 per cent of cases of AGNs at , the observed 100 and 160 wavelengths probed by Herschel-PACS are dominated by emission from the host galaxy meaning that we can reliably use Herschel fluxes to measure the (specific) star formation rates of the host galaxies of AGNs.
The main results from this study can be summarised as follows:
-
•
There is no clear correlation between AGN power and infrared luminosity (and, by inference, star formation rates) for moderate luminosity AGNs at all redshifts considered (see §5.1).
-
•
The previously observed increase in the mid to far-infrared luminosities with redshift is entirely consistent with being caused by the increase in the specific star formation rates (i.e., SSFRs) observed in normal, star-forming (i.e., main-sequence) galaxies (see §5.2).
-
•
The majority (i.e per cent) of moderate luminosity (i.e., – ) AGNs reside in main-sequence galaxies. We estimate that only per cent reside in starbursting galaxies and per cent reside in quiescent galaxies. These fractions display a slight preference toward main-sequence compared to the general galaxy population and a remarkably similar to those recently reported for Type 2 Quasars (see §5.2 and §6.2).
-
•
The average SSFRs of moderate AGN hosts are only marginally lower (i.e., per cent lower) than those of normal main-sequence galaxies, with this small deficit being due to a fraction of AGNs residing in quiescent galaxies. While this may hint at a causal connection between moderate levels of nuclear activity and star formation (e.g., AGN quenching ongoing star formation), the impact on SSFRs is clearly very limited; (see §5.2 and 6.1).
-
•
The observed 16–160 SEDs are also broadly consistent with being more strongly dominated by the host galaxy at higher redshifts (see §5.3). Parenthetically, we note that this means that using infrared diagnostics to identify AGNs will be increasingly difficult at higher redshift.
-
•
The host galaxies of moderate luminosity AGNs have the same red rest-frame colours as non-AGN-hosting galaxies of similar mass. Despite actively forming stars, these massive (i.e., M⊙) galaxies have red colours, likely due to their high concentrations of dust (see §5.2.1).
-
•
The fraction of main-sequence galaxies experiencing moderate levels of nuclear activity increases strongly with host galaxy stellar mass, from a few per cent at M⊙ to per cent at M⊙(see §6.3).
In our discussion we argue that the results presented here strongly suggest that the majority of moderate nuclear activity in the Universe has taken place in normal star forming galaxies undergoing internal evolution, rather than in violent mergers (see §6.2). Since merger-driven inflows are ruled out in the majority of cases, we speculate that disk instabilities play an important role in fuelling nuclear activity, as suggested by some theoretical models. What is remarkable is that we do not see any correlation between the levels of AGN and star formation activity taking place within these galaxies. Indeed, the only significantly different aspect of AGN host galaxies compared to the general galaxy population are their high stellar masses, which appears to have been the main distinguishing feature of galaxies hosting moderate AGNs since .
acknowledgements
We are grateful to N. Drory for sharing the SED-fitting code used to estimate galaxy stellar masses. We thank V. Strazzullo and the anonymous referee for their useful comments. We acknowledge funding from a European FP7 Co-fund Fellowship (JRM) and the Science and Technology Funding Council (DMA). DE and MP acknowledge financial support from the French Agence Nationale de la Recherche (ANR) project HUGE, ANR-09-BLAN-0224. This research was supported by the ERC-StG grant UPGAL 240039 and by the French ANR under contract ANR-08-JCJC-0008. This work is based on observations made with Herschel, a European Space Agency Cornerstone Mission with significant participation by NASA. Support for this work was provided by NASA through an award issued by JPL/Caltech.
| (7) | (8) | (9) | (10) | (11) | ||||||
|---|---|---|---|---|---|---|---|---|---|---|
| (1) | (2) | (3) | (4) | (5) | (6) | SFR | SSFR | |||
| Index | Description | |||||||||
| 1 | All | 504 | 276 (55) | 338 (67) | 1.41 | 1.98 | ||||
| 2 | AGN | 367 | 228 (62) | 255 (69) | 1.72 | 7.04 | ||||
| 3 | Starbursts | 41 | 10 (24) | 26 (63) | 0.67 | 0.11 | ||||
| 4 | 219 | 127 (58) | 159 (73) | 1.61 | 8.66 | |||||
| 5 | 50 | 20 (40) | 46 (92) | 0.81 | 4.93 | |||||
| 6 | 103 | 60 (58) | 83 (81) | 1.45 | 7.50 | |||||
| 7 | 66 | 47 (71) | 30 (45) | 2.49 | 16.59 | |||||
| 8 | 36 | 18 (50) | 35 (97) | 0.81 | 2.86 | |||||
| 9 | 61 | 39 (64) | 48 (79) | 1.44 | 3.09 | |||||
| 10 | 22 | 12 (55) | 10 (45) | 2.46 | 3.85 | |||||
| 11 | 14 | 2 (14) | 11 (79) | 0.80 | 20.00 | |||||
| 12 | 42 | 21 (50) | 35 (83) | 1.46 | 27.14 | |||||
| 13 | 44 | 35 (80) | 20 (45) | 2.50 | 34.44 | |||||
| 14 | 91 | 45 (49) | 77 (85) | 0.76 | 1.78 | |||||
| 15 | 134 | 76 (57) | 111 (83) | 1.42 | 5.29 | |||||
| 16 | 81 | 61 (75) | 38 (47) | 2.52 | 26.15 |
Notes:(1) Index, (2) Description of bin; “All” includes all X-ray detected sources, irrespective of classification (i.e., including AGNs, galaxies and stars), rows 4-16 only include AGNs (3) Number of X-ray AGNs with known redshifts covered by the GOODS-H survey, excluding those that show signs of being AGN-dominated at FIR-wavelengths (see §4.1) (4) As for column 3, but only counting those that are undetected at FIR wavelengths (i.e., the number of sources in each stack). The numbers in brackets are the fractions (in per cent) (5) As for column 3, but only counting those for which we obtain a “secure” host galaxy stellar masses (see §4.2). The numbers in brackets are the fractions (in per cent) (6) Mean redshift (7) Mean rest-frame, absorption corrected 2-10 keV luminosity (8) Mean stellar mass (9) Mean infrared luminosity calculated from the stacked 100 or 160 (depending on redshift, see §4.1) of the undetected sources combined with the mean 100 or 160 flux of the detected sources (10) Host galaxy star formation rates derived from the infrared luminosities in column 10 using the prescription of Kennicutt (1998) (11) Specific star formation rates calculated by dividing the star formation rates in column 11 by the stellar masses in column 9.
References
- Aird et al. (2010) Aird J. et al., 2010, MNRAS, 401, 2531
- Alexander et al. (2003) Alexander D. M. et al., 2003, AJ, 126, 539
- Alexander et al. (2005) Alexander D. M., Smail I., Bauer F. E., Chapman S. C., Blain A. W., Brandt W. N., Ivison R. J., 2005, Nature, 434, 738
- Alexander et al. (2010) Alexander D. M., Swinbank A. M., Smail I., McDermid R., Nesvadba N. P. H., 2010, MNRAS, 402, 2211
- Ammons et al. (2011) Ammons S. M. et al., 2011, ArXiv e-prints, 1107.2147
- Barger et al. (2003) Barger A. J. et al., 2003, AJ, 126, 632
- Barger et al. (2005) Barger A. J., Cowie L. L., Mushotzky R. F., Yang Y., Wang W.-H., Steffen A. T., Capak P., 2005, AJ, 129, 578
- Barger et al. (2008) Barger A. J., Cowie L. L., Wang W.-H., 2008, ApJ, 689, 687
- Bauer et al. (2004) Bauer F. E., Alexander D. M., Brandt W. N., Schneider D. P., Treister E., Hornschemeier A. E., Garmire G. P., 2004, AJ, 128, 2048
- Bell et al. (2005) Bell E. F. et al., 2005, ApJ, 625, 23
- Berta et al. (2010) Berta S. et al., 2010, A&A, 518, L30
- Bertin & Arnouts (1996) Bertin E., Arnouts S., 1996, A&AS, 117, 393
- Best et al. (2005) Best P. N., Kauffmann G., Heckman T. M., Brinchmann J., Charlot S., Ivezić Ž., White S. D. M., 2005, MNRAS, 362, 25
- Bluck et al. (2011) Bluck A. F. L., Conselice C. J., Almaini O., Laird E. S., Nandra K., Grützbauch R., 2011, MNRAS, 410, 1174, Stellar masses of AGN-hosting galaxies. Lx/K< 2 selectoin.
- Boyle & Terlevich (1998) Boyle B. J., Terlevich R. J., 1998, MNRAS, 293, L49
- Bruzual & Charlot (2003) Bruzual G., Charlot S., 2003, MNRAS, 344, 1000
- Bundy et al. (2008) Bundy K. et al., 2008, ApJ, 681, 931
- Buser & Kurucz (1978) Buser R., Kurucz R. L., 1978, A&A, 70, 555
- Calzetti et al. (2000) Calzetti D., Armus L., Bohlin R. C., Kinney A. L., Koornneef J., Storchi-Bergmann T., 2000, ApJ, 533, 682
- Canalizo & Stockton (2001) Canalizo G., Stockton A., 2001, Apj, 555, 719
- Capak et al. (2004) Capak P. et al., 2004, AJ, 127, 180
- Cardamone et al. (2010) Cardamone C. N., Urry C. M., Schawinski K., Treister E., Brammer G., Gawiser E., 2010, ApJL, 721, L38
- Chary & Elbaz (2001) Chary R., Elbaz D., 2001, ApJ, 556, 562
- Chary & Pope (2010) Chary R.-R., Pope A., 2010, ArXiv e-prints, 1003.1731
- Cisternas et al. (2011) Cisternas M. et al., 2011, ApJ, 726, 57
- Coppin et al. (2010) Coppin K. et al., 2010, ApJ, 713, 503
- Cowie et al. (1996) Cowie L. L., Songaila A., Hu E. M., Cohen J. G., 1996, AJ, 112, 839
- Daddi et al. (2010a) Daddi E. et al., 2010a, ApJ, 713, 686
- Daddi et al. (2008) Daddi E., Dannerbauer H., Elbaz D., Dickinson M., Morrison G., Stern D., Ravindranath S., 2008, ApJ, 673, L21
- Daddi et al. (2007) Daddi E. et al., 2007, ApJ, 670, 156
- Daddi et al. (2010b) Daddi E. et al., 2010b, ApJL, 714, L118
- Di Matteo et al. (2008) Di Matteo P., Bournaud F., Martig M., Combes F., Melchior A. L., Semelin B., 2008, A&A, 492, 31
- Di Matteo et al. (2005) Di Matteo T., Springel V., Hernquist L., 2005, Nature, 433, 604
- Diamond-Stanic & Rieke (2011) Diamond-Stanic A. M., Rieke G. H., 2011, ArXiv e-prints, 1106.3565
- Drory et al. (2004) Drory N., Bender R., Hopp U., 2004, ApJ, 616, L103
- Drory et al. (2009) Drory N. et al., 2009, ApJ, 707, 1595
- Dunne et al. (2009) Dunne L. et al., 2009, MNRAS, 394, 3
- Elbaz et al. (2007) Elbaz D. et al., 2007, A&A, 468, 33
- Elbaz et al. (2011) Elbaz D. et al., 2011, ArXiv e-prints, 1105.2537
- Elbaz et al. (2010) Elbaz D. et al., 2010, A&A, 518, L29
- Elmegreen et al. (2008) Elmegreen B. G., Bournaud F., Elmegreen D. M., 2008, ApJ, 684, 829
- Elmegreen et al. (2004) Elmegreen D. M., Elmegreen B. G., Hirst A. C., 2004, ApJL, 604, L21
- Elmegreen et al. (2007) Elmegreen D. M., Elmegreen B. G., Ravindranath S., Coe D. A., 2007, ApJ, 658, 763
- Ferrarese & Merritt (2000) Ferrarese L., Merritt D., 2000, ApJ, 539, L9
- Feruglio et al. (2011) Feruglio C., Daddi E., Fiore F., Alexander D. M., Piconcelli E., Malacaria C., 2011, ApJL, 729, L4
- Förster Schreiber et al. (2009) Förster Schreiber N. M. et al., 2009, ApJ, 706, 1364
- Förster Schreiber et al. (2006) Förster Schreiber N. M. et al., 2006, ApJ, 645, 1062
- Franceschini et al. (1999) Franceschini A., Hasinger G., Miyaji T., Malquori D., 1999, MNRAS, 310, L5
- Gebhardt et al. (2000) Gebhardt K. et al., 2000, ApJ, 539, L13
- Genzel et al. (2008) Genzel R. et al., 2008, ApJ, 687, 59
- Genzel et al. (2010) Genzel R. et al., 2010, MNRAS, 407, 2091
- Georgakakis et al. (2008) Georgakakis A. et al., 2008, MNRAS, 385, 2049
- Granato et al. (2004) Granato G. L., de Zotti G., Silva L., Bressan A., Danese L., 2004, ApJ, 600, 580
- Grogin et al. (2005) Grogin N. A. et al., 2005, ApJ, 627, L97
- Gu et al. (2006) Gu Q., Melnick J., Cid Fernandes R., Kunth D., Terlevich E., Terlevich R., 2006, MNRAS, 366, 480
- Häring & Rix (2004) Häring N., Rix H.-W., 2004, ApJ, 604, L89
- Hasinger et al. (2005) Hasinger G., Miyaji T., Schmidt M., 2005, A&A, 441, 417
- Hatziminaoglou et al. (2010) Hatziminaoglou E. et al., 2010, A&A, 518, L33
- Heckman et al. (2004) Heckman T. M., Kauffmann G., Brinchmann J., Charlot S., Tremonti C., White S. D. M., 2004, ApJ, 613, 109
- Ho (2005) Ho L. C., 2005, ApJ, 629, 680
- Hony et al. (2011) Hony S. et al., 2011, A&A, 531, A137
- Hopkins & Hernquist (2006) Hopkins P. F., Hernquist L., 2006, ApJS, 166, 1
- Hopkins et al. (2006) Hopkins P. F., Hernquist L., Cox T. J., Di Matteo T., Robertson B., Springel V., 2006, ApJS, 163, 1
- Hopkins et al. (2007) Hopkins P. F., Richards G. T., Hernquist L., 2007, ApJ, 654, 731
- Ilbert et al. (2010) Ilbert O. et al., 2010, ApJ, 709, 644
- Ivison et al. (2010) Ivison R. J., Smail I., Papadopoulos P. P., Wold I., Richard J., Swinbank A. M., Kneib J.-P., Owen F. N., 2010, MNRAS, 404, 198
- Jogee et al. (2009) Jogee S. et al., 2009, ApJ, 697, 1971
- Juneau et al. (2011) Juneau S., Dickinson M., Alexander D. M., Salim S., 2011, ApJ, 736, 104
- Kauffmann et al. (2003) Kauffmann G. et al., 2003, MNRAS, 346, 1055
- Kennicutt (1998) Kennicutt R. C. J., 1998, ARA&A, 36, 189
- Kim et al. (2006) Kim M., Ho L. C., Im M., 2006, ApJ, 642, 702
- Kormendy & Kennicutt (2004) Kormendy J., Kennicutt R. C. J., 2004, ARA&A, 42, 603
- Lacy et al. (2007) Lacy M., Sajina A., Petric A. O., Seymour N., Canalizo G., Ridgway S. E., Armus L., Storrie-Lombardi L. J., 2007, ApJ, 669, L61
- Lutz et al. (2010) Lutz D. et al., 2010, ApJ, 712, 1287
- Lutz et al. (2011) Lutz D. et al., 2011, A&A, 532, A90
- Lutz et al. (2005) Lutz D., Valiante E., Sturm E., Genzel R., Tacconi L. J., Lehnert M. D., Sternberg A., Baker A. J., 2005, ApJL, 625, L83
- Magdis et al. (2010) Magdis G. E., Rigopoulou D., Huang J.-S., Fazio G. G., 2010, MNRAS, 401, 1521
- Magnelli et al. (2011) Magnelli B., Elbaz D., Chary R. R., Dickinson M., Le Borgne D., Frayer D. T., Willmer C. N. A., 2011, A&A, 528, A35
- Mainieri et al. (2011) Mainieri V. et al., 2011, ArXiv e-prints, 1105.5395
- Marconi et al. (2004) Marconi A., Risaliti G., Gilli R., Hunt L. K., Maiolino R., Salvati M., 2004, MNRAS, 351, 169
- Menéndez-Delmestre et al. (2007) Menéndez-Delmestre K. et al., 2007, ApJL, 655, L65
- Merloni (2004) Merloni A., 2004, MNRAS, 353, 1035
- Mihos & Hernquist (1996) Mihos J. C., Hernquist L., 1996, ApJ, 464, 641
- Mullaney et al. (2011) Mullaney J. R., Alexander D. M., Goulding A. D., Hickox R. C., 2011, MNRAS, 414, 1082
- Mullaney et al. (2010) Mullaney J. R., Alexander D. M., Huynh M., Goulding A. D., Frayer D., 2010, MNRAS, 401, 995
- Murphy et al. (2009) Murphy E. J., Chary R.-R., Alexander D. M., Dickinson M., Magnelli B., Morrison G., Pope A., Teplitz H. I., 2009, ApJ, 698, 1380
- Nandra et al. (2007) Nandra K. et al., 2007, ApJ, 660, L11
- Nesvadba et al. (2006) Nesvadba N. P. H., Lehnert M. D., Eisenhauer F., Gilbert A., Tecza M., Abuter R., 2006, ApJ, 650, 693
- Netzer et al. (2007) Netzer H. et al., 2007, ApJ, 666, 806
- Noeske et al. (2007) Noeske K. G. et al., 2007, ApJ, 660, L43
- Page et al. (2004) Page M. J., Stevens J. A., Ivison R. J., Carrera F. J., 2004, ApJ, 611, L85
- Pannella et al. (2009a) Pannella M. et al., 2009a, ApJL, 698, L116
- Pannella et al. (2009b) Pannella M. et al., 2009b, ApJ, 701, 787
- Peng et al. (2010) Peng Y.-j. et al., 2010, ApJ, 721, 193
- Poglitsch et al. (2010) Poglitsch A. et al., 2010, A&A, 518, L2
- Pope et al. (2008) Pope A. et al., 2008, ApJ, 675, 1171
- Rupke & Veilleux (2011) Rupke D. S. N., Veilleux S., 2011, ApJL, 729, L27
- Salim et al. (2007) Salim S. et al., 2007, ApJS, 173, 267
- Salpeter (1955) Salpeter E. E., 1955, ApJ, 121, 161
- Sanders & Mirabel (1996) Sanders D. B., Mirabel I. F., 1996, ARA&A, 34, 749
- Sanders et al. (1988) Sanders D. B., Soifer B. T., Elias J. H., Madore B. F., Matthews K., Neugebauer G., Scoville N. Z., 1988, ApJ, 325, 74
- Santini et al. (2009) Santini P. et al., 2009, A&A, 504, 751
- Schawinski et al. (2007) Schawinski K., Thomas D., Sarzi M., Maraston C., Kaviraj S., Joo S.-J., Yi S. K., Silk J., 2007, MNRAS, 382, 1415
- Schawinski et al. (2011) Schawinski K., Treister E., Urry C. M., Cardamone C. N., Simmons B., Yi S. K., 2011, ApJL, 727, L31
- Shao et al. (2010) Shao L. et al., 2010, A&A, 518, L26
- Silverman et al. (2009) Silverman J. D. et al., 2009, ApJ, 696, 396
- Silverman et al. (2008) Silverman J. D. et al., 2008, ApJ, 675, 1025
- Strazzullo et al. (2010) Strazzullo V., Pannella M., Owen F. N., Bender R., Morrison G. E., Wang W.-H., Shupe D. L., 2010, ApJ, 714, 1305
- Surace et al. (1998) Surace J. A., Sanders D. B., Vacca W. D., Veilleux S., Mazzarella J. M., 1998, ApJ, 492, 116
- Tacconi et al. (2008) Tacconi L. J. et al., 2008, ApJ, 680, 246
- Teplitz et al. (2011) Teplitz H. I. et al., 2011, AJ, 141, 1
- Tueller et al. (2008) Tueller J., Mushotzky R. F., Barthelmy S., Cannizzo J. K., Gehrels N., Markwardt C. B., Skinner G. K., Winter L. M., 2008, ApJ, 681, 113
- Ueda et al. (2003) Ueda Y., Akiyama M., Ohta K., Miyaji T., 2003, ApJ, 598, 886
- Valiante et al. (2007) Valiante E., Lutz D., Sturm E., Genzel R., Tacconi L. J., Lehnert M. D., Baker A. J., 2007, ApJ, 660, 1060
- Vasudevan & Fabian (2007) Vasudevan R. V., Fabian A. C., 2007, MNRAS, 381, 1235
- Wang et al. (2010) Wang W.-H., Cowie L. L., Barger A. J., Keenan R. C., Ting H.-C., 2010, ApJS, 187, 251
- Winter et al. (2009) Winter L. M., Mushotzky R. F., Reynolds C. S., Tueller J., 2009, ApJ, 690, 1322
- Xue et al. (2010) Xue Y. Q. et al., 2010, ApJ, 720, 368
- Xue et al. (2011) Xue Y. Q. et al., 2011, ApJS, 195, 10