The Emission by Dust and Stars of Nearby Galaxies in the Herschel KINGFISH Survey
Abstract
Using new far-infrared imaging from the Herschel Space Observatory with ancillary data from ultraviolet (UV) to submillimeter (submm) wavelengths, we estimate the total emission from dust and stars of 62 nearby galaxies in the KINGFISH survey in a way that is as empirical and model-independent as possible. We collect and exploit these data in order to measure from the spectral energy distributions (SEDs) precisely how much stellar radiation is intercepted and re-radiated by dust, and how this quantity varies with galaxy properties. By including SPIRE data, we are more sensitive to emission from cold dust grains than previous analyses at shorter wavelengths, allowing for more accurate estimates of dust temperatures and masses.
The dust/stellar flux ratio, which we measure by integrating the SEDs, has a range of nearly three decades (from to ). The inclusion of SPIRE data shows that estimates based on data not reaching these far-IR wavelengths are biased low by on average. We find that the dust/stellar flux ratio varies with morphology and total infrared (IR) luminosity, with dwarf galaxies having faint luminosities, spirals having relatively high dust/stellar ratios and IR luminosities, and some early-types having low dust/stellar ratios. We also find that dust/stellar flux ratios are related to gas-phase metallicity ( and for metal-poor and intermediate-metallicity galaxies, respectively), while the dust/stellar mass ratios are less so (differing by dex); the more metal-rich galaxies span a much wider range of the flux ratios. In addition, the substantial scatter between dust/stellar flux and dust/stellar mass indicates that the former is a poor proxy of the latter. Comparing the dust/stellar flux ratios and dust temperatures, we also show that early-types tend to have slightly warmer temperatures (by up to 5 K) than spiral galaxies, which may be due to more intense interstellar radiation fields, or possibly to different dust grain compositions. Finally, we show that early-types and early-type spirals have a strong correlation between the dust/stellar flux ratio and specific star formation rate, which suggests that the relatively bright far-IR emission of some of these galaxies is due to ongoing (if limited) star formation as well as to the radiation field from older stars, which is heating the dust grains.
Subject headings:
galaxies: general - infrared: galaxies - galaxies: ISM - dust, extinction - galaxies: evolution1. Introduction
Nearly half of the bolometric luminosity of the Universe is channeled through the mid- and far-infrared (IR) emission of galaxies (e.g., Hauser & Dwek 2001). This spectral region also probes important physical properties of galaxies, such as their metal content, dust content, and cold gas content (e.g., Draine et al. 2007). To understand galaxies we must first understand the physical processes that regulate their evolution, including the formation of stars and the interstellar radiation field (ISRF), and the return of radiant energy from these stars into the interstellar medium (ISM). Herschel stands poised to make major breakthroughs in these areas, by mapping galaxies in the far-IR with unprecedented spatial resolution.
Here we perform an empirical analysis of the galaxies in the KINGFISH project (Key Insights on Nearby Galaxies: a Far-Infrared Survey with Herschel; P.I.: R. C. Kennicutt), an imaging and spectroscopic survey of 61 nearby () galaxies, chosen to cover the full range of integrated properties and local ISM environments found in the nearby Universe. KINGFISH is closely following the observing strategy of SINGS (Spitzer Infrared Nearby Galaxies Survey; Kennicutt et al. 2003), by mapping galaxies in their entirety with PACS (Photodetector Array Camera and Spectrometer; Poglitsch et al. 2010) at 70, 100, and 160m and SPIRE (Spectral and Photometric Imaging REceiver; Griffin et al. 2010) at 250, 350, and 500m.
The physical processes contributing to the energetic output of a galaxy can be probed by constructing its spectral energy distribution (SED). Most of the stellar light is emitted in the ultraviolet (UV) to near-IR domain, with the short-lived, massive stars dominating the UV and the more numerous older stars the near-IR. Dust, produced by the aggregations of metals injected into the ISM by massive stars through stellar winds and supernovae, absorbs the stellar light and re-emits it in the IR and submillimeter (submm) domains.
Our goal is to determine empirically how much starlight escapes galaxies and how much is intercepted by dust, as a function of other galaxy properties. In particular, we measure how the ratio of dust/stellar flux is correlated with properties such as morphology, metallicity, total IR luminosity, dust/stellar mass, dust temperature, and star formation rate. The KINGFISH sample is ideal for such an analysis, because these nearby galaxies have been extensively studied with a variety of telescopes and models. Many of the galaxies’ properties are already well-determined, and others are now better constrained with data from Herschel. A secondary goal is to determine which subset (if any) of galaxies observed by KINGFISH could be plausible local counterparts of galaxies dominating the extragalactic background light (EBL).
While our approach is an empirical one, there are alternative theoretical approaches as well. A variety of different models have been applied to galaxy SEDs (e.g., Fioc & Rocca-Volmerange 1997; Silva et al. 1998; Devriendt et al. 1999; see review by Walcher et al. 2011), and there has been much recent work attempting to model both the stellar and dust SEDs of galaxies, over a wide range of wavelengths (e.g., Johnson et al. 2007; da Cunha et al. 2008; Noll et al. 2009; Buat et al. 2011; Popescu et al. 2011). Some of the results of these studies can be compared to ours (see Section 4).
This paper is organized as follows. In the next section, we describe the KINGFISH sample, and how we measure the galaxies’ flux densities, from UV to submm wavelengths. We explain how we integrate the SEDs to obtain dust/stellar flux ratios in Section 3. Then in Section 4, we present our results, showing how the dust/stellar flux ratios are correlated with various galaxy properties. In Section 5, we discuss how some galaxies in the KINGFISH sample could be considered local counterparts of galaxies contributing to the EBL. We end with a summary of our results and conclusions in Section 6.
2. Data
Our sample consists of 62 nearby galaxies, of which 61 are in KINGFISH (Kennicutt, Calzetti et al. in prep.), and the other is M 33, observed by the Herschel M 33 Extended Survey (HERM33ES; Kramer et al. 2010). The sample is chosen to cover a large range of galaxy properties, such as morphological type, luminosity, metallicity, star formation rate, surface brightness, extinction, gas mass, dust content, radiation field strength, and ISM environment (see Kennicutt et al. 2003); however, the sample is not complete with respect to these properties.
2.1. Flux Densities
18 galaxies in our sample are in the Spitzer Local Volume Legacy (LVL) survey111http://www.ast.cam.ac.uk/IoA/research/lvls, and for these we use the global flux densities measured by Dale et al. (2009). 57 of the galaxies are in SINGS, and for those that are not in LVL, we use the flux densities measured by Dale et al. (2007), or when applicable, the updated values presented by Muñoz-Mateos et al. (2009b).
We obtained UV data from the Galaxy Evolution Explorer (GALEX; Martin et al. 2005; 1528 and 2271Å wavelengths); optical data from either the Sloan Digital Sky Survey (SDSS; York et al. 2000; bands) or Kitt Peak ( bands); near-IR data from the Two Micron All Sky Survey (2MASS; Skrutskie et al. 2006; bands); mid- and far-IR data from Spitzer’s Infrared Array Camera (IRAC; Fazio et al. 2004; 3.6, 4.5, 5.8, 8 m) and Multiband Imaging Photometer (MIPS; Rieke et al. 2004; 24, 70, 160 m), and 100 m from the Infrared Astronomical Satellite (IRAS; Soifer et al. 1987), when available; and submm data for one third of the galaxies from the Submillimeter Common-User Bolometric Array (SCUBA; Holland et al. 1999; 450 and 850 m).
For the two galaxies that were neither in SINGS nor LVL, IC 342 and NGC 2146, we obtained flux densities from various sources. We obtained UV magnitudes from GALEX (using the values quoted in Gil de Paz et al. 2007 for NGC 2146), and converted them to fluxes using the calibration in Morrissey et al. (2007). We obtained optical fluxes from Buta & McCall (1999) and Marcum et al. (2001), respectively. We obtained 2MASS fluxes from Jarrett et al. (2003), using the calibration in Cohen et al. (2003). We measured Spitzer fluxes from their images, and we add the IRAS 100m flux for NGC 2146. Lastly, M 33 (NGC 598) lacked optical fluxes in LVL, so we computed them from the data in Massey et al. (2006).
To these data we add Herschel far-infrared data from SPIRE (250, 350, and 500 m). We have obtained SPIRE observations of 61 KINGFISH galaxies, including six galaxies (NGC 4254, NGC 4321, NGC 4536, NGC 4569, NGC 4579, and NGC 4725) that were observed as part of the Herschel Reference Survey (HRS; Boselli et al. 2010a); and we add the SPIRE observations of M 33, from HERM33ES (Kramer et al. 2010). NGC 1404 and DDO 154 were observed by SPIRE but not detected, and their MIPS fluxes appear to be due to background sources (Dale et al. 2007), so we include these galaxies but regard their dust fluxes and masses as upper limits.
The SPIRE (as well as PACS) flux densities will be shown and described in the KINGFISH photometry paper, Dale et al. (in prep.). For details about the other flux densities, see Dale et al. (2007, 2009). The galaxy distances are listed in Table 1, and for most of the galaxies, they are the same as those in Kennicutt et al. (in prep.). For a description of the distance indicators, and references for the distance measurements, see Kennicutt et al. (2003; in prep.). Some of the KINGFISH galaxies have been examined in detail in recent papers, such as NGC 1097 (Beirão et al. 2010; Sandstrom et al. 2010), NGC 3077 (Walter et al. 2011), NGC 6946 (Murphy et al. 2011b), and NGC 1291 (Hinz et al., in prep.).
Elliptical apertures are used for the photometry and are chosen to approximately encompass all of the optical and infrared emission of a galaxy. Typically, this means that the m image was used to create the aperture, since m is the bandpass within which Spitzer is most sensitive and the stellar disk is most spatially extended, although in a few cases the far-IR m disk is more extended. The same aperture was used at all wavelengths. The global flux densities exclude foreground stars and background galaxies. We estimate that uncertainties involving the apertures may introduce up to 0.1 dex errors to the flux densities; however, these errors are quite small and do not significantly affect the dust/stellar flux ratios used for our analysis (see Section 3). For details, we refer the reader to Dale et al. (2007 and 2009, Tables 1).
Finally, for most of the KINGFISH galaxies that are also in SINGS, we measured H fluxes. For these, we used H images that were obtained as part of the SINGS ancillary program, either at the 2.1 m Kitt Peak National Observatory (KPNO) telescope or at the 1.5 m Cerro Tololo Inter-American Observatory (CTIO) telescope (Kennicutt et al. 2003). As described by Calzetti et al. (2007), exposure times were typically around 1800 s and standard reduction procedures were applied. There were 13 additional galaxies for which we did not have H fluxes but which were included in Kennicutt et al. (2008), and we used their fluxes for these galaxies, which are marked in Table 1 (with the superscript e). For the galaxies whose H fluxes we could compare, our fluxes are slightly higher than those of Kennicutt et al., by dex, on average. For NGC 598, we obtained H data from Massey et al. (2006), from which we measured a flux density of , which is slightly lower (by dex) than the value given by Kennicutt et al. For NGC 2146, which was in neither sample, we use the H flux measured by Marcum et al. (2001).
2.2. Morphological Classifications
The morphological types and metallicities of galaxies play important roles in galaxy evolution (e.g., Calura et al. 2008; Fontanot et al. 2009), and they have been found to be correlated with the dust and stellar properties of galaxies (e.g., Draine et al. 2007). Nonetheless, morphologies and metallicities are notoriously difficult to accurately determine without significant biases, and at fixed stellar mass, galaxies still have a fairly wide distribution of morphologies (e.g., Bamford et al. 2009) and metallicities (e.g., Tremonti et al. 2004). In light of this, in Section 4, we will analyze the dust/stellar flux ratios of the KINGFISH galaxies as a function of other galaxy properties, but we will mark the galaxies by their morphological types (described in this section) and metallicities (described in Section 2.3) such that trends for late-types and early-types, and metal-poor and metal-rich galaxies, can be distinguished. Even if particular galaxies are misclassified or have ill-determined metallicities, we expect the relative morphologies and metallicities within the sample to be sufficiently accurate for statistical purposes.
All but four of the KINGFISH galaxies were also in the SINGS sample (Kennicutt et al. 2003), in which galaxies were selected to span a wide range of RC3 (de Vaucouleurs et al. 1991) morphological types. Nonetheless, many more data have been accumulated about the nearby galaxies since these classifications were made, and the classifications can now be done more accurately and homogeneously.
Buta et al. (2010) have recently classified a subset of the objects in the Spitzer Survey of Stellar Structure in Galaxies (Sheth et al. 2010), using 3.6m images with good spatial resolution. 29 of these objects are in the KINGFISH sample, and for these galaxies, we use the updated morphologies. In Table 1, we note the 17 galaxies which have been classified slightly differently than previously. Some galaxies have been found to have slightly earlier types than previously; NGC 584 and NGC 855—ellipticals which now have faintly detected disks—are exceptions, as is NGC 1482, which now appears to have more of the structure of an Sa, rather than an S0. In any case, the previous RC3 classifications and Buta et al. (2010) classifications are generally consistent. In addition, examining many of the same galaxies, Kendall et al. (2011) recently found that spiral structures are usually similar in optical and IR images. We divide the KINGFISH sample into three types: there are 17 dwarf and irregular galaxies (Sd and later type), 32 spirals (Sa to Scd), and 10 early-types (E and S0).
Galactic bars may also be an important property, being related to gas concentration, star formation, and dust heating in the central regions of galaxies (Sheth et al. 2005; Engelbracht et al. 2010). Approximately half of the KINGFISH galaxies have strong bars (SAB and SB), although because of the crudeness of the bar strength classifications, it is difficult to robustly determine the bar dependence of the galaxy properties. When significant, we quote the bar dependence of the galaxies’ dust and stellar properties in the Section 4; the dependence is usually modest at most.
2.3. Gas-Phase Metallicities
In order to quantify the metallicity dependence of correlations with the dust/stellar flux ratios, we use the oxygen abundances measured by Moustakas et al. (2010). In particular, we have chosen to use the abundances based on the theoretical strong-line calibration of Kobulnicky & Kewley (2004), even though it yields overestimates for some galaxies. The empirical calibration of Pilyugin & Thuan (2005) is more accurate for typical galaxies, though it yields underestimates for star-forming metal-rich galaxies; more importantly, it was calibrated using only HII regions in spiral and irregular galaxies, and it may be dangerous to extrapolate beyond this regime. (For a discussion of the effects of using different metallicity calibrations, see e.g., Kewley & Ellison 2008; Calura et al. 2009.) We use the ‘characteristic’ (globally-averaged) metallicities of the galaxies, even for those with metallicity gradients, such as NGC 5457.
Engelbracht et al. (2005) found that there appears to be an oxygen abundance threshold at , such that galaxies below this threshold tend to have weak PAH emission; Draine et al. (2007) similarly found low PAH mass fractions in metal-poor galaxies. In order to determine how such metallicity transition may be related to the dust and stellar properties of galaxies, we use only the relative abundances of Moustakas et al. (2010), and split the KINGFISH sample into thirds, consisting of ‘metal-rich’ (i.e., highest metallicity), ‘intermediate’ metallicity, and ‘metal-poor’ (i.e., lowest metallicity) galaxies. Our results are not significantly dependent on which metallicity calibration we use; the Pilyugin & Thuan (2005) calibration yields similar relative abundances for most of the sample. For the galaxies lacking prominent emission lines, we estimate approximate metallicities based on the -band relation (Moustakas et al. 2010; cf., Tremonti et al. 2004). Note that this relation has substantial scatter for faint galaxies, and this is another motivation for focusing on the relative abundances.
The absolute metallicity scales we use to split the sample are and 9.08 (or 8.29 and 8.42 using the Pilyugin & Thuan (2005) calibration), but these absolute abundances should be treated with caution. When we refer to ‘metal-poor’ and ‘metal-rich’ galaxies, these are meant to be relative to other KINGFISH galaxies.
3. Dust/Stellar Flux Ratio
3.1. Motivation
Our goal is to estimate the emission from stars and dust in a way that is empirical and as model-independent as possible. This allows us to exploit the diversity of data that have been accumulated for these galaxies, and to compare to methods involving SED models (e.g., Draine et al. 2007; da Cunha et al. 2010). As described in detail below, we compute a dust/stellar flux ratio for each galaxy by integrating the SED from mid-IR to submm wavelengths and from UV to mid-IR wavelengths, and then taking the ratio. This is a quantity that can be physically interpreted as the amount of emission being reprocessed by dust grains (mostly small and large grains), relative to the unobscured emission from stars (especially young massive O and B stars, as well as intermediate-age AGB stars).
Galaxy SEDs, and dust/stellar flux ratios in particular, are related to other properties indicative of a galaxy’s evolution, such as metallicity and morphology (e.g., Groves et al. 2008; Fontanot et al. 2009), which were discussed in Sections 2.2 and Section 2.3. Note that the dust/stellar flux is similar, but not equivalent, to the dust/stellar mass ratio, discussed in Section 4.2. The dust/stellar flux ratio is also similar to the dust/FUV or IR/FUV ratio studied by many authors (e.g., Meurer et al. 1999; Kong et al. 2004; Johnson et al. 2007; Boquien et al. 2009; Wijesinghe et al. 2011), but these quantities specifically measure the attenuation of UV photons, while the dust/stellar flux ratio also accounts for dust absorbing optical photons from older stellar populations. A galaxy’s dust/stellar flux is related to its specific star formation rate, as we will show in Section 4.4, and its star formation history.
Lastly, note that galaxy geometry (i.e., inclination) and differential extinction will affect these ratios within galaxies to some degree (e.g., Jonsson et al. 2010). A few galaxies in the sample are highly inclined, such as NGC 4594 and NGC 4631, but as we will show in the next section, their dust/stellar flux ratios do not appear to be biased (with suppressed stellar emission). Similarly, Dale et al. (2007) examined the IR/UV luminosity ratio of SINGS galaxies and did not detect a significant trend with disk inclination.
3.2. Procedure
Our procedure is as follows. We begin by compiling the flux densities from the UV to far-infrared from Dale et al. (2007, 2009). For the -band optical SDSS data obtained for 11 of the 17 LVL galaxies in KINGFISH, and the -band data obtained for the other galaxies, we first convert the apparent magnitudes to flux densities.222For the conversion from mag to Jy, we used the following conversion for the -band magnitudes: http://ssc.spitzer.caltech.edu/tools/magtojy/ref.html; and the following for the -band magnitudes: http://www.sdss.org/dr5/algorithms/fluxcal.html. We then use the flux densities in units of Janskys, at wavelengths ranging from 0.15 to 850 m. We have measured the SPIRE fluxes at 250, 350, and 500 m ourselves, using the same apertures that had been used at shorter wavelengths. The SPIRE photometry and global flux densities will be presented in Dale et al. (in prep.).
For galaxies missing data or detections at UV or submm wavelengths, we attempt to extrapolate the SEDs, in order to more consistently compare all of the galaxies in the sample. The extrapolations may be uncertain, but they yield more accurate dust/stellar flux ratios than neglecting these regions of the SEDs. Nonetheless, the effects of these extrapolations are usually extremely small, although as noted below, the UV extrapolations of a few galaxies have an effect of . We stress that the dust/stellar flux ratios are largely determined by the stellar and IR peaks of the SEDs, which are well determined for the 62 galaxies in our fiducial sample.
For galaxies with SPIRE detections but lacking detections with SCUBA at 850 m, we perform a linear fit to the SPIRE log flux densities (at 250-500 m), and extrapolate to 850 m, and give this flux an uncertainty of 1.5 times the uncertainty of the 500 m flux. (The choice of 1.5 times the uncertainty is arbitrary; if we were to double this uncertainty, it would not significantly affect the final uncertainty estimated for the dust/stellar flux ratio.) We have verified that this is an accurate extrapolation for galaxies with both SPIRE and SCUBA detections, and in any case, it contributes a negligible effect to the dust/stellar flux ratios: the ratios are affected by dex on average and dex () at most.
The extrapolation at the UV end is slightly more important, because these wavelengths are closer to the stellar peak of the SEDs of some galaxies than 850 m is to the far-IR peak. For the galaxies only lacking GALEX detections in the FUV, we extrapolate linearly from the - and -bands (or - and -bands), and give this flux 1.5 times the uncertainty of the NUV flux density. Three galaxies lack UV data altogether, and we examined each of these individually. The turnover of NGC 3077’s SED is at longer wavelengths (nm), so we extrapolated linearly from the - and -bands for this galaxy and accordingly gave these UV fluxes larger uncertainties. We assume that NGC 1377’s SED resembles that of similar S0’s in the sample (such as NGC 1266’s in Fig. 1), which turn over steeply. Using the mean and variance of - and - colors of these galaxies, we estimated the UV end of this galaxy’s SED, and the uncertainty of the resulting dust/stellar flux ratio. Dwarf and irregular galaxies, including those in our sample, tend to have a shallower UV slope (Dale et al. 2007). Using the mean and variance of - and - of these galaxies, we estimated the UV end of NGC 5408’s SED, and the uncertainty of the resulting dust/stellar flux ratio. The extrapolations only out to the bluest point have a very small effect on the dust/stellar flux ratios. The extrapolations through both UV bands are more significant; without them, one would overestimate the dust/stellar flux ratios of NGC 3077, NGC 1377, and NGC 5408 by , , and , respectively. In any case, these factors are still relatively small on a log scale.

In order to demarcate “dust” and “stellar” emission in the SEDs, the simplest approach would be to impose a strict wavelength cut at 5 m, which is motivated by the fact that most stellar emission occurs at shorter wavelengths and dust mostly emits at longer wavelengths (e.g., Engelbracht et al. 2008). Nevertheless, a small fraction of stellar emission occurs in the mid-IR, and for some galaxies, and for early-types in particular, the emission from dust does not dominate until longer wavelengths. In addition, some galaxies have strong polycyclic aromatic hydrocarbon (PAH) features that make it difficult to determine a strict demarcation of the stellar and dust SEDs.
Motivated by this, we attempt to estimate the stellar contribution beyond 5 m, as some authors have done (e.g., Draine et al. 2007; Muñoz-Mateos et al. 2009a). For most galaxies, we fit a power-law to the stellar SED from the -band to 4.5 m, and extrapolate to estimate this extra contribution (see Figure 1). Two exceptions are NGC 1377, for which we extrapolate from -band to 3.6 m, and DDO 165, for which we extrapolate from to 8 m but exclude the 3.6 and 4.5 m fluxes, as these appear to be slightly enhanced. This is not an ideal solution, because dust contamination may occur even at 2 m (Mentuch et al. 2010), but for most of the galaxies in our sample, the Wien side of the dust SED dominates and its contribution increases with wavelength at m. The effect of accounting for the stellar contribution at these wavelengths has a very small effect on the dust/stellar flux ratios, and is significant only for the early-types (lowers their by dex, and by 0.5 dex for NGC 1404) and IC 342, but the contribution for this galaxy is very uncertain, because of its uncertain near- and mid-IR fluxes. We assume that the non-stellar contribution at m is minimal (see Meidt et al. 2011).
To estimate the stellar and dust emission, which we call and , we integrate over the SED at m and add the mid-IR stellar contribution for the former and integrate the SED at m and subtract the same contribution for the latter. The area under the SED is computed directly, using Jy and Hz as the units. In particular, for each galaxy, we first linearly interpolate over the range of wavelengths. Then we integrate over (i.e., not in log space).
| (1) |
where is the estimated stellar contribution at m, and is usually relatively small. Note that is closely related to what some call total infrared luminosity, which we discuss in Section 4.1. To estimate the uncertainties, we simply assume that the errors of the flux densities have a Gaussian distribution, sample from these distributions 10,000 times, and compute the variance around the mean dust/stellar flux ratio. Because the stellar and far-IR SED peaks are usually well determined for these galaxies, the uncertainties of are usually small, even for the few galaxies with gaps in their SEDs, such as NGC 5408.
3.3. Resulting Dust/Stellar Flux Ratios
Two example SEDs are shown in Figure 1. NGC 1266 and NGC 1316 are both S0s, and as we shall show later, they have similar masses. Nevertheless, they have very different dust/stellar flux ratios. In addition, they are among the galaxies that, before Herschel, did not have any far-IR data beyond m.
The distribution of dust/stellar emission for our fiducial sample of 62 galaxies is shown in Figure 2.

For comparison, we also show the distribution without the SPIRE data (and without the m extrapolation). In other words, we compare to the distribution one would have obtained before Herschel, where the only far-IR data were from MIPS (and IRAS and SCUBA, for a few galaxies).
For some galaxies, especially those with SEDs peaking at long wavelengths, Herschel contributes stronger constraints on the ratio of dust/stellar emission, by tracing additional cold dust components not detected by Spitzer. Consequently, by adding a contribution in the far-IR, the SPIRE fluxes slightly increase the dust/stellar flux ratio of some galaxies in the sample. The mean ratio is without SPIRE and with SPIRE, an increase of about 17.333The mean ratios, without using logarithms, are without SPIRE and with SPIRE, an increase of . Since spans three orders of magnitude, however, we use the logs of the ratios throughout this paper. (Note that the standard deviations about these means are dex.) NGC 1512 is the galaxy for which the inclusion of SPIRE data has the largest effect, increasing its dust/stellar flux ratio by 0.23 dex. The mean ratio varies with morphology as well, as shown in Table 2 and discussed in Section 4.
The three galaxies with the largest dust/stellar flux ratios are NGC 1482, NGC 2146, and NGC 2798, which are all starbursting early-type spirals. NGC 1482 also has evidence of superwind outflows (Hota & Saikia 2005), while NGC 2146 and NGC 2798 have peculiar morphologies, possibly indicative of interactions or mergers (but see Greve et al. 2006 on NGC 2146). The two galaxies with the smallest ratios are NGC 1404 and NGC 584, which are both massive ellipticals (or E/S0) with very little FIR emission; NGC 1404 is also experiencing ram-pressure stripping as it falls through the Fornax cluster (Machacek et al. 2005). NGC 1404’s () should be considered an upper limit, because its FIR and submm fluxes appear to be due to a background source (Dale et al., in prep.), and it is an indication of the most stellar-dominated a galaxy’s SED can be.
In Table 1, we show the dust/stellar flux ratios of the KINGFISH galaxies. The near-IR morphologies, TIR luminosities, dust masses, stellar masses, and star formation rates are also listed in the table, and are discussed below.
| Galaxy | Type | Dist. | log | log | log | log SFRFUV+TIR | log SFRHα+24μm | ||
|---|---|---|---|---|---|---|---|---|---|
| (Mpc) | (log erg ) | (K) | (log ) | (log ) | (log ) | (log ) | |||
| NGC 0337 | SABcdpa | 22.9 | 0.77 0.01 | 43.84 0.04 | 28.1 0.7 | 7.07 0.08 | 9.47 0.22 | 0.29 0.04 | 0.24 0.05 |
| NGC 0584 | SAB0 | 20.8 | 0.009 0.001 | 42.60 0.06 | 24.5 0.6 | 5.58 0.15 | 11.12 0.07 | -1.01 0.05 | |
| NGC 0628 | SAc | 7.3 | 0.50 0.01 | 43.50 0.05 | 24.0 0.6 | 7.03 0.08 | 9.57 0.13 | 0.04 0.05 | -0.01 0.05 |
| NGC 0855 | SA0 | 9.73 | 0.26 0.001 | 42.21 0.04 | 28.5 0.9 | 5.49 0.08 | 8.67 0.10 | -1.32 0.04 | -1.34 0.05e |
| NGC 0925 | SABd | 9.04 | 0.36 0.01 | 43.25 0.04 | 23.7 0.5 | 6.98 0.08 | 9.48 0.14 | -0.11 0.05 | -0.22 0.05 |
| NGC 1097 | SBabp | 19.09 | 0.65 0.01 | 44.52 0.04 | 26.2 0.6 | 7.80 0.08 | 10.74 0.12 | 0.91 0.03 | 0.94 0.05 |
| NGC 1266 | SB0 | 30.6 | 1.86 0.04 | 44.00 0.03 | 36.0 1.0 | 6.66 0.08 | 10.14 0.12 | 0.31 0.03 | 0.36 0.05 |
| NGC 1291 | SAB0 | 10.4 | 0.043 0.001 | 43.12 0.06 | 22.4 0.5 | 6.76 0.08 | 10.79 0.10 | -0.45 0.04 | -0.07 0.05 |
| NGC 1316 | SAB0 | 20.1 | 0.024 0.001 | 43.55 0.04 | 26.8 0.7 | 6.79 0.08 | 11.42 0.09 | -0.07 0.04 | -0.42 0.07 |
| NGC 1377 | S0 | 24.6 | 1.69 0.02 | 43.74 0.02 | 43.5 1.8 | 5.78 0.09 | 9.28 0.14 | 0.05 0.04d | 0.45 0.06 |
| NGC 1404 | E | 19.5 | 0.006 | 42.58 0.05 | 6.5 1.6b | 10.85 0.13 | -0.94 0.05 | -0.60 0.05 | |
| NGC 1482 | Saa | 22.6 | 3.37 0.07 | 44.29 0.03 | 31.8 0.9 | 7.13 0.08 | 9.99 0.11 | 0.60 0.03 | 0.71 0.08 |
| NGC 1512 | SBaa | 14.35 | 0.28 0.01 | 43.35 0.05 | 20.9 0.8 | 7.00 0.08 | 10.10 0.11 | -0.09 0.05 | 0.23 0.05 |
| Ho II | Im | 3.6 | 0.09 0.001 | 41.63 0.04 | 36.5 1.1 | 4.05 0.20 | 7.73 0.15 | -1.14 0.06 | -1.17 0.06 |
| DDO 053 | Im | 3.6 | 0.27 0.01 | 40.71 0.05 | 30.5 0.9 | 4.01 0.10 | 6.35 0.20 | -2.34 0.06 | |
| NGC 2798 | SABap | 25.8 | 2.54 0.04 | 44.18 0.03 | 34.9 1.1 | 6.83 0.08 | 10.04 0.13 | 0.50 0.03 | 0.75 0.05 |
| NGC 2841 | SABaa | 14.1 | 0.15 0.002 | 43.72 0.05 | 22.1 0.4 | 7.34 0.08 | 10.17 0.14 | 0.12 0.04 | |
| NGC 2915 | I0 | 3.78 | 0.10 0.001 | 41.27 0.04 | 28.9 0.9 | 4.59 0.08 | 7.57 0.20 | -1.57 0.06 | -1.75 0.06e |
| Ho I | IABm | 3.6 | 0.11 0.001 | 40.79 0.07 | 26.2 0.9 | 4.54 0.08 | 6.80 0.22 | -2.08 0.06 | |
| NGC 2976 | SABda | 3.6 | 0.47 0.01 | 42.54 0.05 | 25.9 0.7 | 5.97 0.08 | 8.97 0.11c | -1.00 0.04 | -0.97 0.05 |
| NGC 3049 | SBab | 19.2 | 0.63 0.01 | 43.16 0.03 | 27.5 0.7 | 6.45 0.08 | 8.58 0.04 | -0.47 0.04d | -0.27 0.06 |
| NGC 3077 | I0p | 3.6 | 0.30 0.001 | 42.46 0.04 | 30.1 0.9 | 5.52 0.08 | 9.29 0.07c | -1.21 0.05d | -1.23 0.05e |
| M81 dwB | Im | 3.6 | 0.17 0.01 | 40.40 0.14 | 25.0 0.7 | 4.06 0.09 | 6.36 0.20 | -2.82 0.06 | |
| NGC 3190 | SAap | 19.3 | 0.19 0.002 | 43.49 0.04 | 25.2 0.5 | 6.89 0.08 | 10.03 0.14 | -0.20 0.04 | -0.45 0.05 |
| NGC 3184 | SAbca | 8.7 | 0.32 0.01 | 43.40 0.05 | 23.4 0.5 | 6.90 0.08 | 9.24 0.17 | -0.08 0.04 | -0.25 0.05 |
| NGC 3198 | SABbca | 14.5 | 0.43 0.01 | 43.60 0.05 | 23.6 0.5 | 7.18 0.08 | 9.85 0.11 | 0.12 0.04 | -0.03 0.05 |
| IC 2574 | IBma | 3.6 | 0.18 0.001 | 41.91 0.04 | 25.9 0.6 | 5.57 0.08 | 8.16 0.20 | -1.11 0.06 | -1.72 0.05 |
| NGC 3265 | E | 19.6 | 0.97 0.02 | 43.05 0.03 | 31.8 0.9 | 6.00 0.08 | 8.70 0.12 | -0.60 0.03 | -0.53 0.05 |
| NGC 3351 | SBaa | 9.8 | 0.36 0.01 | 43.51 0.05 | 25.6 0.6 | 6.87 0.08 | 10.28 0.12c | -0.07 0.04 | -0.49 0.09e |
| NGC 3521 | SABbc | 12.44 | 0.53 0.02 | 44.24 0.05 | 24.9 0.6 | 7.63 0.08 | 10.78 0.12c | 0.59 0.04 | 0.59 0.05 |
| NGC 3621 | SAd | 6.9 | 0.54 0.01 | 43.57 0.04 | 25.4 0.6 | 6.97 0.08 | 9.43 0.11 | 0.06 0.04 | -0.03 0.05e |
| NGC 3627 | SBbp | 10.3 | 0.60 0.02 | 44.15 0.04 | 27.2 0.7 | 7.32 0.08 | 10.57 0.13c | 0.50 0.04 | 0.49 0.05 |
| NGC 3773 | SA0 | 12.4 | 0.46 0.01 | 42.44 0.04 | 30.2 0.8 | 5.44 0.08 | 8.31 0.16 | -0.91 0.05 | -0.89 0.05 |
| NGC 3938 | SAc | 12.1 | 0.45 0.01 | 43.57 0.04 | 24.8 0.5 | 6.94 0.08 | 9.12 0.04 | -0.05 0.05d | -0.05 0.05 |
| NGC 4236 | SBdm | 3.6 | 0.14 0.001 | 42.09 0.05 | 25.0 0.7 | 5.83 0.08 | 8.18 0.13 | -0.93 0.06 | -0.97 0.05e |
| NGC 4254 | SAcp | 15.3 | 0.81 0.01 | 44.29 0.04 | 25.5 0.5 | 7.56 0.08 | 9.61 0.15 | 0.63 0.05d | 0.72 0.05 |
| NGC 4321 | SABbc | 15.3 | 0.59 0.01 | 44.22 0.04 | 24.4 0.5 | 7.61 0.08 | 10.36 0.11 | 0.58 0.05d | 0.45 0.05 |
| NGC 4536 | SABbc | 15.3 | 0.77 0.02 | 44.00 0.03 | 26.9 0.6 | 7.28 0.08 | 9.49 0.11 | 0.39 0.03 | 0.39 0.05 |
| NGC 4559 | SBcd | 8.45 | 0.34 0.01 | 43.28 0.04 | 24.5 0.5 | 6.83 0.08 | 8.93 0.20 | -0.11 0.04 | |
| NGC 4569 | SABab | 15.3 | 0.20 0.002 | 43.72 0.04 | 24.0 0.5 | 7.16 0.08 | 10.38 0.12 | 0.09 0.04 | |
| NGC 4579 | SBaa | 15.3 | 0.15 0.01 | 43.64 0.05 | 23.4 0.5 | 7.12 0.08 | 9.96 0.23 | 0.01 0.04 | -0.16 0.05 |
| NGC 4594 | SAa | 9.4 | 0.035 0.001 | 43.26 0.05 | 22.1 0.4 | 6.91 0.08 | 11.06 0.12 | -0.38 0.04 | -0.55 0.05 |
| NGC 4625 | SABm | 9.3 | 0.37 0.01 | 42.40 0.05 | 24.8 0.6 | 5.89 0.08 | 8.72 0.14c | -0.97 0.05 | -1.31 0.07e |
| NGC 4631 | SBd | 7.62 | 1.11 0.01 | 44.00 0.05 | 27.7 0.8 | 7.26 0.08 | 9.76 0.14c | 0.43 0.04 | 0.37 0.05 |
| NGC 4725 | SABaa | 12.7 | 0.16 0.01 | 43.61 0.04 | 21.1 0.4 | 7.34 0.08 | 10.58 0.12 | 0.07 0.03 | -0.09 0.04 |
| NGC 4736 | SABaa | 4.66 | 0.25 0.002 | 43.41 0.04 | 29.3 0.8 | 6.52 0.08 | 10.34 0.13c | -0.16 0.04 | -0.66 0.07e |
| DDO 154 | IBm | 4.3 | 0.055 | 40.43 0.13 | 4.8 0.6b | 6.63 0.20 | -2.04 0.06 | -2.74 0.14 | |
| NGC 4826 | SAab | 5.57 | 0.18 0.001 | 43.31 0.04 | 29.1 0.8 | 6.38 0.08 | 9.99 0.12 | -0.34 0.04 | -0.73 0.05 |
| DDO 165 | Im | 3.6 | 0.043 0.001 | 40.40 0.20 | 23.5 1.1 | 4.19 0.10 | 6.83 0.40 | -2.03 0.07 | -2.61 0.07 |
| NGC 5055 | SAbca | 10.16 | 0.47 0.01 | 44.14 0.06 | 24.1 0.5 | 7.61 0.08 | 10.76 0.12c | 0.52 0.04 | 0.34 0.08e |
| NGC 5398 | SBdm | 8.33 | 0.30 0.002 | 42.25 0.04 | 27.3 0.7 | 5.59 0.08 | 7.86 0.10 | -1.05 0.05 | -1.07 0.05 |
| NGC 5408 | IBm | 4.8 | 0.20 0.02 | 41.88 0.03 | 25.7 1.1 | 4.68 0.08 | 8.29 0.15 | -1.29 0.19d | -1.04 0.03e |
| NGC 5457 | Sc | 7.1 | 0.49 0.01 | 44.01 0.05 | 24.3 0.6 | 7.52 0.08 | 10.03 0.06c | 0.60 0.05 | 0.27 0.14e |
| NGC 5474 | SAcd | 6.8 | 0.20 0.002 | 42.33 0.06 | 24.6 0.6 | 6.00 0.08 | 8.70 0.11c | -0.79 0.06 | -0.96 0.07 |
| NGC 5713 | SBabpa | 21.37 | 1.31 0.01 | 44.14 0.03 | 30.0 0.8 | 7.07 0.08 | 10.07 0.11 | 0.48 0.03 | 0.46 0.05 |
| NGC 5866 | S0 | 15.3 | 0.11 0.001 | 43.38 0.04 | 27.9 0.7 | 6.57 0.08 | 10.02 0.09 | -0.30 0.04 | |
| NGC 6946 | SABcd | 6.8 | 0.60 0.001 | 44.17 0.04 | 26.0 0.6 | 7.47 0.08 | 9.96 0.40 | 0.60 0.04 | 0.11 0.04e |
| NGC 7331 | SAb | 14.9 | 0.59 0.001 | 44.37 0.04 | 26.1 0.6 | 7.71 0.08 | 10.58 0.12 | 0.71 0.04 | 0.60 0.05 |
| NGC 7793 | SAca | 3.91 | 0.39 0.002 | 42.91 0.06 | 24.1 0.6 | 6.51 0.08 | 9.00 0.16 | -0.44 0.05 | -0.62 0.05 |
| IC 342 | SABcd | 3.28 | 1.5 0.2 | 43.95 0.03 | 24.1 0.6 | 7.27 0.05 | 9.95 0.20 | 0.26 0.03 | -0.99 0.05e |
| NGC 2146 | SBabp | 17.2 | 3.01 0.001 | 44.71 0.03 | 37.4 1.2 | 7.36 0.08 | 10.30 0.13 | 1.02 0.03 | 0.97 0.03f |
| NGC 0598 | SAcd | 0.84 | 0.38 0.002 | 42.92 0.05 | 23.0 0.7 | 6.68 0.05 | 8.86 0.10 | -0.77 0.05 | -0.80 0.10 |
-
The columns are: galaxy name; morphological type, from Kennicutt et al. (2003); redshift-independent distance (see Kennicutt et al., in prep.); dust/stellar flux ratio (Eqn. 1); TIR luminosity, using Draine & Li (2007) calibration; dust temperature, estimated from modified blackbody fit to far-IR SED; dust mass, converted from dust temperatures using Li & Draine (2001) 500m mass absorption coefficient; stellar mass, using Zibetti et al. (2009) calibration; star formation rate (SFR), from FUV and TIR luminosities, and from H and 24 m luminosities. The mass and SFR errors are underestimates: they include only formal errors from the fluxes, not systematic errors. a Morphology obtained from Buta et al. (2010), and was different than that listed in Kennicutt et al. (2003). b estimated from MIPS fluxes only, without longer wavelength fluxes. c Stellar mass-to-light ratios estimated from and colors; the others are estimated from and colors (see Zibetti et al. 2009). d Far-UV flux extrapolated from longer wavelengths. e flux obtained from Kennicutt et al. (2008). f flux obtained from Marcum et al. (2001).
4. Results: Correlations with Galaxy Properties
4.1. Total Infrared Luminosity
4.1.1 Estimating
We begin by analyzing the total infrared (TIR) luminosity of the galaxies in our sample. The TIR luminosity is a useful quantity because it can be directly inferred from the IR fluxes, and because it can be used as a proxy for the obscured star formation as well as the temperature of dust grains (e.g., Dale & Helou 2002, Draine & Li 2007). We follow Draine & Li (2007), and use the 8, 24, 70, 160m data from IRAC and MIPS to estimate the TIR luminosity:
| (2) |
We have also tested the Dale & Helou (2002) formula, which uses only the MIPS bands, and have obtained very similar results. (We have chosen not to include the SPIRE bands in Eqn. 2, because a calibration of with these bands has not yet been developed and tested.)
Estimates of are designed to encompass all of the emission from PAH particles, very small grains, and large grains, the proportions of which depend on the starlight density distribution and the relative abundances of the grain populations (Draine & Li 2007; Compiégne et al. 2011). Therefore, it is useful to compare and the dust/stellar flux ratio, in order to analyze the emission from dust grains vis-á-vis stellar emission.
4.1.2 Results
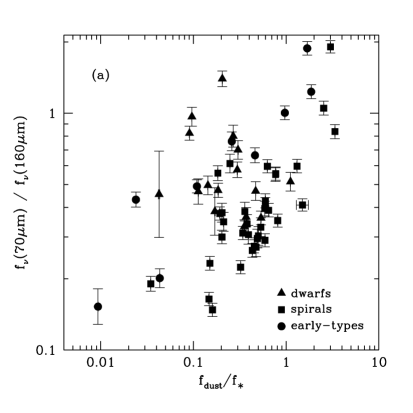
The correlation between and the dust/stellar flux ratio of the KINGFISH galaxies is shown in Figure 3. As mentioned in Section 3, the total IR luminosity is very closely related to the quantity . Plotting versus yields a result very similar to that shown in the figure.
In Figure 3a, the galaxies are also labeled by their morphologies, such that we distinguish galaxies that are classified as E and S0, Sa to Scd, and Sd and later-type. The spiral galaxies NGC 2146 and NGC 1097 have the largest TIR luminosities, while the dwarf galaxies DDO 154, DDO 165, and M81 Dwarf B have the faintest luminosities. The late-type spiral galaxies NGC 598 and NGC 7793 have almost exactly the same and ; as noted by Smith et al. (1984), these galaxies have similar photometric and kinematic properties, but different spiral arm structures.
Many of the spirals tend to be found in the locus of just below unity and in the figure. Most of the galaxies with small dust/stellar flux ratios and large TIR luminosities are early-types, although this may be partly due to a selection effect, as these galaxies were selected to be detectable in the IR (Kennicutt et al. 2003). In contrast, those with small and small are dwarfs and irregulars. Here and in terms of other galaxy properties, some of the earlier-type spirals follow the trends of the E and S0 galaxies, while others have properties more similar to other spiral galaxies. The trend in Figure 3 is more complicated than a simple morphological distinction, however, as some early-types have relatively large dust/stellar flux ratios (); as we will show later, these galaxies also tend to have larger specific star formation rates and dust temperatures.


Note that Dale et al. (2009) have a somewhat similar plot (their Fig. 3), in which is plotted on the horizontal axis, rather than the dust/stellar flux ratio. Their sample is obtained from the LVL survey, which was designed to be nearly volume-limited. As a result, it is dominated by faint dwarf galaxies, and some of these fill part of the parameter space in the lower right of the figure, with low and slightly higher dust/stellar flux ratios than the dwarf galaxies in KINGFISH. In comparison, KINGFISH is incomplete and has relatively few dwarf galaxies, so the survey mostly covers the high-TIR part of the parameter space. Lastly, Soifer et al. (1989) also performed a similar analysis, plotting infrared/visible flux versus FIR luminosity for a sample of IR-bright galaxies in IRAS. They obtained a single trend albeit with significant dispersion, but most of the dwarf galaxies in KINGFISH would likely not have met their selection criteria.
We summarize the morphology dependence of TIR luminosity and other galaxy properties analyzed in this section in Table 2, which lists the means and standard deviations of these properties as a function of Hubble type. These could be useful as a local benchmark for comparisons with high-redshift studies, such as studies of submillimeter galaxies (e.g., Santini et al. 2010).
| (log erg ) | (K) | (log ) | (log ) | |||
|---|---|---|---|---|---|---|
| All Galaxies | ||||||
| Dwarfs | ||||||
| Spirals | ||||||
| Early-types |
-
KINGFISH galaxy properties: meanbootstrap errorstandard deviation. There are 17 dwarf and irregular galaxies (Sd and later), 35 spirals (Sa to Scd), and 10 early-types (E and S0). , , , , and are discussed in Sections 3, 4.2, 4.1, 4.3, and 4.4, respectively. refers to specific star formation rate, ; the quantities in these two columns include galaxies with fluxes from Kennicutt et al. (2008) and galaxies with extrapolated FUV fluxes (see Section 3).
As mentioned above, approximately half of the KINGFISH galaxies have strong bars, and it is possible that the presence of a bar affects emission by dust and stars in the central region of a galaxy. We find that the mean of the log dust/stellar flux ratio is for weakly barred galaxies (no bar or SA) and for strongly barred galaxies (SAB or SB). On the other hand, for the total infrared luminosity, the means are and for weakly and strongly barred galaxies, respectively. This is consistent with the observation that most IR-selected starburst galaxies are barred (e.g., Hunt & Malkan 1999). Nevertheless, the bar fraction has also been observed to be higher among galaxies with higher optical luminosities, because these galaxies became dynamically cool and sufficiently massive to host bars earlier than fainter galaxies (Sheth et al. 2008). Thus one might expect barred galaxies to have brighter stellar and infrared luminosities than weakly barred ones. Our data in fact bear this out: the mean stellar and dust luminosities, which we quantify as and , are both higher in barred galaxies by dex, the same factor as . Therefore, it is simply the case that strongly barred galaxies in KINGFISH are more luminous than weakly barred ones, and this effect cancels in the dust/stellar flux ratios.
In Figure 3b, we show the metallicity dependence of the relation between the TIR luminosity and dust/stellar flux ratio. Firstly, it can be seen that the metallicity dependence and morphology dependence are similar: dwarf galaxies tend to be relatively metal-poor, spiral galaxies tend to have intermediate metallicities, and early-type galaxies tend to be metal-rich. Nonetheless, it is not a one-to-one relationship: some early-type spirals with large are also metal-rich (such as NGC 1097), while some intermediate-metallicity galaxies are early-types with relatively large (such as NGC 855).
In general, from the morphological and metallicity dependence of and , we can tentatively infer an evolutionary sequence from the figure, such that as a typical late-type galaxy grows and becomes more luminous, it becomes more metal enriched and has a larger dust fraction; this is also accompanied by more emission by stars, a larger metallicity, and a growing stellar mass (either by star formation or a merger), as the galaxy becomes an early-type. For the early-types, either stellar mass growth outweighs dust production, because the dense molecular clouds in which dust is typically accreted have dissolved, or a substantial amount of dust grains are ejected or destroyed, such as by supernovae shockwaves and thermal ‘sputtering’ (e.g., Draine & Salpeter 1979; Dwek 1998; Pipino et al. 2011). This interpretation of Figure 3 is merely speculative, however, and assumes that typical present-day late-types resemble past stages of present-day early-types; that is, it assumes that the growth of galaxy disks precedes that of bulges (e.g., Bournaud et al. 2009; Ceverino et al. 2010), although there is evidence that this assumption may be too simplistic (e.g., MacArthur et al. 2009; Bundy et al. 2010).
In contrast, the dwarf and irregular galaxies have lower TIR luminosities (most have ) and relatively little emission from dust (usually ). They appear to be a distinctly different galaxy population, exhibiting different properties than typical late-type spirals and inhabiting different environments (e.g., Leroy et al. 2008; Gavazzi et al. 2010).
In any case, although general trends are apparent in Figure 3, there are plenty of exceptions and variation within the KINGFISH sample. Note that the sample was selected not to have strong AGN, defined as an AGN that dominates substantial portions of a galaxy’s spectrum, so it is unlikely that AGN contribute much to this variation.
4.2. Dust and Stellar Mass
Next, in order to add to this picture of galaxy evolution, we can use the infrared SEDs of the galaxies in our sample to estimate dust and stellar masses. These are more physical quantities than fluxes, but they require some model assumptions, and hence have additional systematic uncertainties.
4.2.1 Estimating and
We estimate dust masses using dust temperatures, which are determined from simple fits to the FIR SED (e.g., Hildebrand 1983). We use the MIPS and SPIRE FIR and submm (m) flux densities and perform fits using a single temperature blackbody modified by an emissivity law proportional to . Our approach is similar to that of Engelbracht et al. (2010) and Gordon et al. (2010), who also applied this method to galaxies with MIPS and SPIRE data. The use of a single temperature fit for whole galaxies essentially yields an average dust temperature; in practice, most galaxies have multiple dust components at different temperatures, such as in photo-dissociation regions and in the diffuse ISM, although one component might dominate. We assume , which is consistent with recent observational constraints at far-IR and submm wavelengths (e.g., Dunne & Eales 2001; Paradis et al. 2009; Gordon et al. 2010). In any case, the resulting dust temperatures are slightly dependent upon the assumed emissivity, and it is in a systematic way, such that would yield slightly lower temperatures by a few degrees for the whole sample (e.g., Bendo et al. 2003). We also do not attempt to account for the ‘submm excess’ inferred by some authors which may be due to a very cold dust component or to a wavelength dependent emissivity law (e.g., Galametz et al. 2009; Gordon et al. 2010). We infer the uncertainties of the temperatures with a Monte Carlo analysis that includes the flux errors.
Most of the resulting temperatures range from K, with NGC 1512 having the coldest temperature (K), and NGC 1377 and NGC 2146 having exceptionally warm ones (K and K, respectively). NGC 1404 yields an extremely cold temperature, but its FIR and submm flux densities are very small, and the 70 and 160 m fluxes quoted in Dale et al. (2007) appear to be due to a background source, so we discard the galaxy’s temperature as unrealistically low. For most other galaxies, a modified blackbody provides a good fit to the FIR SED. The temperatures and uncertainties are listed in Table 1.
Given of a galaxy, we estimate the dust mass with the following:
| (3) |
where is the flux density, is the distance from the galaxy, is the Planck function, which is in the Rayleigh-Jeans limit (and the additional factor is due to integrating over steradians).
is the mass absorption coefficient, which we take from Draine (2003). The Draine (2003) model assumes that the dust consists of a mixture of carbonaceous grains and amorphous silicate grains, with dust grain size distributions consistent with the wavelength-dependent extinction in the local Milky Way, with (Weingartner & Draine 2001). This model also assumes that most of the dust is heated by the diffuse radiation field, while the rest is heated by luminous stars with intense starlight.
We compute the masses at m, in order to minimize the dependence on the temperature, although the uncertainties of the flux densities are larger than at shorter wavelengths. At m, the mass absorption coefficient is (which is lower than the value quoted in Li & Draine (2001)). Importantly, note that the absorption coefficients in these models have approximately , while many of the galaxies have an emissivity closer to , which entails a wavelength dependence of the estimated dust masses. Masses estimated at m and m are lower by dex and 0.25 dex, respectively.
For the galaxies lacking SPIRE fluxes, NGC 1404 and DDO 154, we estimate dust masses using the procedure outlined in Draine & Li (2007, Section 9.5), using the galaxies’ fluxes at 8, 24, 70, and 160 m. The Draine & Li (2007) model is an updated version of the one developed by Li & Draine (2001). These dust masses are less reliable than the ones estimated from dust temperatures because the submm SEDs are less strongly constrained. The quoted errors of all of the dust masses consist only of the formal errors, and do not include systematic uncertainties.
The dust masses of the KINGFISH galaxies fall between . The dwarf and irregular galaxies have the lowest masses, while early-type spirals such as NGC 1097 and NGC 7331 have the highest masses. Consistent with Masters et al. (2010a), luminous disk-dominated spirals such as NGC 4254, NGC 5457, and NGC 6946 have relatively large dust masses (). The dust masses and uncertainties are listed in Table 1.
Dust mass is strongly correlated with total infrared luminosity, which we analyzed in the previous section. The distribution of the dust/stellar flux ratio as a function of dust mass is qualitatively similar to Figure 3, but with larger uncertainties.
Fifteen of our galaxies are included in the subsample of Draine et al. (2007) of galaxies that have SCUBA data. We have compared our dust masses to theirs, and our masses are systematically lower by 0.2-0.4 dex. Some of their distances are shorter, and since distance appears in quadrature in Eqn. 3, accounting for this makes the discrepancy slightly larger. The discrepancy may be partly due to our single-temperature fit including the 70 m flux, which may have a contribution of small dust grains stochastically heated by starlight (Draine & Li 2007); galaxies with slightly larger temperature estimates would then have slightly smaller masses. The wavelength dependence of dust emissivity, mentioned above (and see Paradis et al. 2009), could also be an important factor. Two galaxies with large discrepancies are NGC 5713, for which Draine et al. (2007) obtained a mass nearly 0.9 dex larger and for which a LMC dust model was favored, and NGC 4631, for which they obtained a mass 0.8 dex larger although the result depends on the allowed range of starlight intensity. Our dust mass for NGC 3077 is slightly larger than that estimated by Walter et al. (2011), which we believe is mostly due to their smaller aperture size. A detailed analysis of the dust masses and other dust properties of KINGFISH galaxies will be presented in Dale et al. (in prep.) and Aniano et al. (in prep.).


4.2.2 Estimating
We estimate the stellar masses from Zibetti et al. (2009), using optical and near-IR colors with -band luminosity. In particular, they combine stellar population synthesis (SPS) models with simple prescriptions for dust attenuation. They use an updated version of the Bruzual & Charlot (2003) SPS models, which include revised prescriptions for the thermally pulsing asymptotic giant branch (TP-AGB) evolutionary phase, with a two component star formation history, consisting of a continuous, exponentially declining mode with random bursts superimposed. The Zibetti et al. (2009) model outputs stellar mass-to-light ratios , and for the LVL galaxies, which have -band SDSS data, we use . In other words, the stellar masses are calculated with the following:
| (4) |
where is the optical color ( or ) and is the optical-NIR color ( or ). As a function of two colors, the model’s mass-to-light ratios typically have 0.1-0.2 dex scatter. Before computing the masses, we have corrected the colors for foreground Galactic extinction, using values taken from Schlegel et al. (1998). We assume a universal Kroupa (2001) initial mass function (IMF). The assumed IMF affects the inferred masses and SFRs systematically (e.g., for a Salpeter IMF, they would be higher by a factor of 1.8 (Borch et al. 2006) and 1.5 (Calzetti et al. 2010), respectively), while the relative distributions are robust.
Most of the resulting stellar masses are in the range . The S0 galaxy NGC 1316, whose SED is shown in Figure 1, has the largest stellar mass. Like the dust masses, the irregular galaxies have the lowest stellar masses; however, NGC 3077 is an exception: it is a relatively massive dwarf galaxy in the M81 group, whose starburst activity may have been triggered by interactions with its neighbors (Walter et al. 2002). Note that other models (e.g., Bell et al. 2003; Sani et al. 2011) yield relatively similar but not identical stellar masses for these galaxies; we refer the reader to Zibetti et al. (2009) for a comparison with and discussion of other models.
4.2.3 Results
First, we show in Figure 4 the dust mass and stellar mass as a function of the dust/stellar flux ratio. The two figures are similar, because the galaxies in this sample have such strongly correlated dust and stellar masses (unlike high-redshift submm galaxies, for example, which have a more scattered correlation; Santini et al. 2010).
The galaxies are marked by their morphology classes in Figure 4. Four early-types (NGC 1404, NGC 584, NGC 1316, NGC 1291) and an earlier-type spiral (NGC 4594) are outliers, with low and large dust and stellar masses. It is also interesting that is correlated with the dust and stellar masses for the dwarf/irregular and late-type spiral galaxies, with Spearman rank correlation coefficients444The Spearman rank correlation coefficient may have a value between and 1. A positive (negative) value indicates an (anti)correlation, and a value of 0 indicates no correlation. of and (which implies approximately 95% significance), respectively. Most dwarf galaxies lack substantial dust emission (e.g., Walter et al. 2007), but the few of them with (mostly Sd galaxies and NGC 3077) have relatively large dust and stellar masses.
In both figures, but especially in the plot showing the stellar mass dependence, (Fig. 4b), there appears to be a transition between two populations of galaxies. In particular, there appears to be a “transition” stellar mass at , such that less massive galaxies follow a steep relation with dust/stellar flux, while more massive galaxies occur on a flat or slightly negative relation. We will later show that a similar transition appears to occur between specific star formation rate and dust/stellar flux (see especially Fig. 7b in Section 4.4). This mass scale of is similar to the transition stellar mass determined by Kauffmann et al. (2003; see also Schiminovich et al. 2007), above which galaxies have high stellar mass surface densities, high concentration indices typical of bulges, old stellar populations, and low SFRs and gas masses. Intriguingly, the maximum occurs in the transition region, and perhaps NGC 1482 is a candidate for a transition galaxy in this context; however, note that some other galaxies in this region are peculiar, and in some cases are interacting with a neighbor. In any case, it is interesting that the transition in occurs at a similar stellar mass as the previously observed transition in (4000-Åbreak strength, quantifying the star formation history), (stellar mass surface density), and specific SFR.
Next, we compare the ratio of dust/stellar mass to the dust/stellar flux ratios in Figure 5. Note that the distribution is different than that of : the distribution is centrally peaked with small and large outliers (see Figure 2), while the majority of the ratios are between and , with the aforementioned early-types and NGC 4594 having lower values. NGC 584 in particular has a stellar mass that is more than five orders of magnitude larger than its dust mass.
As stated in Table 2, the mean log dust/stellar mass ratio is for the sample, which is smaller than the low-redshift value given by Dunne et al. (2011), but the results appear to be consistent given the different sample selections. Dunne et al. find that the dust/stellar mass ratio depends on metal enrichment, which we also discuss below, and increases with increasing redshift (see also Bussmann et al. 2009).
For the general galaxy population in KINGFISH, there is only a weak correlation between and (Spearman rank , less than 95% significance), with substantial scatter. Some of the scatter is likely due to systematic uncertainties in the dust and stellar masses, as well as to the errors of the m flux densities, which were used to estimate . Spiral and dwarf galaxies appear to populate the same locus on the plot. DDO 154 and DDO 165, both dwarf galaxies, are exceptions, with particularly small stellar masses. Three Sa galaxies—NGC 4594 in the lower left of the plot and NGC 1482 and NGC 2798 at the high end—are also outside of the central locus of the plot, and appear to follow the trend of early-type galaxies.
More clearly than the rest of the sample, the early-types exhibit a strong correlation between the dust/stellar ratios (Spearman rank , significance). An interesting question to ask is why the early-types have such a large range of dust/stellar flux and mass ratios, spanning three orders of magnitude. One possibility is that these galaxies have a wide range of radiation field intensities and star formation rates (see Section 4.4), as well as widely varying gas/stellar ratios (Young et al. 2009).


In particular, all but two of the early-types are lenticular galaxies, and many of them have similar masses and TIR luminosities. If we look at one pair of S0s, NGC 1316 and NGC 1291 have extremely low dust/stellar ratios, and appear to be similar to the elliptical galaxies (NGC 1404 and NGC 584). Looking at another pair of S0s, NGC 1266 and NGC 1377 have particularly high dust/stellar ratios. For NGC 1266, we believe this could be due to an active nucleus (see Dale et al. 2007; Smith et al. 2007) which could be heating dust in the central region; however, this galaxy is likely an exception, as galaxies in the sample were selected not to have luminous AGN (Kennicutt et al. 2003). For NGC 1377, Roussel et al. (2006) argues that it is undergoing an opaque nascent burst of star formation, and the intense radiation field is significantly heating the dust.
These two S0’s and the Sa’s mentioned previously, NGC 1482 and NGC 2798, are most offset from the trend of the rest of the sample. They are relatively bright in the far-IR, but this is not accompanied by a large dust mass. The offset may be explained by their relatively warm dust temperatures, which we discuss in Section 4.3. In principle, large stellar mass-to-light ratios could also contribute to offsets in this direction, but the of these galaxies are not particularly large.
We emphasize that the outliers and substantial scatter evident in Figure 5 highlight the danger of using as a proxy for . The two quantities are certainly related, but they probe different physical processes, with different dependencies on a galaxy’s star formation history and history of dust production and destruction. Considering the selection criteria of the KINGFISH survey, only one fourth of which is composed of faint dwarf galaxies, the “true” scatter between these dust/stellar ratios is probably even larger. For the rest of this paper, we continue to focus on relations between and other galaxy properties, in order to keep the analysis as empirical as possible; subsequent KINGFISH papers will provide more detailed analyses of the galaxies’ dust and stellar masses.
We also briefly note that the dust/stellar mass ratios vary slightly with bar strength: the mean ratio for strongly barred galaxies (SAB or SB) is (rms), while galaxies with weak or no bars have a slightly lower mean ratio, (rms). This dependence may be related to the fact that strongly barred galaxies have warmer dust temperatures in their inner regions, likely due to bar-induced star formation in these regions (Engelbracht et al. 2010). Nonetheless, the variation of among barred and non-barred galaxies is much greater than the difference between them.
The metallicity dependence of the dust/stellar correlation (Figure 5b) is similar to the morphology dependence, because of the relation between morphology and metallicity (e.g., Moustakas et al. 2010). Nonetheless, there are a few differences. The correlation is strongest for metal-rich galaxies (, significance), while some galaxies with intermediate metallicities have lower dust/stellar mass ratios than one might expect, given their flux ratios. These are S0 and Sa galaxies with larger than average star formation rates (see Section 4.4); their new stars could be significantly heating the dust and increasing the FIR emission, without significantly increasing the dust mass.
In addition, the fact that the dust/stellar flux ratio is more metallicity-dependent than the dust/stellar mass ratio (comparing the metal-poor and intermediate-metallicity galaxies) suggests that the scatter between them is partly due to metallicity. This appears to be consistent with Groves et al. (2008), who found in their SED models that the IR peak shifts to longer wavelengths and becomes broader with increasing metallicity, due to the increasing dust column and the increasing mechanical luminosity of starburst regions. The residuals are also significantly correlated with dust temperature, suggesting that the scatter is also partly due to temperature, and the geometrical distributions of dust and stars within the galaxies. This is not surprising: dust mass is inversely related to dust temperature (Eqn. 3), and as we show in the next section, the dust/stellar flux ratio is positively correlated with temperature, which implies that galaxies with warmer dust tend to have more dust emission, and tend to be located towards the lower right of Figure 5.
Lastly, we note that the metallicity dependence of the dust/stellar mass ratio here is qualitatively similar to that of the dust/gas mass ratio in Draine et al. (2007), who studied a similar sample of galaxies. For the galaxies with submm data, Draine et al. (2007) find that the dust/gas ratio gradually increases by up to dex over the range of gas-phase metallicity. We also find that our metal-poor galaxies tend to have lower dust/stellar flux ratios than intermediate-metallicity galaxies. Nevertheless, there is no significant metallicity dependence of the dust/stellar mass ratios. Therefore, the scatter in Figure 5 may be partly explained by the differential dependence on metallicity.
Furthermore, since lower-metallicity galaxies have lower dust/gas mass ratios but not necessarily lower dust/stellar mass ratios, it is possible that they have lower stellar mass for a given amount of gas—that is, that their star formation is less efficient than more metal-rich galaxies. This is consistent with Lee et al. (2006), who found that metallicity is inversely related to the gas/stellar mass ratio. Note, however, that specifically for massive galaxies, Schiminovich et al. (2010) argue that star formation efficiency is independent of stellar mass and stellar mass surface density.
4.3. Far-Infrared Colors

We now examine the far-infrared colors of the galaxies in our sample, using MIPS and SPIRE bands. ‘Warmer’ far-IR colors are often associated with higher temperatures of small or large dust grain components, depending on the wavelengths (e.g., Li & Draine 2001; Boselli et al. 2010b). Low color, for example, indicates that the far-IR SED peaks at a long wavelength, likely due to a large fraction of cold dust.
In Figure 6, we show the correlation between the dust/stellar flux ratio and . We also show the correlation with dust temperature, described in Section 4.2, which uses these bands as well as the SPIRE flux densities. The correlations between the dust/stellar flux ratio and SPIRE colors (not shown) have similar trends, but with more noise. As stated in Section 4.2.1, the temperatures depend on the assumed emissivity (e.g., Bendo et al. 2003), though the relative distribution of temperatures is robust. NGC 1377 is the galaxy with the warmest dust temperature, as mentioned in the previous section, as well as the largest color. The trends in both figures are similar because an increased color generally corresponds to a warmer dust temperature, even though we are simply fitting a single temperature modified blackbody.
In both figures, there is a correlation, but with considerable scatter (Spearman rank for the color plot and for the plot, with 95% significance). In particular, only early-type galaxies ( and for the two plots) and spirals ( and ) exhibit a significant (3-) correlation: galaxies with relatively high dust emission also have relatively high far-IR colors and warm temperatures.
In addition, at a given ratio, early-types have warmer colors and dust temperatures (by up to 5 K) than spirals. (The single exceptional early-type is NGC 1291, which Hinz et al. (in prep.) show has an outer ring that is dominated by much cooler dust than the rest of the galaxy.) Perhaps this occurs because the early-types in KINGFISH tend to have slightly smaller dust masses, which require less of a heating source (e.g., stars) to significantly raise their temperatures. It has long been known that dust grains may be heated by old stars (see, e.g., Helou 1986; Sauvage & Thuan 1994; Calzetti et al. 1995; Kennicutt 1998; Draine & Li 2001); however, the clearly different trend for early-types and spirals is a new result. The S0’s with surprisingly large also have relatively warm dust temperatures, as well as slightly larger specific star formation rates, which we show in Section 4.4. It appears that some S0’s in the sample (as well as a couple Sa’s) are undergoing a period of obscured star formation, and may be similar to the early-types examined by Shapiro et al. (2010) and Wei et al. (2010), which have molecular gas possibly accumulated through minor mergers, as well as slightly elevated star formation efficiencies. Nevertheless, most of the early-types with have very little ongoing star formation and lower stellar fluxes than their spiral counterparts, and yet they still have slightly warmer temperatures. Hence, these early-types may simply have more intense radiation fields. Early-types have many stars in their bulge components (as indicated, for example, by their 3.6 m surface brightnesses), and these regions tend to have warmer dust temperatures (Engelbracht et al. 2010) in spite of the lower star formation rates, so we argue that a more intense interstellar radiation field is the most likely explanation of the different trends for late- and early-types. This issue is currently being investigated further, using models of the dust masses and starlight intensities (Aniano et al., in prep.).
Finally, the dwarf and irregular galaxies are scattered in the figures, although as noted by Walter et al. (2007) and Dale et al. (2007), some dwarfs have high ratios, indicating strong overall heating of the dust grain population.
4.4. Star Formation Rate
4.4.1 Estimating and
Finally, we turn to the star formation rates (SFRs) of the galaxies in our sample. One way to estimate SFRs is to combine H and mid-IR (specifically, 24 m) luminosities (Calzetti et al. 2007; Zhu et al. 2008; Kennicutt et al. 2009). We use the calibration proposed by Calzetti et al. (2010), with scatter dex, for galaxies with a wide range of metallicities:
where the luminosities are in units of , , , and . The first of these equations (4.4.1) is calibrated for normal galaxies (Kennicutt et al. 2009), while the latter (4.4.1) is calibrated for HII regions and starbursts (Calzetti et al. 2007). Based on the 24 m luminosity, most of the KINGFISH galaxies (42/62, and 41/54 with H fluxes) qualify as ‘normal’ galaxies.
For comparison, we also estimate SFRs using IR and UV luminosities, which is a complementary way to account for both obscured and unobscured star formation (e.g., Zheng et al. 2007; Buat et al. 2007). We use the SFR parameterization of Hao et al. (2011), which combines far-UV (1500 Å) and TIR (Eqn. 2) luminosities, and which updates the calibration in Dale et al. (2007):
| (7) |
where the luminosities are in units of , , and . Like the stellar masses, we have assumed a Kroupa (2001) IMF for the SFRs.
There is some dependence on the assumed star formation history (SFH), such as a SFH with a short recent starburst or with constant or declining star formation over a long time-scale, but the largest systematic uncertainty is the assumed (universal) IMF. There also are other systematic uncertainties due to metallicity and AGN activity and to assumptions about the attenuation correction (see Kennicutt et al. 2009; Calzetti et al. 2010).
Both star formation rates for the KINGFISH sample are listed in Table 1, except for the galaxies lacking or far-UV fluxes. The errors listed in the table are only the formal errors due to the flux densities; systematic uncertainties contribute at least 0.2 dex of additional uncertainty. The SFRs of the galaxies in the sample range from to .
The two SFR estimates are generally consistent, within 0.3 dex of each other. There are a few galaxies with larger discrepancies, such as NGC 1377 (although we had to perform an uncertain extrapolation for the far-UV flux), NGC 3351, NGC 4736, and NGC 6946 (although it has substantial diffuse background emission). IC 342, which is close to the Galactic plane (, ), is dominated by obscured star formation, and the discrepancy between its SFRs appears to be due to a relatively low 24 m flux. Consequently, its FUVTIR SFR is likely more accurate. There are also discrepancies for low-mass dwarf irregular galaxies with very low SFRs (IC 2574, DDO 154, and DDO 165; see Walter et al. 2007), which are difficult to determine accurately.
Our SFR and stellar mass estimates (discussed in Section 4.2.2) can be compared to those obtained from model fits to the SEDs. For example, Johnson et al. (2007) used the stellar population models of Bruzual & Charlot (2003) and the dust models of Witt & Gordon (2000). Using similar models, we generally find excellent agreement for the stellar masses, and good agreement for the SFRs, which are consistent within 0.3 dex. Two exceptions are NGC 3351, for which the SED fit yields a SFR that is 0.6 dex larger than our estimate using m luminosities, and NGC 3521, for which the fit yields a SFR that is 0.6 dex smaller.
We also compare to da Cunha et al. (2008), who use the same stellar population models with exponentially declining star formation histories with bursts, and with the dust emission modeled as the sum of modified blackbodies at different temperatures. We also find excellent agreement for the stellar masses, but the SFRs of nine galaxies (out of 57) are statistically inconsistent and deviate by more than 0.4 dex. The most extreme case is NGC 3190, for which da Cunha et al. obtain , more than 0.8 dex lower than our estimates. Finally, Noll et al. (2009) also estimated stellar masses and SFRs of a sample of galaxies, 32 of which are in our KINGFISH sample. They used the Maraston (2005) stellar population models, assuming either constant star formation or an exponential decreasing SFR. Their SFRs are mostly consistent with ours, except for NGC 4536 and NGC 4736, for which they obtain values much larger than our SFR(m) but similar to our SFR(TIRFUV). We conclude that our SFRs are generally reliable, although for some galaxies they are difficult to determine accurately within a factor of two.
4.4.2 Results

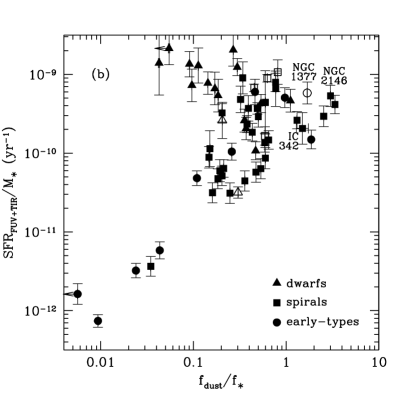
We now show the correlation between specific SFR, or SFR per unit stellar mass, and dust/stellar flux ratio in Figure 7, using both SFR estimators. The advantage of using SFR/ over SFR is that it allows us to fairly compare galaxies with a wide range of stellar mass.
In general, there is a weak trend such that specific SFR increases with the dust/stellar flux ratio. In other words, galaxies with relatively bright dust emission also tend to have more star formation. The scatter appears to be larger using SFRHα+24μm, although a statistical analysis indicates that its correlation is of similar strength (Spearman rank , versus for SFRFUV+TIR). Early-type and spiral galaxies exhibit particularly tight correlations ( and , respectively, with significance). The scatter in the figure may be due to a number of factors, such as different contributions from obscured and unobscured tracers of star formation.
The correlation between the dust/stellar flux ratio and specific SFR is interesting in the context of its correlation with stellar mass and metallicity (see Figs. 4b and 5b), considering that some authors have recently argued for a ‘fundamental plane’ relating stellar mass, SFR, and metallicity of emission-line galaxies (Mannucci et al. 2010; Lara-López et al. 2010). Many of the KINGFISH galaxies would lie on this plane, but with substantial scatter and with outliers, among which would be the early-type galaxies lacking prominent emission lines. These three galaxy properties—stellar mass, SFR, and metallicity—are certainly related to the dust/stellar flux ratio, but the inter-relations between star formation, stellar mass growth, dust production and metal enrichment are complex.
We can compare our results in Figure 7 to da Cunha et al. (2010), who studied similar properties of SDSS galaxies by modeling their SEDs. They similarly obtain a correlation between and SFR, although their correlation appears to be slightly stronger. They argue that stellar mass is not the main driver of this correlation. Nonetheless, we find that plotting the dust/stellar flux ratio against SFR (without normalizing by ) yields a shallower correlation with more scatter. da Cunha et al. (2010) also find that SFR is strongly correlated with the dust-to-gas ratio and the fraction of contributed by dust in the ambient ISM. In any case, our results appear to be consistent with theirs, with small differences likely due to sample selection (their sample is dominated by star-forming galaxies) and to the fact that their SEDs do not probe wavelengths longer than 100m, which could yield underestimates of the dust fluxes and masses for some galaxies.
The dwarf and irregular galaxies in Figure 7 depart from the positive correlation between specific SFR and dust/stellar flux ratio that we see for earlier-type galaxies ( for SFRHα+24μm and for SFRFUV+TIR; the latter anti-correlation is statistically significant). Somewhat similarly, Dale et al. (2007) find that dwarf/irregular galaxies have specific SFRs that decrease with the infrared-to-ultraviolet ratio (their Fig. 10). The dwarf galaxies’ location in Figure 7 is most likely due to their small stellar masses, and their limited dust content (Walter et al. 2007); only a small fraction of dwarfs have large SFRs (Lee et al. 2009).
Late-type and early-type galaxies have a similar relation between SFR/ and . Nonetheless, it is interesting that, according to Figure 6, late-types have cooler dust temperatures (by up to 5 K) at a given dust/stellar flux ratio. For example, some S0 and Sa galaxies have similar specific SFRs and , but the S0s have slightly warmer dust and lower dust masses. Perhaps in some of these galaxies, a small amount of star formation can more efficiently heat the dust; it is more likely, however, that the heating by the general ISRF, as well as by massive stars, is sufficient to heat the dust grains slightly more (e.g., see Draine & Li 2007).
It is also interesting that approximately half of the early-type galaxies in the KINGFISH sample still have on-going star formation and dust heating, and are more similar to some of their late-type counterparts than to the passive early-types. This is contrary to the view that galaxies with large bulge components quickly ‘quench’ their star formation. Fabello et al. (2011) argue against this view, showing that early-types with large bulge-to-disk ratios do not have lower atomic gas contents or star formation efficiencies than similar later type galaxies. Crocker et al. (2011) account for both atomic and molecular gas and obtain a similar result, such that star-forming early-type galaxies lie in a similar range of the Schmidt-Kennicutt relation as normal star-forming galaxies. Bulge components may be a necessary condition for suppressing star formation, but they are not sufficient (Bell 2008).
A number of KINGFISH galaxies appear to be similar to ‘passive disks’ and ‘red spirals’555‘Red spirals’ are spiral galaxies on the red sequence, as defined by optical colors. They include both passive spirals as well as spirals with obscured star formation (Masters et al. 2010b). recently studied by other authors (e.g., Wolf et al. 2009; Skibba et al. 2009; van der Wel et al. 2009; Masters et al. 2010b; Bundy et al. 2010). Ten galaxies in the sample have dust masses greater than , and all of them are spirals. The majority (7/10) of the galaxies with are spirals as well. Of the spiral galaxies with large dust masses or large dust/stellar ratios, some have low specific SFRs, such as the earlier-type spirals NGC 4725 and NGC 1512. These may be examples of ‘transition’ galaxies discussed by Masters et al. (2010b) and Bundy et al. (2010), galaxies between star-forming disk-dominated galaxies and passive early-types.
Nonetheless, large dust mass is not a sufficient condition for declining SFRs, because there are dusty star-forming galaxies such as the late-types NGC 4254 and NGC 4631. Earlier-type spirals with obscured star formation, such as NGC 1097, NGC 2146, NGC 2798, and NGC 7331, have also been described as transition galaxies (Zhu et al. 2011). In addition, a galaxy need not have a dominant bulge to have passive star formation: NGC 5055 and NGC 4321 are dusty galaxies with very low specific SFRs, but with Sbc morphologies. Finally, the KINGFISH sample also contains massive galaxies with ‘pseudobulges’ (i.e., lacking classical bulges), like NGC 5457 and NGC 6946, which are difficult to explain with current models of galaxy formation, in which most massive galaxies experience major mergers (Kormendy et al. 2010); however, they both have a very large gas supply (Walter et al. 2008) with which they could potentially form stars, and NGC 6946 may also have a particularly high star formation efficiency in its spiral arms (Foyle et al. 2010). It appears that, while some galaxies may be undergoing a transition to passive star formation and earlier-type morphologies, the transition is blurry and some galaxies evolve differently than others.
5. Extragalactic Background Light
Our dust/stellar flux ratios quantify the relative contributions of emission from dust and stars of individual galaxies. The extragalactic background light (EBL) is a related concept, because it can be used to quantify the contributions of stellar- and dust-dominated galaxies to the optical and infrared background. Rather than examining SEDs within galaxies, analyses of the EBL involve integrating the light from many background galaxies. Studies of the EBL distinguish between optical light from stars and IR light from dust, so it is useful to compare these studies to our analysis of the stellar and dust emission of individual galaxies, although because of the small size and incompleteness of the KINGFISH sample, we cannot make strong conclusions based on these comparisons.
A number of authors have investigated the EBL and have quantified it at different wavelengths (e.g., Hauser et al. 1998; Hauser & Dwek 2001; Dole et al. 2006; Béthermin et al. 2010; Kneiske & Dole 2010). A recent study (Domínguez et al. 2011) has attempted to distinguish between the contributions of different types of galaxies to the EBL. There has also been some theoretical work on explaining the intensity of the EBL, in the context of the evolving stellar mass density and SFR density (e.g., Chary & Elbaz 2001; Primack et al. 2005; Nagamine et al. 2006; Fardal et al. 2007). For a recent comparison of some models and constraints on the IR EBL, see Orr et al. (2011). The EBL is the dominant radiant energy in the universe aside from the cosmic microwave background, and it is thought to be mostly due to stars, dust, and AGN in galaxies (e.g., Hauser & Dwek 2001), while faint diffuse emissions can represent only a small fraction of the integrated energy (Dole et al. 2006).
Some have attempted to compare the cosmic infrared background (CIB) and the cosmic optical background (COB). Hauser & Dwek (2001) found that of the EBL is contributed by direct starlight (and the rest absorbed and re-emitted by dust at m), but with large uncertainties, while Dole et al. (2006) found that the ratio COB/CIB ranges from 0.7 to 1.5 (making the demarcation at m). Perhaps not coincidentally, some of the galaxies in the KINGFISH sample have similar ratios of , which is analogous to CIB/COB.
The galaxies that dominate the COB and CIB may constitute different populations; for example, Dole et al. (2006) argue that the CIB is mainly composed of luminous infrared galaxies (LIRGs) at . Galaxies in the KINGFISH sample with bright TIR luminosity, large masses and specific SFRs, such as NGC 1482, NGC 2146, NGC 2798, and NGC 7331, could be considered to be examples of low-redshift counterparts of these galaxies, although they are not as luminous as LIRGs. KINGFISH also includes galaxies which may be counterparts of objects dominating the optical EBL, such as NGC 3521 and NGC 5055, which are massive galaxies with significant star formation.
Lastly, note that the mean stellar/dust flux ratio of the galaxies in our sample is , and split by morphological type, the means are 0.28, 0.69, and 0.54 for dwarfs, spirals, and early-types, respectively. The summed ratio can be more directly compared to the CIB/COB estimates of Hauser & Dwek (2001) and Dole et al. (2006). This quantity, which is dominated by the more luminous galaxies, is for the whole sample. This can also be expressed as . Split by type, this dust fraction is 0.34, 0.32, and 0.07 for dwarfs, spirals, and early-types, respectively. KINGFISH does not contain a statistically complete sample; in general, dwarf galaxies dominate by number, although they are typically faint (e.g., Lee et al. 2009). Many early-types are luminous and stellar-dominated, but they are relatively few in number (e.g., Dale et al. 2009). Our results appear to indicate that, at least for nearby galaxies, spirals may constitute the most important contribution, for which their stars contribute of the light and their dust contribute . This is approximately consistent with Soifer & Neugebauer (1991), who analyzed a flux density-limited sample of local galaxies with IRAS and obtained a total dust/stellar fraction of , which is smaller than our result, probably due to their limited coverage in the far-IR. In any case, the local fraction is smaller than the high-redshift infrared EBL fraction estimated by Dole et al. (2006; CIB/(COB+CIB)), which indicates that the IR output of galaxies evolves with time and was larger in the past, consistent with studies of the evolution of IR luminosity functions (e.g., Le Floc’h et al. 2005; Chary & Pope 2010; Murphy et al. 2011a; cf., models in Fontanot & Somerville 2010). Nevertheless, a larger and more complete low-redshift catalog would be required to investigate this issue further.
6. Summary
We now summarize our main conclusions:
-
•
The dust/stellar flux ratios estimated from global galaxy SEDs are correlated with total-infrared luminosity, in a morphology and metallicity dependent way. Metal-poor dwarf galaxies tend to have faint IR luminosities, while spirals tend to have lower metallicities and higher dust/stellar flux ratios than early-types.
-
•
Dust/stellar flux and dust/stellar mass ratios are correlated, especially for early-types. Late-types and dwarf galaxies show considerable scatter, partly due to the effect of metallicity on the flux ratio. Some of the scatter is also due to the dependence on dust temperature.
-
•
Most galaxies exhibit a trend such that, those with large dust/stellar flux ratios have warmer FIR colors and dust temperatures. Late-types tend to have slightly cooler temperatures (by up to 5 K) than early-types at a given dust/stellar flux ratio, while dwarf and irregular galaxies have more scattered temperatures.
-
•
We find that late- and early-type galaxies have specific SFRs that are correlated with dust/stellar flux ratios: galaxies with more dust emission also tend to have more star formation. Combined with our previous result, we interpret this as evidence that ongoing star formation is sufficient to heat some of the dust in these galaxies, while other galaxies have more intense radiation fields, where the older stellar population likely contributes significantly to the dust heating.
-
•
The KINGFISH sample contains a number of dusty star-forming spiral galaxies as well as some passive spirals, whose limited star formation resembles that of some early-types.
Finally, we note that our results could contribute constraints for galaxy formation models, such as on the amount of dust production, metal enrichment, and star formation in different types of low-redshift galaxies. In addition, our results could be useful as a local benchmark for comparisons with high-redshift studies, such as studies of submillimeter galaxies (e.g., Santini et al. 2010) and of the evolution of the dust and stellar content of galaxies (e.g., Dunne et al. 2011).
Acknowledgments
We thank John Moustakas for providing and discussing the oxygen abundances of Moustakas et al. (2010). We thank Andy Marble for valuable discussions about our results. We also thank the anonymous referee for insightful comments that helped to improve the quality of the paper.
Herschel is an ESA space observatory with science instruments provided by European-led Principal Investigator consortia and with important participation from NASA. SPIRE has been developed by a consortium of institutes led by Cardiff University (UK) and including Univ. Lethbridge (Canada); NAOC (China); CEA, LAM (France); IFSI, Univ. Padua (Italy); IAC (Spain); Stockholm Observatory (Sweden); Imperial College London, RAL, UCL-MSSL, UKATC, Univ. Sussex (UK); and Caltech, JPL, NHSC, Univ. Colorado (USA). This development has been supported by national funding agencies: CSA (Canada); NAOC (China); CEA, CNES, CNRS (France); ASI (Italy); MCINN (Spain); SNSB (Sweden); STFC (UK); and NASA (USA).
References
- Aniano et al. (2011) Aniano G., Draine B., et al., 2011, in preparation
- Bamford et al. (2009) Bamford S. P., et al., 2009, MNRAS, 393, 1324
- Beirao et al. (2010) Beirão P., et al., 2010, A&A, 518, L60
- Bell et al. (2003) Bell E. F., McIntosh D. H., Katz N., Weinberg M. D., 2003, ApJS, 149, 289
- Bell (2008) Bell E. F., 2008, ApJ, 682, 355
- Bendo et al. (2003) Bendo G. J., et al., 2003, AJ, 125, 2361
- Bethermin et al. (2010) Béthermin M., Dole H., Beelen A., Aussel H., 2010, A&A, 512, A78
- Boquien et al. (2009) Boquien M., et al., 2009, ApJ, 706, 553
- Borch et al. (2006) Borch A., et al., 2006, A&A, 453, 869
- Boselli et al. (2010a) Boselli A., et al., 2010a, PASP, 122, 261
- Boselli et al. (2010b) Boselli A., et al., 2010b, A&A, 518, L61
- Bournaud et al. (2009) Bournaud F., Elmegreen B. G., Martig M., 2009, ApJ, 707, L1
- Bruzual & Charlot (2003) Bruzual G., Charlot S., 2003, MNRAS, 344, 1000
- Bundy et al. (2009) Bundy K., et al., 2010, ApJ, 719, 1969
- Buat et al. (2007) Buat V., et al., 2007, ApJS, 173, 404
- Buat et al. (2011) Buat V., Giovannoli E., Takeuchi T. T., Heinis S., Yuan F.-T., Burgarella D., Noll S., Iglesias-Páramo J., 2011, A&A, 529, A22
- Bussmann et al. (2009) Bussmann R. S., et al., 2009, ApJ, 705, 184
- Buta et al. (1999) Buta R. J., McCall M. L., 1999, ApJS, 124, 33
- Buta et al. (2010b) Buta R., et al., 2010, ApJS, 190, 147
- Calura et al. (2008) Calura F., Pipino A., Matteucci F., 2008, A&A, 479, 669
- Calura et al. (2009) Calura F., Pipino A., Chiappini C., Matteucci F., Maiolino R., 2009, A&A, 504, 373
- Calzetti et al. (1995) Calzetti D., Bohlin R. C., Kinney A. L., Storchi-Bergmann T., Heckman T. M., 1995, ApJ, 443, 136
- Calzetti et al. (2007) Calzetti D., et al., 2007, ApJ, 666, 870
- Calzetti et al. (2010) Calzetti D., et al., 2010, ApJ, 714, 1256
- Ceverino et al. (2010) Ceverino D., Dekel A., Bournaud F., 2010, MNRAS, 404, 2151
- Chary & Elbaz (2001) Chary R., Elbaz D., 2001, ApJ, 556, 562
- Chary & Pope (2010) Chary R.-R., Pope A., 2010, ApJ, submitted (arXiv:1003.1731)
- Cohen et al. (2003) Cohen M., Wheaton W. A., Megeath S. T., 2003, AJ, 126, 1090
- Compiegne et al. (2011) Compiégne M., et al., 2011, A&A, 525, A103
- Crocker et al. (2010) Crocker A. F., Bureau M., Young L. M., Combes F., 2011, MNRAS, 410, 1197
- da Cunha et al. (2008) da Cunha E., Charlot S., Elbaz D., 2008, MNRAS, 388, 1595
- da Cunha et al. (2010) da Cunha E., Eminian C., Charlot S., Blaizot J., 2010, MNRAS, 403, 1894
- Dale & Helou (2002) Dale D. A., Helou G., 2002, ApJ, 576, 159
- Dale et al. (2007) Dale D. A., et al., 2007, ApJ, 655, 863
- Dale et al. (2009) Dale D. A., et al., 2009, ApJ, 703, 517
- Dale et al. (2011) Dale D. A., et al., 2011, in preparation
- de Vaucouleurs et al. (1991) de Vaucouleurs G., de Vaucouleurs A., Corwin H. G., Buta R. J., Paturel G., Fouqué P., 1991, Third Reference Catalog of Bright Galaxies (Austin: Univ. Texas Press) (RC3)
- Devriendt et al. (1999) Devriendt J. E. G., Guiderdoni B., Sadat R., 1999, A&A, 350, 381
- Dole et al. (2006) Dole H., et al., 2006, A&A, 451, 417
- Dominguez et al. (2010) Domínguez A., et al., 2011, MNRAS, 410, 2556
- Draine (2003) Draine B. T., 2003, ARA&A, 41, 241
- Draine & Li (2001) Draine B. T., Li A., 2001, ApJ, 551, 807
- Draine & Li (2007) Draine B. T., Li A., 2007, ApJ, 657, 810
- Draine & Salpeter (1979) Draine B. T., Salpeter E. E., 1979, ApJ, 231, 77
- Draine et al. (2007) Draine B. T., et al., 2007, ApJ, 663, 866
- Dunne & Eales (2001) Dunne L., Eales S. A., 2001, MNRAS, 327, 697
- Dunne et al. (2010) Dunne L., et al., 2011, MNRAS, in press (arXiv:1012.5186)
- Dwek (1998) Dwek E., 1998, ApJ, 501, 643
- Engelbracht et al. (2005) Engelbracht C. W., Gordon K. D., Rieke G. H., Werner M. W., Dale D. A., Latter W. B., 2005, ApJ, 628, L29
- Engelbracht et al. (2008) Engelbracht C. W., Rieke G. H., Gordon K. D., Smith J.-D. T., Werner M. W., Moustakas J., Willmer C. N. A., Vanzi L., 2008, ApJ, 678, 804
- Engelbracht et al. (2010) Engelbracht C. W., et al. 2010, A&A, 518, L56
- Fabello et al. (2010) Fabello S., Catinella B., Giovanelli R., Kauffmann G., Haynes M. P., Heckman T. M., Schiminovich D., 2011, MNRAS, 411, 993
- Fardal et al. (2007) Fardal M. A., Katz N., Weinberg D. H., Davé R., 2007, MNRAS, 379, 985
- Fazio et al. (2004) Fazio G. G., et al., 2004, ApJS, 154, 10
- Fioc & Rocca-Volmerange (1997) Fioc M., Rocca-Volmerange B., 1997, A&A, 326, 950
- Fontanot et al. (2009) Fontanot F., Somerville R. S., Silva L., Monaco P., Skibba R., 2009, MNRAS, 392, 553
- Fontanot & Somerville (2010) Fontanot F., Somerville R. S., 2010, MNRAS, in press (arXiv:1011.0776)
- Foyle et al. (2010) Foyle F., Rix H.-W., Walter F., Leroy A., 2010, ApJ, 725, 534
- Galametz et al. (2009) Galametz M., et al., 2009, A&A, 508, 645
- Gavazzi et al. (2010) Gavazzi G., Fumagalli M., Cucciati O., Boselli A., 2010, A&A, 517, 73
- Gil de Paz et al. (2007) Gil de Paz A., et al., 2007, ApJS, 173, 185
- Gordon et al. (2010) Gordon K. D., et al., 2010, A&A, 518, L89
- Greve et al. (2006) Greve A., Neininger N., Sievers A., Tarchi A., 2006, A&A, 459, 441
- Griffin et al. (2010) Griffin M. J., et al., 2010, A&A, 518, L3
- Groves et al. (2008) Groves B., Dopita M. A., Sutherland R. S., Kewley L. J., Fischera J., Leitherer C., Brandl V., van Breugel W., 2008, ApJS, 176, 438
- Hao et al. (2011) Hao C.-N., Kennicutt R. C., Johnson B. D., Calzetti D., Dale D. A., Moustakas J., 2011, ApJ, in press (arXiv:1108.2837)
- Hauser et al. (1998) Hauser M. G., et al., 1998, ApJ, 508, 25
- Hauser & Dwek (2001) Hauser M. G., Dwek E., 2001, ARAA, 39, 249
- Helou (1986) Helou G., 1986, ApJ, 311, L33
- Hinz et al. (2011) Hinz J., et al., 2011, in preparation
- Holland et al. (1999) Holland W. S., et al., 1999, MNRAS, 303, 659
- Hota & Saikia (2005) Hota A., Saikia D. J., 2005, MNRAS, 356, 998
- Hunt & Malkan (1999) Hunt L. K., Malkan M. A., 1999, ApJ, 516, 660
- Jarrett et al. (2003) Jarrett T. H., Chester T., Cutri R., Schneider S. E., Huchra J. P., 2003, AJ, 125, 525
- Johnson et al. (2007a) Johnson B. D., et al., 2007, ApJS, 173, 377
- Jonsson et al. (2010) Jonsson P., Groves B. A., Cox T. J., 2010, MNRAS, 403, 17
- Kauffmann et al. (2003) Kauffmann G., et al., 2003, MNRAS, 341, 54
- Kendall et al. (2011) Kendall S., Kennicutt R. C., Clarke C., 2011, MNRAS, 414, 538
- Kennicutt et al. (1998) Kennicutt R. C., 1998, ARA&A, 36, 189
- Kennicutt et al. (2003) Kennicutt R. C., et al., 2003, PASP 115, 928
- Kennicutt et al. (2008) Kennicutt R. C., Lee J. C., Funes J. G., Sakai S., Akiyama S., 2008, ApJS, 178, 247
- Kennicutt et al. (2009) Kennicutt R. C., et al., 2009, ApJ, 703, 1672
- Kennicutt et al. (2011) Kennicutt R. C., Calzetti D., et al., 2011, in preparation
- Kewley & Ellison (2008) Kewley L. J., Ellison S. L., 2008, ApJ, 681, 1183
- Kobulnicky & Kewley (2004) Kobulnicky H. A., Kewley L. J., 2004, ApJ, 617, 240
- Kong et al. (2004) Kong X., Charlot S., Brinchmann J., Fall S. M., 2004, MNRAS, 349, 769
- Kormendy et al. (2010) Kormendy J., Drory N., Bender R., Cornell M. E., 2010, ApJ, 723, 54
- Kneiske & Dole (2010) Kneiske T. M., Dole H., 2010, A&A, 515, A19
- Kramer et al. (2010) Kramer C., et al., 2010, A&A, 518, L67
- Kroupa (2001) Kroupa P., 2001, MNRAS, 322, 231
- Lara-Lopez et al. (2010) Lara-López M. A., et al., 2010, A&A, 521, L53
- Lee et al. (2006) Lee H., Skillman E. D., Cannon J. M., Jackson D. C., Gehrz R. D., Polomski E. F., Woodward C. E., 2006, ApJ, 647, 970
- Lee et al. (2009) Lee J. C., Kennicutt R. C., Funes J. G., Sakai S., Akiyama S., 2009, ApJ, 692, 1305
- Le Floc’h et al. (2005) Le Floc’h E., et al., 2005, ApJ, 632, 169
- Leroy et al. (2008) Leroy A. K., Walter F., Brinks E., Bigiel F., de Blok W. J. G., Madore B., Thornley M. D., 2008, AJ, 136, 2782
- Li & Draine (2001) Li A., Draine B. T., 2001, ApJ, 554, 778
- MacArthur et al. (2009) MacArthur L. A., González J. J., Courteau S., 2009, MNRAS, 395, 28
- Machacek et al. (2005) Machacek M., Dosaj A., Forman W., Jones C., Markevitch M., Vikhlinin A., Warmflash A., Kraft R., 2005, ApJ, 621, 663
- Mannucci et al. (2010) Mannucci F., Cresci G., Maiolino R., Marconi A., Gnerucci A., 2010, MNRAS, 408, 2115
- Maraston (2005) Maraston C., 2005, MNRAS, 362, 799
- Marcum et al. (2001) Marcum P. M., et al., 2001, ApJS, 132, 129
- Martin et al. (2005) Martin D. C., et al., 2005, ApJ, 619, L1
- Massey et al. (2006) Massey P., Olsen K. A. G., Hodge P. W., Strong S. B., Jacoby G. H., Schlingman W., Smith R. C., 2006, AJ, 131, 2478
- Masters et al. (2010) Masters K. L., et al., 2010a, MNRAS, 404, 792
- Masters et al. (2010b) Masters K. L., et al., 2010b, MNRAS, 405, 783
- Meidt et al. (2011) Meidt S. E., et al., 2011, ApJ, submitted
- Mentuch et al. (2010) Mentuch E., Abraham R. G., Zibetti S., 2010, ApJ, 725, 1971
- Meurer et al. (1999) Meurer G. R., Heckman T. M., Calzetti D., 1999, ApJ, 521, 64
- Morrissey et al. (2007) Morrissey P., et al., 2007, ApJS, 173, 682
- Moustakas et al. (2010) Moustakas J., Kennicutt R. C., Tremonti C. A., Dale D. A., Smith J.-D. T., Calzetti D., 2010, ApJS, 190, 233
- Munoz-Mateos et al. (2009) Muñoz-Mateos J. C., et al., 2009a, ApJ, 701, 1965
- Munoz-Mateos et al. (2009) Muñoz-Mateos J. C., et al., 2009b, ApJ, 703, 1569
- Murphy et al. (2011a) Murphy E. J., Chary R.-R., Dickinson M., Pope A., Frayer D. T., Lin L., 2011a, ApJ, 732, 126
- Murphy et al. (2011) Murphy E. J., et al., 2011b, ApJ, 737, 67
- Nagamine et al. (2006) Nagamine K., Ostriker J. P., Fukugita M., Cen R., 2006, ApJ, 653, 881
- Noll et al. (2009) Noll S., Burgarella D., Giovannoli E., Buat V., Marcillac D., Muñoz-Mateos J. C., 2009, A&A, 507, 1793
- Orr et al. (2011) Orr M. R., Krennrich F., Dwek E., 2011, ApJ, 733, 77
- Paradis et al. (2009) Paradis D., Bernard J.-Ph., Mény C., 2009, A&A, 506, 745
- Perez-Gonzalez et al. (2006) Pérez-González P. G., et al., 2006, ApJ, 648, 987
- Pilyugin & Thuan (2005) Pilyugin L. S., Thuan T. X., 2005, ApJ, 631, 231
- Pipino et al. (2011) Pipino A., Fan X. L., Matteucci F., Calura F., Silva L., Granato G., Maiolino R., 2011, A&A, 525, A61
- Poglitsch et al. (2010) Poglitsch A., et al., 2010, A&A, 518, L2
- Popescu et al. (2010) Popescu C. C., Tuffs R. J., Dopita M. A., Fischera J., Kylafis N. D., Madore B. F., 2011, A&A, 527, A109
- Primack et al. (2005) Primack J. R., Bullock J. S., Somerville R. S., 2005, in AIP Conf. Proc., Vol. 745, 23
- Rieke et al. (2004) Rieke G. H., et al., 2004, ApJS, 154, 25
- Roussel et al. (2006) Roussel H., et al., 2006, ApJ, 646, 841
- Sandstrom et al. (2010) Sandstrom K., et al., 2010, A&A, 518, L59
- Sani et al. (2010) Sani E., Marconi A., Hunt L. K., Risaliti G., 2011, MNRAS, 413, 1479
- Santini et al. (2010) Santini P., et al., 2010, A&A, 518, L154
- Sauvage & Thuan (1994) Sauvage M., Thuan T. X., 1994, ApJ, 429, 153
- Schiminovich et al. (2007) Schiminovich D., et al., 2007, ApJS, 173, 315
- Schiminovich et al. (2010) Schiminovich D., et al., 2010, MNRAS, 408, 919
- Schlegel et al. (1998) Schlegel D. J., Finkbeiner D. P., Davis M., 1998, ApJ, 500, 525
- Shapiro et al. (2010) Shapiro K. L., et al., 2010, MNRAS, 402, 2140
- Sheth et al. (2005) Sheth K., Vogel S. N., Regan M. W., Thornley M. D., Teuben P. J., 2005, ApJ, 632, 217
- Sheth et al. (2008) Sheth K., et al., 2008, ApJ, 675, 1141
- Sheth et al. (2010) Sheth K., et al., 2010, PASP, 122, 1397
- Silva et al. (1998) Silva L., Granato G. L., Bressan A., Danese L., 1998, ApJ, 509, 103
- Skibba et al. (2009) Skibba R. A., et al., 2009, MNRAS, 399, 966
- Skrutskie et al. (2006) Skrutskie M. F., et al., 2006, AJ, 131, 1163
- Smith et al. (1984) Smith G., Elmegreen B. G., Elmegreen D. M., 1984, MNRAS, 210, 399
- Smith et al. (2007) Smith J. D. T., et al., 2007, ApJ, 656, 770
- Soifer et al. (1987) Soifer B. T., Neugebauer G., Houck J. R., 1987, ARA&A, 25, 187
- Soifer et al. (1989) Soifer B. T., Boehmer L., Neugebauer G.., Sanders D. B., 1989, AJ, 98, 766
- Soifer & Neugebauer (1991) Soifer B. T., Neugebauer G., 1991, AJ, 101, 354
- Tremonti et al. (2004) Tremonti C. A., et al., 2004, ApJ, 613, 898
- van der Wel et al. (2009) van der Wel A., Rix H.-W., Holden B. P., Bell E. F., Robaina A. R., 2009, ApJ, 706, L120
- Walcher et al. (2010) Walcher J., Groves B., Budavári T., Dale D., 2011, Ap&SS, 331, 1
- Walter et al. (2002) Walter F., Weiss A., Martin C., Scoville N., 2002, AJ, 123, 225
- Walter et al. (2007) Walter F., et al., 2007, ApJ, 661, 102
- Walter et al. (2008) Walter F., Brinks E., de Blok W. J. G., Bigiel F., Kennicutt R. C., Thornley M. D., Leroy A., 2008, AJ, 136, 2563
- Walter et al. (2010) Walter F., Sandstrom K., et al., 2011, ApJ, 726, L11
- Wei et al. (2010) Wei L. H., Vogel S. N., Kannappan S. J., Baker A. J., Stark D. V., Laine S., 2010, ApJ, 725, L62
- Weingartner & Draine (2001) Weingartner J. C., Draine B. T., 2001, ApJ, 548, 296
- Wijesinghe et al. (2011) Wijesinghe D. B., et al., 2011, MNRAS, 415, 1002
- Witt & Gordon (2000) Witt A. N., Gordon K. D., 2000, ApJ, 528, 799
- Wolf et al. (2009) Wolf C., et al., 2009, MNRAS, 393, 1302
- Young et al. (2009) Young L. M., Bendo G. J., Lucero D. M., 2009, AJ, 137, 3053
- York et al. (2000) York D. G. et al., 2000, AJ, 120, 1579
- Zheng et al. (2007) Zheng X. Z., Bell E. F., Papovich C., Wolf C., Meisenheimer K., Rix H.-W., Rieke G. H., Somerville R., 2007, ApJ, 661, L41
- Zhu et al. (2008) Zhu Y.-N., Wu H., Cao C., Li H.-N., 2008, ApJ, 686, 155
- Zhu et al. (2010) Zhu G., et al., 2011, ApJ, 726, 110
- Zibetti et al. (2009) Zibetti S., Charlot S., Rix H.-W., 2009, MNRAS, 400, 1181