11email: H.E.Wheelwright@leeds.ac.uk 22institutetext: Armagh Observatory, College Hill, Armagh BT61 9DG, Northern Ireland 33institutetext: Centre for Astrophysics Research, STRI, University of Hertfordshire, College Lane Campus, Hatfield AL10 9AB, UK
On the alignment between the circumstellar disks and orbital planes of Herbig Ae/Be binary systems
Abstract
Context. The majority of the intermediate mass, pre-main-sequence Herbig Ae/Be stars reside in binary systems. As these systems are young, their properties may contain an imprint of the star formation process at intermediate masses (2-15 ). However, these systems are generally spatially unresolved, making it difficult to probe their circumstellar environment to search for manifestations of their formation process, such as accretion disks.
Aims. Here we investigate the formation mechanism of Herbig Ae/Be (HAe/Be) binary systems by studying the relative orientation of their binary orbits and circumstellar disks.
Methods. We present linear spectropolarimetric observations of HAe/Be stars over the H line, which are used to determine the orientation of their circumstellar disks. In conjunction with data from the literature, we obtain a sample of 20 binaries with known disk position angles (PAs). We subsequently compare our disk PA data to a model to investigate whether HAe/Be binary systems and their disks are co-planar. Moreover, in the light of a relatively recent suggestion that some HAe/Be star spectropolarimetric signatures may not necessarily be related to circumstellar disks, we re-assess the relationship between spectropolarimetric signatures and disk PAs. We do this by comparing spectropolarimetric and high spatial resolution observations of young stellar objects (both HAe/Be and T Tauri stars).
Results. We find that spectropolarimetric observations of pre-main-sequence stars do indeed trace circumstellar disks. This finding is significant above the 3 level. In addition, our data are entirely consistent with the situation in which HAe/Be binary systems and circumstellar disks are co-planar, while random orientations can be rejected at the 2.2 level.
Conclusions. The conclusive alignment (at more than 3) between the disk PAs derived from linear spectropolarimetry and high spatial resolution observations indicates that linear spectropolarimetry traces disks. This in turn allows us to conclude that the orbital planes of HAe/Be binary systems and the disks around the primaries are likely to be co-planar, which is consistent with the notion that these systems form via monolithic collapse and subsequent disk fragmentation.
Key Words.:
Techniques: polarimetric – Stars: emission-line – formation – binaries – pre-main-sequence – variables: T Tauri, Herbig Ae/Be1 Introduction
Herbig Ae/Be stars are intermediate mass, , pre-main-sequence stars (see e.g. Herbig 1960; Hillenbrand et al. 1992; Waters & Waelkens 1998; Hernández et al. 2004). They are the most massive objects to experience an optically visible pre-main-sequence (PMS) phase. Therefore, they provide a key opportunity to study the early evolution of stars more massive than the lower mass T Tauri stars at these wavelengths. Herbig Ae/Be (HAe/Be) stars span the transition between low and high mass objects. As a result, it has been postulated that there is a change in accretion mechanism within the HAe/Be mass range (see e.g. Vink et al. 2002; Eisner et al. 2004; Monnier 2005). If this is the case, the more massive Herbig Ae/Be stars may form in the same fashion as the most massive stars. Consequently, the study of Herbig Ae/Be stars may be used to constrain the process of massive star formation, which is still not fully understood (see e.g. Zinnecker & Yorke 2007).
Baines et al. (2006) used spectroastrometry to detect unresolved HAe/Be binary systems and they compared the position angle (PA) of the systems to the orientation of their circumprimary disks. They reported that the binary and circumprimary disk PAs of the systems in their sample are preferentially aligned. This indicates that the circumstellar disks lie in the same plane as the binary orbit. In turn, this suggests that these systems formed via a scenario that features fragmentation, as opposed to alternatives involving the capture of binary companions.
This is consistent with one model of massive star formation. Using 3D radiation-hydrodynamic simulations, Krumholz et al. (2009) show that stars of even can form via monolithic collapse and disk accretion. A prediction of these models is that disk fragmentation leads to binary systems. The resultant binary system is aligned with the original fragmented disk structure. Therefore, because of angular momentum considerations, the binary system is also aligned with the inner accretion disk that reaches onto the primary star’s surface. In addition, the secondary, at a distance of approximately 1000 AU, has a relatively high mass. It has also been proposed that massive stars form via competitive accretion. In this scenario, a star gains material from its parental cluster. In the process, binary systems are formed via stellar capture. These binaries start as solar mass binaries at separations of the order of 1000 AU and evolve into close high mass binaries at approximately 1 AU (Bonnell & Bate 2005), much closer than in the monolithic accretion scenario. Also, as these systems are formed via stellar capture, the binary orbital planes and circumprimary disks do not necessarily lie in the same plane (Moeckel & Bally 2007), unlike the monolithic collapse and disk fragmentation scenario. Therefore, the properties of binary systems can be used to constrain the star formation mechanism at high masses.
The work of Baines et al. (2006) was extended by Wheelwright et al. (2010) who used spectroastrometry to determine the mass ratios of HAe/Be binary systems. They found that the mass-ratio distribution of HAe/Be binary systems favours comparable masses, further indicating that these systems formed via disk fragmentation. However, the sample of Baines et al. (2006) which initially suggested this was small (6 objects), while a comparison with model simulations of co-planar binary orbits and disks was lacking. Therefore, the relative alignment of HAe/Be binary orbits and circumstellar disks is still uncertain. We aim to extend the work of Baines et al. (2006) and address this uncertainty by enlarging the sample of binary HAe/Be stars with known disk PAs.
To achieve this, we require a large sample of HAe/Be binary systems with known disk orientations. We generate a sample of 20 such systems using linear spectropolarimetry and high spatial resolution data from the literature. Spectropolarimetry offers a unique opportunity to probe the circumstellar environment of young stellar objects on scales small enough to study accretion disks. If a star is surrounded by a hot disk, free electrons in the disk can polarise the light of the central star. Emission-line photons emanating from the disk do not pass through the polarising medium, unlike the continuum light. Consequently, emission lines are depolarised with respect to the continuum. Therefore, a depolarisation signature over an emission line can be used to infer the presence of a small-scale, otherwise undetected disk (Clarke & McLean 1974; Poeckert 1975; Poeckert & Marlborough 1976). Alternatively, if accretion shocks produce emission lines close to the star, the presence of a disk may be manifest by scattering polarisation of a compact source of line emission (Vink et al. 2002, hereafter V2002). Furthermore, spectropolarimetric signatures can also be used to constrain the geometry of such disks (e.g. Vink et al. 2005b).
Linear spectropolarimetry is well established as a technique to study spatially unresolved disks around HAe/Be stars (see e.g. Oudmaijer & Drew 1999; Vink et al. 2002, 2005a; Mottram et al. 2007). However, the use of spectropolarimetry to study disks has recently been revisited by Harrington & Kuhn (2007). The authors report observations of spectropolarimetric signatures across absorption components of H emission lines. It is suggested such signatures are due to a process other than scattering in a disk. Instead, Kuhn et al. (2007) propose that optical pumping and absorption in winds may be responsible. Optical pumping, i.e. a preferential population of different magnetic sub-states of the lower level of an atomic transition, may be caused by an anisotropic radiation field. If a gas is optically pumped, its opacity will depend upon the orientation of the electric field of incident radiation. As a result, the absorption of light in such gas can result in linear polarisation effects across absorption features (see Kuhn et al. 2007, 2010). We note that all spectropolarimetric signatures require a flattened, asymmetric geometry otherwise the polarisation vectors cancel. This is independent of the polarising mechanism. Nonetheless, if the polarisation signatures of HAe/Be stars originate in significantly asymmetric winds, this does not automatically demand an inward coplanar extension of any large-scale circumstellar disk. Here we investigate whether there is a clear relationship between the angle of polarisation and disk orientation which, at minimum signals alignment between the unresolved and resolved spatial scales. Such an outcome is required if indeed the bulk of the observed linear polarisation of these objects is due to a circumstellar disk.
This paper is structured as follows. In Section 2 we evaluate the alignment of HAe/Be binary systems and circumstellar disks using linear spectropolarimetry over H to determine the PAs of disks in HAe/Be binary systems. To justify the use of spectropolarimetry to trace circumstellar disks, we reassess the relationship between spectropolarimetric signatures and disk PAs in Section 3. Finally, we discuss the results and conclude the paper in Section 4.
2 The relative orientation of HAe/Be binary systems and circumstellar disks.
The key to determining whether HAe/Be binary planes and circumstellar disks are preferentially aligned is to use a large sample of binary systems with known disk PAs. There are several studies of HAe/Be star binary systems (see e.g. Baines et al. 2006; Wheelwright et al. 2010). However, there are few measurements of the orientation of the circumstellar disks in these systems. Linear spectropolarimetry is the favoured technique to probe the orientation of HAe/Be star disks since a sample of 20 can be obtained in a few nights of observing (see e.g. V2002). To maximise our sample of disk PAs, we have conducted new H spectropolarimetric observations; taken linear spectropolarimetric results from previous work; and assimilated additional constraints on HAe/Be star disk orientations from the literature. We first present the additional spectropolarimetric observations we undertook (Section 2.1). We then use the assembled sample of disk PAs, in conjunction with a simple model (described in Section 2.3), to evaluate the hypothesis that circumstellar disks in HAe/Be binary systems lie in the orbital plane (Section 2.4).
2.1 Linear spectropolarimetric observations
We present linear spectropolarimetric observations of HAe/Be stars conducted in the R band and centred on H. Here we describe the observing procedure and the data reduction steps before presenting the observed spectropolarimetric signatures.
The sample was predominately chosen from the catalogue of Thé et al. (1994). Targets were selected based on their visual magnitude (V 12-13). This is because spectropolarimetry requires high signal-to-noise-ratio (SNR) data and thus only bright targets can be observed. Most of the targets were binary Herbig Ae/Be stars that had not been observed with spectropolarimetry previously, and these were primarily drawn from Baines et al. (2006) and Thomas et al. (2007). Several objects with existing spectropolarimetric data were observed to check the results are consistent with previous observations.
The linear spectropolarimetric data were obtained using the William Herschel Telescope (WHT) from 08-11-2008 to 10-11-2008. Clouds were present for the majority of the three nights, preventing observation for some, but not all, of the time. The seeing was typically fair (1″), although on occasions it became poor (2–2.5″). The observations were conducted with the ISIS spectrograph which was equipped with polarising optics comprising of a calcite block and a rotating half-wave plate. The R1200R grating was used and the central wavelength was set to 6560 . Several slit widths were used, ranging from 1 to 1.8 arcsec, and the minimum spectral resolution was found to be , or 70 .
The calcite block separated the incident light into two perpendicular rays: the ordinary (O) and the extraordinary (E) rays. Each observation comprised of both the O and the E ray spectrum of the science target, and a corresponding set of sky spectra. The polarisation at PAs of was measured by rotating the half-wave plate. Multiple polarisation standard stars were observed to characterise the instrumental polarisation and calibrate the polarisation angle. A log of the observations is presented in Table 1.
| Object | Alt. Name | RA | Dec | Spec. Type | Slit | Seeing | Date | ||||
|---|---|---|---|---|---|---|---|---|---|---|---|
| (J2000) | (J2000) | (mags) | (mins) | (″) | (″) | (%) | () | ||||
| XY Per | HD 275877 | 03 49 36.3 | +38 58 55.5 | A2IIv | 9.4 | 120.0 | 1.2 | 0.7 | 10-11-2008 | ||
| MWC 758 | HD 36112 | 05 30 27.5 | +25 19 57.1 | A5IVe | 8.3 | 60.0 | 1.5 | 1.0 | 08-11-2008 | ||
| HK Ori | MWC 497 | 05 31 28.1 | +12 09 10.2 | A4pev | 11.7 | 133.3 | 1.5 | 1.5 | 08-11-2008 | ||
| V586 Ori | HD 37258 | 05 36 59.2 | 06 09 16.4 | A2V | 9.8 | 146.7 | 1.5 | 0.9 | 09-11-2008 | ||
| BF Ori | HBC 169 | 05 37 13.3 | 06 35 0.6 | A5II-IIIev | 10.3 | 133.3 | 1.5 | 0.8 | 09-11-2008 | ||
| V350 Ori | HBC 493 | 05 40 11.8 | 09 42 11.1 | A1 | 11.5 | 120.0 | 1.5 | 0.6 | 10-11-2008 | ||
| MWC 147 | HD 259431 | 06 33 5.2 | +10 19 20.0 | B6pe | 8.8 | 53.4 | 1.5 | 0.9 | 09-11-2008 | ||
| GU CMa | HD 52721 | 07 01 49.5 | 11 18 3.3 | B2Vne | 6.6 | 15.3 | 1.5 | 1.3 | 08-11-2008 | ||
| HD 179218 | MWC 614 | 19 11 11.3 | +15 47 15.6 | A0IVe | 7.2 | 60.0 | 1.5 | 1.2 | 08-11-2008 | ||
| HBC 310 | AS 477 | 21 52 34.1 | +47 13 43.6 | B9.5Ve | 10.2 | 110.0 | 1.5 | 1.0 | 09-11-2008 | ||
| Il Cep | HD 216629 | 22 53 15.6 | +62 08 45.0 | B2IV-Vne | 9.3 | 86.7 | 1.5 | 1.3 | 08-11-2008 | ||
| MWC 1080 | V628 Cas | 23 17 25.6 | +60 50 43.6 | B0eq | 11.6 | 96.7 | 1.5 | 1.0 | 09-11-2008 |
Data reduction was conducted using the Image Reduction and Analysis Facility (iraf)111http://iraf.noao.edu/, see Tody (1993), in conjunction with routines written in Interactive Data Language (idl). The data reduction process for each observation consisted of trimming, bias subtraction, flat-field division and cosmic-ray removal. Following the above, the target O and E spectra, and those of the sky if they were present, were extracted from each frame. Sky spectra, which were not always detected, were typically a few percent of the stellar spectra. We note that polarisation signatures over H, which are the focus of the paper, are unaffected by contaminant sky polarisation. Therefore, the sky polarisation has no influence on our final results. Wavelength calibration was performed using CuNe and CuAr arc spectra, which were obtained periodically during the observing run.
Once the O and E ray spectra had been extracted, the Stokes parameters
for each data set were calculated using a routine written in
idl. The method used is that outlined in the ISIS polarisation
manual by Jaap Tinbergen and René
Rutten222http://www.ing.iac.es/Astronomy/observing/manuals
/html_manuals/wht_instr/isispol/isispol.html. For
each set of polarisation data, i.e. data obtained with the half-wave
plate at or
, the ratio of the O and E
rays in each spectrum was calculated. To obtain the degree of
polarisation, the data obtained at a given PA were averaged and the
following equations were used:
| (1) |
| (2) |
where = , is the total flux input and and are the fluxes of the O and E rays at the stated half-wave plate PAs. This procedure was repeated for the other set of polarisation data, i.e. data obtained with half-wave-plate PAs of , to calculate .
To calculate the total polarisation and the polarisation angle the data were combined using the following equations:
| (3) |
| (4) |
where represents the total polarisation, and is the polarisation angle.
Instrumental polarisation was not corrected for. The standard observations indicate that the instrumental polarisation is of the order 0.1 per cent, and is not the dominant source of continuum polarisation. Interstellar polarisation is not corrected for either, as such corrections are typically subject to significant uncertainties (see e.g. Jensen et al. 2004). Contaminant polarisation simply adds a wavelength independent vector to the Stokes and parameters. Therefore, plotting the spectrally dispersed against allows the intrinsic angle of polarisation, and hence the polarising media, to be established.
2.1.1 Spectropolarimetric signatures
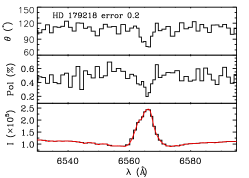
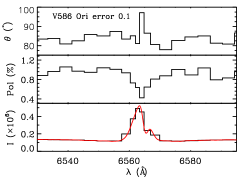
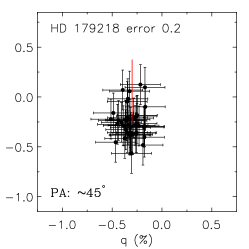
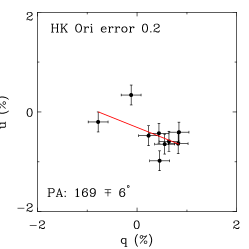
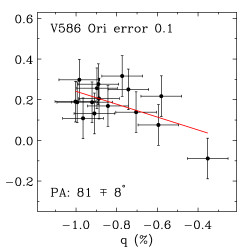
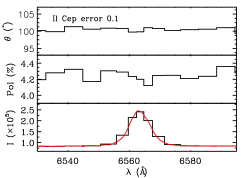
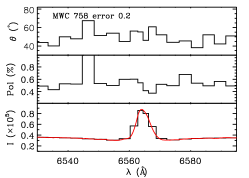
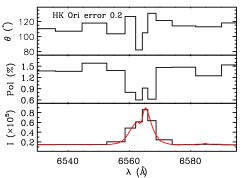
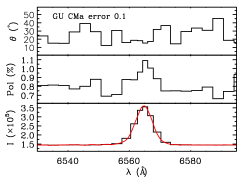
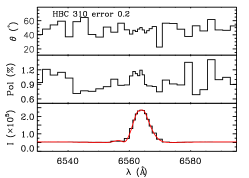
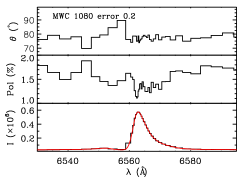
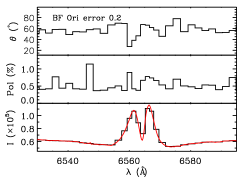
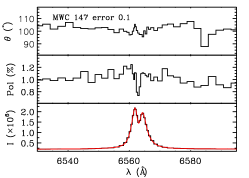
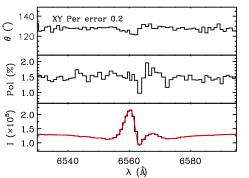
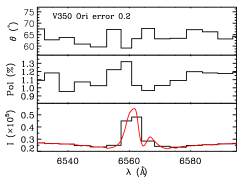
We present an example of the spectropolarimetric signatures observed in Figure 1. Data around H for all the stars in the sample are presented in Appendix A in Figure 5, while continuum polarisation measurements are included in Table 1. The signatures of the objects previously observed with spectropolarimetry are generally consistent with published results (e.g. Vink et al. 2002, 2005a; Mottram et al. 2007). This provides an important check on the data reduction process. In general, the data are of slightly inferior quality to previous observations. This is attributed to the poor weather conditions throughout the observing. Consequently a coarser binning is used than is typical for such data. Five objects exhibit a change in both linear polarisation and the polarisation angle over H (HD 179218, HK Ori, MWC 1080, V586 Ori & MWC 147). MWC 1080 and MWC 147 were also observed by Mottram et al. (2007, hereafter M2007). While the data are broadly consistent with the previous observations, the line effects are not obvious in the diagram. This is probably a result of the coarse binning. Less coarse binning does not reveal any signatures as the scatter increases considerably. Therefore, the results of M2007 are used rather than these new data. Of the three remaining objects that exhibit line effects, HK Ori and V586 Ori exhibit an excursion in space and HD 179218 exhibits a clump of data surrounding the continuum value, with a slight extension along the axis.
To arrive at the disk position angle from these spectropolarimetric signatures, one should have some knowledge of the polarising mechanism. In general, if the polarimetric signature is the result of simple depolarisation, the polarisation vector in space should be measured from the line to the continuum. In case of intrinsic line polarisation, the reverse is true, effectively resulting in a difference of 90 from the former mechanism. To differentiate between the two, the width of the line-effect is often used as a proxy (see V2002). The intrinsic polarisation angles of HK Ori and V586 Ori are determined via linear fits to their excursions, assuming the signature is due to depolarisation (as the width of the spectropolarimetric signatures is comparable to the emission line width, see Vink et al. 2002). The polarisation angle of HD 179218 is calculated assuming the excursion is only in the direction and that the signature is due to intrinsic polarisation (since the signature is narrower than the emission line). The uncertainties in the polarisation angles calculated are approximately .
|

|
|
|
|
|
The continuum polarisation presented in Table 1 is broadly consistent with literature values (see e.g. Maheswar et al. 2002). However, there are exceptions. For example, we note that the continuum polarisation of HK Ori and MWC 758 differs from literature values. This may be due to intrinsic variability as both objects are known to exhibit variable polarisation (see Baines et al. 2004; Beskrovnaya et al. 1999).
2.2 Literature data
To supplement the spectropolarimetrically observed sample, intrinsic polarisation angles (determined using spectropolarimetry) and binary PAs were taken from the literature. The resultant sample of objects for which both spectropolarimetric and binary PAs are available is presented in Table 2. As the original studies from which the data are taken were not primarily concerned with disk orientations, we re-assessed all the polarisation angles taken from the literature to ensure they are calculated consistently. The data associated with the PAs listed in Table 2 were employed to determine approximate angles. If these differed by more than from the literature values, the reported angles were rotated by (see the discussion above on calculating disk PAs from spectropolarimetry). Table 2 presents the resultant sample.
The sample was then further supplemented by adding disk PAs determined from direct imaging and multi-baseline interferometry. The additional sample is also presented in Table 2.
| Object | Alt. Name | Type | Bin. PA | Pol. PA | Disk PA |
|---|---|---|---|---|---|
| () | () | () | |||
| Only spectropolarimetry | |||||
| MWC 166 | HD 53367 | B0 | 2981 | 462 | |
| HD 58647 | BD 13 3008 | B9 | 1153 | 204 | |
| MWC 158 | HD 50138 | B9 | 303 | 1354 | |
| MWC 120 | HD 37806 | A2 | 341 | 904 | |
| V586 Ori | HD 37258 | A2 | 2171 | 815 | |
| T Ori | MWC 763 | A3 | 1071 | 204 | |
| HK Ori | MWC 497 | A4 | 47 1 | 1695 | |
| Spectropolarimetry and imaging/interferometry | |||||
| HD 200775 | MWC 361 | B2 | 1646 | 932 | 77 |
| MWC 147 | V700 Mon | B6 | 821 | 1682 | 808 |
| HD 45677 | FS CMa | B29 | 1503 | 16410 | 7711 |
| BD +40 4124 | V1685 Cyg | B3 | 17512 | 362 | 11013 |
| MWC 1080 | V628 Cas | B0 | 2691 | 752 | 5513 |
| CQ Tau | HD 36910 | F3 | 5612 | 204 | 12014 |
| HD 179218 | MWC 614 | A0 | 14112 | 455 | 2315 |
| Only imaging/interferometry | |||||
| MWC 758 | HD 36112 | A5 | 31112 | 12813 | |
| V892 Tau | HBC 373 | B8 | 2312 | 5316 | |
| R Mon | MWC 151 | B0 | 28717 | 8018 | |
| MWC 297 | NZ Ser | B0 | 31319 | 16520 | |
| HR 5999 | V856 Sco | A7 | 11121 | 2522 | |
| HD 101412 | PDS 57 | B9.5 | 22612 | 3815 | |
1: From the data presented in Wheelwright et al. (2010), 2: M2007, 3: Baines et al. (2006), 4: Vink et al. (2005a), 5: These data, see Section 2.1.1, 6: Pirzkal et al. (1997), 7: Okamoto et al. (2009), 8: Kraus et al. (2008), 9: Cidale et al. (2001), 10: Patel et al. (2006), 11: Monnier et al. (2006), 12: Thomas et al. (2007), 13: Eisner et al. (2004), 14: Doucet et al. (2006), 15: Fedele et al. (2008), 16: Monnier et al. (2008), 17: Weigelt et al. (2002), 18: Fuente et al. (2006), 19: Vink et al. (2005c), 20: Manoj et al. (2007), 21: Stecklum et al. (1995), 22: Preibisch et al. (2006).
2.3 Modelling co-planar binary systems and disks
In order to compare disk and binary PAs in a meaningful way, a model is required to predict the difference in the two angles expected for various scenarios. Baines et al. (2006) simply compare disk and binary PAs. However, binary PAs do not necessarily relate to the binary orbital plane. For example, even when a binary system and its circumprimary disk lie in the same plane, if the system is seen face-on, the binary PA is unrelated to the PA of the disk. In the case of more edge-on systems, the binary PA is likely to be aligned with the disk PA. Nonetheless, at certain phases of the orbit, the binary PA will be quite different to the circumprimary disk PA. It is only in the extreme case of an edge-on, co-planar system that the disk and binary PAs are constantly aligned. Here we employ a new model to predict the average distribution in the difference between disk and binary PA when circumstellar disks and binary orbits lie in the same plane.
The model is characterised by a random orbital phase; inclination; semi-major axis and PA of the line about which the system is inclined. The eccentricity of the system was kept constant. Although a constant eccentricity is not truly representative of the eccentricity distribution of PMS binary systems (see e.g. Goodwin et al. 2007), neither is a random eccentricity distribution. Since the eccentricity can affect the results, the input eccentricity is left as a constant and is treated as a free parameter. This allows us to fit the observed distribution in differences between binary and disk PAs. The masses of the components were kept constant at 6 & 1 . The component masses have little influence on the final distribution and are mentioned only for completeness.
We used 10 000 random systems to determine the distribution in the difference between the disk and binary PAs (PA). Spectropolarimetry is insensitive to face on systems as the projected polarisation vectors cancel one-another out. Therefore, systems with low inclinations are discarded. The value of the cut-off inclination does affect the final distribution. However, so long as large values (e.g.) are not chosen, the differences between the final distributions are relatively small. Since we also use imaging observations which are less sensitive to inclination, a low cut-off value () is used. The imaging and spectropolarimetric samples have different cut-off values. However, neither sample is large enough to be used in isolation, and thus a single cut-off value is required. Changing the cut-off value has a similar effect to changing the eccentricity. Since we use the eccentricity as a free parameter, the use of a single cut-off value for the sample of both imaging and spectropolarimetric data will not prevent a fit to the data. By varying the eccentricity to fit the data, the uncertainty in the cut-off value is essentially incorporated into the best-fitting eccentricity as a systematic uncertainty.
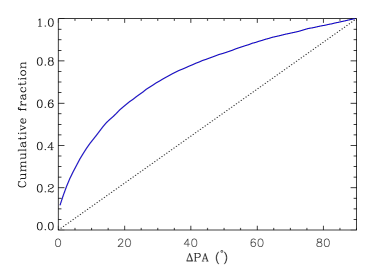
Figure 2 presents a typical distribution. We are only concerned with the magnitude of the difference between disk and binary PAs. Therefore, we convert all differences between these angles to be in the range . For example, a difference of is away from alignment, and is thus classified as a difference of . An alignment between disk and binary PAs corresponds to an offset of 0. It can be seen that the distribution tends towards intrinsic alignment, and appears noticeably different to the distribution expected if the two angles are not related. Specifically, the distribution does not exhibit a direct correlation between binary and disk PA, but does demonstrate an excess of aligned angles over the random distribution. This is to be expected based on the previous discussion. To reiterate, co-planar disks and orbits are more likely to be observed to be aligned than not, since at high inclinations the disk and binary PAs will be the same. This is not the case for non-coplanar systems. Therefore, the co-planar distribution exhibits a preference for an alignment between disk and binary position angles compared to the random distribution.
We note that comparing this model to observations assumes that the orientation of the circumstellar disks in the sample is primordial. This need not be the case. Even if the circumstellar disks in HAe/Be binary systems originally lie in the plane of the binary orbits, gravitational interactions with another star have the potential to alter their orientation (see e.g. the discussion in Bate et al. 2000). This would weaken an intrinsic correlation between binary and disk PA. Therefore, any observed correlation between disk and binary PA may be more significant than it initially appears. However, quantifying this is beyond the scope of the paper.
2.4 The relationship between binary and disk position angle
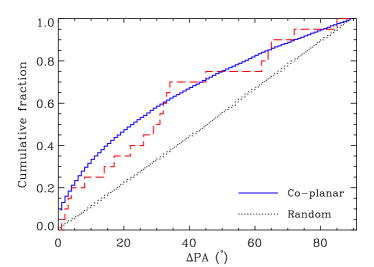
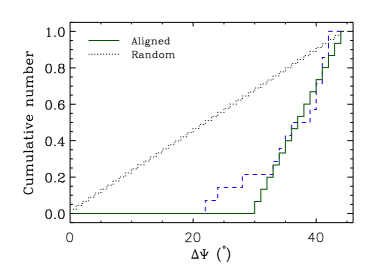
The final sample of HAe/Be binary systems with disk PAs contains 20 objects, and is thus more than three times greater than that of Baines et al. (2006). The differences between disk and binary PAs in the sample are compared to the co-planar model and a random distribution. In Figure 3 we show the cumulative distribution of the differences in PA between the binary systems and those derived for the disks. Also in the figure are the distributions predicted by the co-planar model and a completely random association of disk and binary PAs. A first glance indicates that the aligned scenario provides a better fit to the data than the random distribution. This is corroborated by a Kolmogorov-Smirnov (KS) test; while the co-planar model is found to be consistent with the data (it can only be ruled out at the 0.2 level), the random hypothesis is barely consistent with the data, and can be rejected at a level of 2.2.
This 2 level of rejection may seem low, but we note that both models are more similar in their cumulative distributions than one might naively expect. As mentioned earlier, this is because inclined binary systems do not necessarily have the same observed orientation as their circumprimary disks. This may explain why our significance, with an improved data-set, is of the same order as Baines et al. (2006) found with a smaller data-set and a more simplistic model.
Improving the current statistics requires further enlarging the sample. We find that if the data followed the model distribution exactly, differentiating between the two scenarios at a 3 level would require a sample of approximately 50 objects. Nonetheless, the current data are consistent with the co-planar hypothesis and furthermore, this scenario is favoured over random alignments.
 |
3 Does spectropolarimetry really trace circumstellar disks?
Our use of spectropolarimetry assumes that the spectropolarimetric signatures of HAe/Be stars can be used to trace the orientations of their circumstellar disks. Linear polarisation has been used for some time to probe the orientation of circumstellar disks (see e.g. Bastien & Menard 1990). However, the proposal of Harrington & Kuhn (2007) and Kuhn et al. (2007) that the spectropolarimetric signatures of HAe/Be stars are due to optical pumping and not scattering in a disk implies that these signatures do not have to trace disks. We address this issue here and do this by comparing spectropolarimetric observations of young stellar objects with independent measurements of the orientation of their disks. To increase the sample we include observations of both HAe/Be and T Tauri stars.
Table 3 presents the sample of young stellar objects, both low mass T Tauri objects and Herbig Ae/Be stars, for which the combination of spectropolarimetric observations and independent observations of their circumstellar disks is available. We first concentrate on the HAe/Be sample and then assess whether there is a general trend within the combined sample of young stellar objects. The majority of HAe/Be disks are thought to be optically thin (see e.g. Natta et al. 2001). If the observed polarisation signatures are due to single scattering in these disks, the polarisation angles will be perpendicular to the disks’ PA on the sky. Therefore, if the spectropolarimetric signatures of HAe/Be stars are due to disks, the difference between the disk and polarisation angles for this sample will be . In testing this hypothesis, we allow for an uncertainty in the difference between polarisation and disk PAs of 15, which is typical for the values used. In some cases, there is a systematic uncertainty due to different PAs being reported by different authors. For example, in the case of AB Aur, Mannings & Sargent (1997) report a disk PA of while Corder et al. (2005) report various possible angles ranging from to . However, such cases are not common, and are unlikely to influence conclusions regarding the whole sample.
| Object | Alt. Name | Type | Disk PA | Pol. PA | PA | |
|---|---|---|---|---|---|---|
| () | () | () | ||||
| HAe/Be | ||||||
| HD 200775 | MWC 361 | B2 | 71 | 932 | 86 | |
| MWC 147 | V700 Mon | B6 | 803 | 1682 | 88 | |
| HD 45677 | FS CMa | B24 | 775 | 1646 | 87 | |
| BD +40 4124 | V1685 Cyg | B3 | 7 | 362 | 74 | |
| MWC 1080 | V628 Cas | B0 | 7 | 752 | 20 | |
| CQ Tau | HD 36910 | F3 | 1208 | 209 | 80 | |
| MWC 480 | HD 31648 | A3 | 7 | 559 | 85 | |
| AB Aur | HD 31293 | A0 | 10 | 1609 | 81 | |
| HD 179218 | MWC 614 | A0IVe | 2311 | 4512 | 22 | |
| T Tauri | ||||||
| RY Tau | HD 283571 | F8 | 6213 | 1639 | 79 | |
| SU Aur | HD 282624 | G2 | 12714 | 1309 | 3 | |
| FU Ori | HBC 186 | G3 | 4715 | 459 | 2 | |
| GW Ori | HD 244138 | G5 | 5616 | (60)9 | 4 | |
| DR Tau | HBC 74 | K5 | 12817 | 1209 | 8 | |
1: Okamoto et al. (2009), 2: M2007, 3: Kraus et al. (2008), 4: Cidale et al. (2001), 5: Monnier et al. (2006), 6: Patel et al. (2006), 7: Eisner et al. (2004), 8: Doucet et al. (2006), 9: Vink et al. (2005a), 10: Mannings & Sargent (1997), 11: Fedele et al. (2008), 12: these data, 13: Akeson et al. (2003), 14: Akeson et al. (2002), 15: Malbet et al. (2005), 16: Mathieu et al. (1995), 17: Kitamura et al. (2002).
3.1 Herbig Ae/Be stars
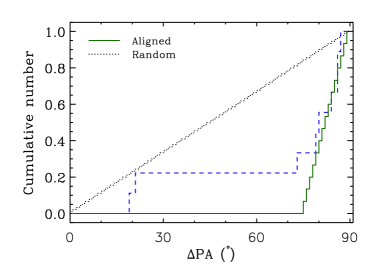
In the case of the HAe/Be stars in Table 3, the majority of the objects (7 out of 9) have polarisation angles approximately perpendicular to their imaged disks. This might be expected if the polarisation signatures are due to single scattering in disks. Therefore, this appears to validate the use of spectropolarimetry to trace disks. Here we quantify this. We use the HAe/Be star data in Table 3 to test the hypothesis that the intrinsic polarisation angle is always perpendicular to the disk PA (within the errors). The cumulative distribution of the difference in disk PA and polarisation PA is shown in Figure 4. We find that the hypothesis that the disk and polarisation angles are unrelated to each other and thus randomly oriented can be discounted at a significant level (at 3.1 according to the KS test). In contrast, the hypothesis that the spectropolarimetric signatures of the HAe/Be stars are oriented perpendicularly to their disks cannot be rejected beyond the 1 level, and is thus consistent with the data. Therefore, we find that spectropolarimetric signatures of HAe/Be stars do trace the orientation of their circumstellar disks.
We note that, although the majority of HAe/Be objects exhibit a difference in disk and polarisation angle that is close to , two objects have disk and polarisation angles that are essentially aligned. This is contrary to expectations based on single scattering occurring in an optically thin disk. In their smaller sample, Vink et al. (2005a) also note several objects where this is the case. They suggest that while the spectropolarimetric signatures of all young stellar objects are due to circumstellar disks, the angle of the resulting polarisation vector is dependent upon the properties of the inner disk. If the inner disk is optically thin, single scattering dominates and the resulting polarisation vector is perpendicular to the disk PA. In contrast, if the inner disk is optically thick, the polarisation vector is parallel to the disk PA due to multiple scattering.
Many of the T Tauri stars in Table 3 also have disk and polarimetric PAs that are aligned. Therefore, if this argument is correct, it would appear that the majority of T Tauri star disks are optically thick in the inner regions.
3.2 Removing the dependence on optical depth
Although the previous test provides a statistically significant result, it could be argued that this is dependent upon prior knowledge of the disks’ optical depth. Assuming HAe/Be star disks are optically thin is in part justified. The vast majority of the HAe/Be stars considered have an offset between disk and polarisation angle that is close to 90, as expected for single scattering in optically thin disks. However, it could be argued that this is a circular argument. Moreover, in the case of the T Tauri objects, the disk and polarisation angles are generally aligned. A more appropriate hypothesis for the total sample may be a combination of the two scenarios, i.e. that polarisation angles are related to the PAs of disks, but that the polarisation angles can be either aligned or perpendicular to the disk. In general, we do not have prior knowledge of the optical depth of the disks. Therefore, we test the relationship between polarisation and disk angle without making a priori assumptions.
In the scenarios mentioned above, the difference between the disk and spectropolarimetric angle is either 0 or 90, depending upon the optical depth of the inner disk. Consequently, it can be expected that the offset from 45 to the difference between disk and spectropolarimetric angle (henceforth ) is always 45. We note that this is the case regardless of whether the signature is interpreted as being due to line polarisation or depolarisation, or whether the disk is optically thin or thick. Therefore, this test is even more robust than the previous which assumes optically thin scattering and is subject to the polarisation signature being interpreted correctly. Here we compare this hypothesis to the sample presented in Table 3. The disk and spectropolarimetric angles in Table 3 are used to calculate . This is then compared to the hypothesis that is 45 by calculating the average of 10 000 equally sized samples in which is 45 but with an additional random error contribution with a maximum value of 15(see Figure 4).
 |
 |
The hypothesis that is random can be discounted at a significant level (above 3). This leaves the hypothesis that is always 45, which cannot be rejected at greater than a 1 level and is thus consistent with the data. This confirms the earlier finding that spectropolarimetric signatures trace disks and demonstrates that this is not dependent on spectral type and classification (i.e. T Tauri star or HAe/Be star).
To summarise, we show that the spectropolarimetric data presented in Table 3 do appear to trace circumstellar disks. This would be expected if the polarisation is due to scattering in these disks. However, Harrington & Kuhn (2009) claim many of the HAe/Be stars in our sample have polarisation signatures which require optical pumping and absorption in outflows (e.g. AB Aur and MWC 480). We show here that regardless of the polarising mechanism, spectropolarimetry can be employed to trace the orientation of circumstellar disks.
4 Discussion and Conclusion
4.1 On the use of spectropolarimetry to probe circumstellar disks
The results presented in this paper indicate a direct correlation between the spectropolarimetric signatures of pre-main-sequence stars and the orientations of their circumstellar disks. This is significant above the 3 level and appears independent of the classification of the young stellar objects. Therefore, we conclude that spectropolarimetric signatures of young stellar objects do indeed trace the orientation of their circumstellar disks. This is expected in the case of polarisation of stellar and accretion shock photons by disks (McLean & Clarke 1979; Vink et al. 2002). In the case of polarisation via optical pumping and absorption, the relationship between spectropolarimetric signatures and disks is less clear.
We note that Kuhn et al. (2010) suggest that the polarisation signature of the Herbig Be star HD 200775 is due to optical pumping and that the signature does trace the orientation of an imaged disk. However, the spectropolarimetric signature of this object is observed across a double-peaked emission line profile, and might therefore be the result of depolarisation after all. Nevertheless, many Herbig Ae/Be stars, several of which are in our sample, exhibit polarisation signatures associated with P Cygni line profiles, i.e. outflowing gas (see e.g. Harrington & Kuhn 2009). Here we show that the signatures still appear to trace the orientation of circumstellar disks. This implies that, if the spectropolarimetric signatures are due to optical pumping and absorption in a wind, the wind geometry essentially mirrors that of the disk, at least in the regions where the polarisation occurs.
This is partly substantiated by recent observations of the H emission of the Herbig Ae star AB Aur with the CHARA array by Rousselet-Perraut et al. (2010). This object has been proposed to exhibit polarisation due to optical pumping since it displays polarisation across the P Cygni absorption component of its H emission (Harrington & Kuhn 2007). Rousselet-Perraut et al. (2010) resolved the H emitting region around AB Aur and found that it could be modelled as the base of a wind represented by a flattened torus encompassing a circumstellar disk. Provided the inclination and the angle between the wind surface and disk mid-plane is low ( and 35 in the case of the disk-wind model of Rousselet-Perraut et al. 2010), such a flattened torus might well appear to have a similar morphology to the disk.
4.2 On the alignment between binary systems and their circumprimary disks
To investigate the relative alignment of HAe/Be binary systems and circumstellar disks we have used spectropolarimetry and high spatial resolution data to determine the orientation of circumstellar disks around the primary components of such systems. We then combined these disk angles with binary parameters to assess whether HAe/Be circumstellar disks and binary systems are co-planar. Studies of lower mass T Tauri stars have found that the circumstellar disks in T Tauri star binary systems tend to be aligned, suggesting that such systems may form via fragmentation (see e.g. Wolf et al. 2001; Jensen et al. 2004; Monin et al. 2006). Here we investigate whether this is also the case for HAe/Be systems. We note that Maheswar et al. (2002) also compared HAe/Be binary and polarisation angles (although these were calculated via broadband polarimetry and thus subject to uncertainties in the correction for the interstellar polarisation). These authors find that their data are inconsistent with a random association of disk and binary position angles with a significance of 84 per cent. This is not very conclusive and the authors note that they do not account for projection effects and thus the actual correlation may be stronger. We do account for projection effects and demonstrate that, in principle, co-planar and randomly orientated disks and binaries can be differentiated.
We show that the data are best fit with a model in which the binary orbit and circumprimary disk are co-planar. This is consistent with the suggestion that these systems formed via the monolithic collapse of a core and subsequent disk fragmentation, which is how massive binary systems are thought to form (see Krumholz et al. 2009). However, as of yet, a random association of disk and binary planes can only be excluded at a 2 level. A sample of approximately 50 objects is required to reject the random hypothesis and thus to differentiate between the two scenarios at 3 or higher.
4.3 Final remarks
To summarise, we find that spectropolarimetric signatures of young stellar objects do trace the orientation of their circumstellar disks. This is independent of a specific mechanism for the linear polarisation. In itself, this finding is insensitive to the polarising mechanism as all mechanisms require some form of asymmetric geometry. We note that scattering in a disk appears a plausible polarisation mechanism as it naturally explains the relationship between disk and polarisation angle. Furthermore, assuming the polarisation of T Tauri stars is due to multiple scattering in optically thick disks, it is consistent with the observation that T Tauri star polarisation is generally parallel to imaged disks while the reverse is true for most HAe/Be stars. It is not clear how optical pumping and polarisation via absorption can reproduce the different polarimetric behaviour of HAe/Be and T Tauri stars. Further modelling is required to investigate this issue.
We conclude that our results are entirely consistent with the disks and orbits of HAe/Be binaries being co-planar, and thus with the scenario of binary formation via disk fragmentation. Further spectropolarimetric observations, e.g. provided by SALT, in conjunction with additional high resolution data, e.g. provided by NIR interferometry, are required to increase the sample and conclusively differentiate between aligned and random orientations of disks and binaries.
References
- Akeson et al. (2003) Akeson, R. L., Ciardi, D., & van Belle, G. T. 2003, in SPIE Conf. Ser., ed. W. A. Traub, Vol. 4838, 1037–1042
- Akeson et al. (2002) Akeson, R. L., Ciardi, D. R., van Belle, G. T., & Creech-Eakman, M. J. 2002, ApJ, 566, 1124
- Baines et al. (2004) Baines, D., Oudmaijer, R. D., Mora, A., et al. 2004, MNRAS, 353, 697
- Baines et al. (2006) Baines, D., Oudmaijer, R. D., Porter, J. M., & Pozzo, M. 2006, MNRAS, 367, 737
- Bastien & Menard (1990) Bastien, P. & Menard, F. 1990, ApJ, 364, 232
- Bate et al. (2000) Bate, M. R., Bonnell, I. A., Clarke, C. J., et al. 2000, MNRAS, 317, 773
- Beskrovnaya et al. (1999) Beskrovnaya, N. G., Pogodin, M. A., Miroshnichenko, A. S., et al. 1999, A&A, 343, 163
- Bonnell & Bate (2005) Bonnell, I. A. & Bate, M. R. 2005, MNRAS, 362, 915
- Cidale et al. (2001) Cidale, L., Zorec, J., & Tringaniello, L. 2001, A&A, 368, 160
- Clarke & McLean (1974) Clarke, D. & McLean, I. S. 1974, MNRAS, 167, 27P
- Corder et al. (2005) Corder, S., Eisner, J., & Sargent, A. 2005, ApJL, 622, L133
- Doucet et al. (2006) Doucet, C., Pantin, E., Lagage, P. O., & Dullemond, C. P. 2006, A&A, 460, 117
- Eisner et al. (2004) Eisner, J. A., Lane, B. F., Hillenbrand, L. A., Akeson, R. L., & Sargent, A. I. 2004, ApJ, 613, 1049
- Fedele et al. (2008) Fedele, D., van den Ancker, M. E., Acke, B., et al. 2008, A&A, 491, 809
- Fuente et al. (2006) Fuente, A., Alonso-Albi, T., Bachiller, R., et al. 2006, ApJ, 649, L119
- Goodwin et al. (2007) Goodwin, S. P., Kroupa, P., Goodman, A., & Burkert, A. 2007, in Protostars and Planets V, ed. B. Reipurth, D. Jewitt, & K. Keil, 133–147
- Harrington & Kuhn (2007) Harrington, D. M. & Kuhn, J. R. 2007, ApJL, 667, L89
- Harrington & Kuhn (2009) Harrington, D. M. & Kuhn, J. R. 2009, ApJS, 180, 138
- Herbig (1960) Herbig, G. H. 1960, ApJ Supplement, 4, 337
- Hernández et al. (2004) Hernández, J., Calvet, N., Briceño, C., Hartmann, L., & Berlind, P. 2004, AJ, 127, 1682
- Hillenbrand et al. (1992) Hillenbrand, L. A., Strom, S. E., Vrba, F. J., & Keene, J. 1992, Astrophysical Journal, 397, 613
- Jensen et al. (2004) Jensen, E. L. N., Mathieu, R. D., Donar, A. X., & Dullighan, A. 2004, ApJ, 600, 789
- Kitamura et al. (2002) Kitamura, Y., Momose, M., Yokogawa, S., et al. 2002, ApJ, 581, 357
- Kraus et al. (2008) Kraus, S., Preibisch, T., & Ohnaka, K. 2008, ApJ, 676, 490
- Krumholz et al. (2009) Krumholz, M. R., Klein, R. I., McKee, C. F., Offner, S. S. R., & Cunningham, A. J. 2009, Sci, 323, 754
- Kuhn et al. (2007) Kuhn, J. R., Berdyugina, S. V., Fluri, D. M., Harrington, D. M., & Stenflo, J. O. 2007, ApJL, 668, L63
- Kuhn et al. (2010) Kuhn, J. R., Geiss, B., & Harrington, D. M. 2010, ArXiv e-prints
- Maheswar et al. (2002) Maheswar, G., Manoj, P., & Bhatt, H. C. 2002, A&A, 387, 1003
- Malbet et al. (2005) Malbet, F., Lachaume, R., Berger, J., et al. 2005, A&A, 437, 627
- Mannings & Sargent (1997) Mannings, V. & Sargent, A. I. 1997, ApJ, 490, 792
- Manoj et al. (2007) Manoj, P., Ho, P. T. P., Ohashi, N., et al. 2007, ApJL, 667, L187
- Mathieu et al. (1995) Mathieu, R. D., Adams, F. C., Fuller, G. A., et al. 1995, AJ, 109, 2655
- McLean & Clarke (1979) McLean, I. S. & Clarke, D. 1979, MNRAS, 186, 245
- Moeckel & Bally (2007) Moeckel, N. & Bally, J. 2007, ApJ, 656, 275
- Monin et al. (2006) Monin, J.-L., Ménard, F., & Peretto, N. 2006, A&A, 446, 201
- Monnier et al. (2006) Monnier, J. D., Berger, J.-P., Millan-Gabet, R., et al. 2006, ApJ, 647, 444
- Monnier et al. (2008) Monnier, J. D., Tannirkulam, A., Tuthill, P. G., et al. 2008, ApJL, 681, L97
- Monnier (2005) Monnier, J. D. e. a. 2005, ApJ, 624, 832
- Mottram et al. (2007) Mottram, J. C., Vink, J. S., Oudmaijer, R. D., & Patel, M. 2007, MNRAS, 377, 1363
- Natta et al. (2001) Natta, A., Prusti, T., Neri, R., et al. 2001, A&A, 371, 186
- Okamoto et al. (2009) Okamoto, Y. K., Kataza, H., Honda, M., et al. 2009, ApJ, 706, 665
- Oudmaijer & Drew (1999) Oudmaijer, R. D. & Drew, J. E. 1999, MNRAS, 305, 166
- Patel et al. (2006) Patel, M., Oudmaijer, R. D., Vink, J. S., Mottram, J. C., & Davies, B. 2006, MNRAS, 373, 1641
- Pirzkal et al. (1997) Pirzkal, N., Spillar, E. J., & Dyck, H. M. 1997, ApJ, 481, 392
- Poeckert (1975) Poeckert, R. 1975, ApJ, 196, 777
- Poeckert & Marlborough (1976) Poeckert, R. & Marlborough, J. M. 1976, ApJ, 206, 182
- Preibisch et al. (2006) Preibisch, T., Kraus, S., Driebe, T., van Boekel, R., & Weigelt, G. 2006, A&A, 458, 235
- Rousselet-Perraut et al. (2010) Rousselet-Perraut, K., Benisty, M., Mourard, D., et al. 2010, A&A, 516, L1
- Stecklum et al. (1995) Stecklum, B., Eckart, A., Henning, T., & Loewe, M. 1995, A&A, 296, 463
- Thé et al. (1994) Thé, P. S., de Winter, D., & Perez, M. R. 1994, A&AS, 104, 315
- Thomas et al. (2007) Thomas, S. J., van der Bliek, N. S., Rodgers, B., Doppmann, G., & Bouvier, J. 2007, in IAU Symp, Vol. 240, IAU Symp., ed. W. I. Hartkopf, E. F. Guinan, & P. Harmanec, 250–253
- Tody (1993) Tody, D. 1993, in A.S.P. Conf.Ser., Vol. 52, Astronomical Data Analysis Software and Systems II, ed. R. J. Hanisch, R. J. V. Brissenden, & J. Barnes, 173–183
- Vink et al. (2002) Vink, J. S., Drew, J. E., Harries, T. J., & Oudmaijer, R. D. 2002, MNRAS, 337, 356
- Vink et al. (2005a) Vink, J. S., Drew, J. E., Harries, T. J., Oudmaijer, R. D., & Unruh, Y. 2005a, MNRAS, 359, 1049
- Vink et al. (2005b) Vink, J. S., Harries, T. J., & Drew, J. E. 2005b, A&A, 430, 213
- Vink et al. (2005c) Vink, J. S., O’Neill, P. M., Els, S. G., & Drew, J. E. 2005c, A&A, 438, L21
- Waters & Waelkens (1998) Waters, L. B. F. M. & Waelkens, C. 1998, ARA&A, 36, 233
- Weigelt et al. (2002) Weigelt, G., Balega, Y. Y., Hofmann, K.-H., & Preibisch, T. 2002, A&A, 392, 937
- Wheelwright et al. (2010) Wheelwright, H. E., Oudmaijer, R. D., & Goodwin, S. P. 2010, MNRAS, 401, 1199
- Wolf et al. (2001) Wolf, S., Stecklum, B., & Henning, T. 2001, in IAU Symp., Vol. 200, The Formation of Binary Stars, ed. H. Zinnecker & R. Mathieu, 295–304
- Zinnecker & Yorke (2007) Zinnecker, H. & Yorke, H. 2007, ARA&A, 45, 481
Appendix A Observed spectropolarimetric signatures
Here we present the spectropolarimetric signatures of the entire sample over H. Figure 5 presents the signatures in terms of the total flux, the amount of polarisation and the polarisation angle over the H line. The diagrams of MWC 1080 and MWC 147, objects which display a spectropolarimetric signature that was not presented in the main body of the paper, are presented in Figure 6.

|
|
|
|
|
|
|

|
|
|
|
|
 |
 |