X-ray spectral evolution in the ultraluminous X-ray source M33 X-8
Abstract
The bright ultraluminous X-ray source (ULX), M33 X-8, has been observed several times by XMM-Newton, providing us with a rare opportunity to ‘flux bin’ the spectral data and search for changes in the average X-ray spectrum with flux level. The aggregated X-ray spectra appear unlike standard sub-Eddington accretion state spectra which, alongside the lack of discernible variability at any energy, argues strongly against conventional two-component, sub-Eddington models. Although the lack of variability could be consistent with disc-dominated spectra, sub-Eddington disc models are not sufficiently broad to explain the observed spectra. Fits with a Eddington accretion rate slim disc model are acceptable, but the fits show that the temperature decreases with flux, contrary to expectations, and this is accompanied by the appearance of a harder tail to the spectrum. Applying a suitable two-component model reveals that the disc becomes cooler and less advection dominated as the X-ray flux increases, and this is allied to the emergence of an optically-thick Comptonisation medium. We present a scenario in which this is explained by the onset of a radiatively-driven wind from the innermost regions of the accretion disc, as M33 X-8 exceeds the Eddington limit. Furthermore, we argue that the direct evolution of this spectrum with increasing luminosity (and hence radiation pressure) leads naturally to the two-component spectra seen in more luminous ULXs.
keywords:
accretion, accretion discs – X-rays: binaries – X-rays: individual: M33 X-81 Introduction
| OBSID | obs. date | useful exposure | off-axis angle | net count rate | total counts | bin | |
| (ks, MOS1) | (arcmin) | () | (ct s-1, MOS1) | ||||
| 0102640101 | 2000-08-04 | 8.2 | 1.2 | 1.84 | 30000 | Medium | |
| 0102640301 | 2000-08-07 | 5.3 | 13.9 | 0.69 | 7500 | Medium | |
| 0102641001 | 2001-07-08 | 8.7 | 10.5 | 0.88 | 14500 | Low | |
| 0102642001 | 2001-08-15 | 10.7 | 14.1 | 0.61 | 13000 | Medium | |
| 0102642101 | 2002-01-25 | 12.2 | 10.7 | 0.96 | 22600 | Medium | |
| 0102642301 | 2002-01-27 | 12.2 | 8.7 | 1.05 | 24300 | Low | |
| 0141980501 | 2003-01-22 | 3.5 | 1.1 | 1.11 | 6800 | Low | |
| 0141980601 | 2003-01-23 | 12.8 | 14.1 | 0.63 | 16600 | High | |
| 0141980401 | 2003-01-24 | 7.2 | 12.7 | 0.77 | 12200 | High | |
| 0141980801 | 2003-02-12 | 12.6 | 1.2 | 1.33 | 26800 | Low | |
| 0141980101 | 2003-07-11 | 6.1 | 10.6 | 0.88 | 10600 | Low | |
| 0141980301 | 2003-07-25 | —– |
Notes: The observation date is given in year-month-day format. The observed flux, , the background-subtracted net count rate and the total source counts (sum of MOS1 + MOS2) are in the 0.3 – 10 keV range. OBSID 0141980301 had no MOS observations and was excluded.
Ultra-luminous X-ray sources (ULXs) are point-like objects with high (1039 erg s-1) X-ray luminosities that are not associated with an active galactic nucleus (AGN) or, indeed, the central regions of a host galaxy (see Miller & Colbert 2004; Roberts 2007; Gladstone 2011). The nature of these objects has been the subject of much speculation, with CCD resolution X-ray spectroscopy playing a major role in advancing our understanding. Although other missions have played an important part (e.g. ASCA detection of possible state transitions in ULXs, Kubota et al. 2001), these results have predominantly come from the XMM-Newton mission. Its first major advance was the detection of a soft excess in the spectra of many ULXs, with a temperature consistent with that expected for the inner edge of an accretion disc around an intermediate-mass black hole (IMBH; e.g. Miller et al. 2003; Miller, Fabian & Miller 2004). However, later studies showed that the second, harder component in these spectra turns over within the XMM-Newton bandpass, and so appears much cooler and optically thicker than the corresponding Comptonisation media in Galactic black holes (Stobbart et al. 2006). This is inconsistent with the identification of a sub-Eddington state for an IMBH, and more indicative of super-Eddington accretion onto a stellar-mass black hole (Gladstone, Done & Roberts 2009). The apparent divergence of the spectra of more luminous ULXs into two components (see Fig. 8 of Gladstone et al. 2009) can be interpreted in terms of the emergence of a radiatively-driven wind at super-Eddington accretion rates, with the outflowing material thermalising the underlying disc emission to produce the soft spectral component as predicted by e.g. King (2004), Poutanen et al. (2007). The hard component is then produced within the photospheric radius, with its characteristic optically-thick Comptonisation signature either the result of a thick shroud of Comptonising electrons around the hot inner disc, or perhaps a change in the opacity of the outer layers of the hot inner accretion disc itself (Middleton et al. 2011). Such a model can explain the startling lack of variability seen in many of these sources (Heil et al. 2009). In those few cases where large amounts of variability can be seen, it is likely that the angle of observation coincides with the edge of the turbulent photosphere, adding extrinsic variability to the X-ray signal (Middleton et al. 2011).
Thus it appears that high quality X-ray spectroscopy of ULXs is consistent with many of the characteristics predicted for super-Eddington accretion (e.g. Begelman et al. 2006; Poutanen et al. 2007; Mineshige & Ohsuga 2011). However, there is a sub-class of ULXs with luminosities close to , that do not show the spectral inflection at keV indicative of the two-component spectra in more luminous ULXs, including several objects in the sample of Gladstone et al. (2009, Fig. 8, top row). Their spectra are instead well-described by a single thermal component of emission. Understanding the nature of this emission and how it fits into the broader picture of ULX X-ray spectra is important as it may provide a link between mass accretion rates at Eddington through to super- and hyper-Eddington rates. A prime method for investigating this is to observe the evolution of X-ray spectra with luminosity for these objects. Such studies have been undertaken for a number of more luminous ULXs on the basis of data from Chandra (e.g. Roberts et al. 2006), Swift (e.g. Vierdayanti et al. 2010; Kong et al. 2010) and XMM-Newton (e.g. Feng & Kaaret 2006; Feng & Kaaret 2009), yielding important insights including the demonstration that the temperature-luminosity relation for the soft excess is indicative of the presence of a wind-driven photosphere, rather than a standard accretion disc around an IMBH (Kajava & Poutanen 2009). However, spectral evolution studies for less luminous ULXs are less numerous, and can suffer from moderate data quality (e.g. four objects described by a simple multi-colour disc model in Kajava & Poutanen 2009).
An obvious means of increasing our understanding of these objects is to study the brightest example, M33 X-8. This is the closest established ULX, long known as the brightest persistent X-ray source in the Local Group (Long et al. 1981; Gottwald, Pietsch & Hasinger 1987). It is also one of only two ULXs (with M82 X-1) whose flux regularly exceeds in the XMM-Newton bandpass, and so has been the subject of many studies (e.g. Dubus, Charles & Long 2004; La Parola et al. 2003; Parmar et al. 2001; Takano et al. 1994). It has been observed on several occasions with the EPIC instruments on XMM-Newton (see e.g. Foschini et al. 2004; 2006). However, due to the moderate statistical quality of individual observations it has not been possible to constrain changes to the X-ray spectrum between observations (Weng et al. 2009). Here we present a flux binned analysis that shows that the X-ray spectrum of M33 X-8 does alter subtly with luminosity, and has a luminosity dependence that is consistent with the picture of ULX spectral evolution in the super-Eddington regime.
 |
2 Data analysis
The EPIC instruments on-board XMM-Newton observed M33 X-8 on 12 occasions of varying durations during the early years of the mission (see Table 1 for details on each of these)111New, deep observations were obtained in the summer of 2010 that are not public at the time of writing.. As the source is often not visible in the PN observations (as it lies off the edge of the chip) we restricted ourselves to using only the MOS data. The data were initially cleaned using standard procedures. Good time interval files were created from the keV full-field light curves of each observation by removing periods with a raised background count rate, and used to filter subsequent data extractions.
Where the source itself appeared in the outer MOS chips we used circular data extraction apertures of 45 arcsecond radius for both source and background extractions, and in the three cases where the source is on-axis (OBSIDs: 0102640101, 0141980501 and 0141980801 respectively) we instead use 30 arcsecond radius regions. We proceeded to filter the data using sas v10 and extracted source and background spectra and lightcurves over standard event patterns ( 12) and flags (= 0). The background subtracted 0.3 – 10 keV count rate is given in Table 1 and suggests that there may be slight pile-up in OBSIDs 0141980501 and 0141980801 (note that OBSID 0102640101 was taken in small window mode, and therefore does not suffer from pile-up at these count rates). However, inspection of the patterns using the sas tool epatplot showed that this is not significant in the MOS1 and only marginally significant for double patterns in the MOS2 observations and as such should not impact a combined spectrum where the small effect is considerably diluted.
The crude individual spectra appear to be well described by a single component with a quasi-thermal shape. To obtain flux estimates for each observation, we model the MOS1 and MOS2 spectral data with a simple thermal continuum (absorbed nthcomp) together with the cflux model in xspec, which provides an error range on the flux based on the data uncertainty. We achieve good or acceptable fits to each of the individual observation datasets and obtain the absorbed fluxes given in Table 1. From the observed distribution of fluxes we break the observations into 3 classes: low, medium and high flux levels. Assuming a distance of 817 kpc to M33, consistent with recent X-ray surveys of the galaxy (e.g. Tüllmann et al. 2011), these bins correspond to observed luminosities of (low flux bin), (medium flux bin), and (high flux bin). Using the ftool addspec we proceed to co-add the respective datasets (spectra and response matrices) and obtain a MOS1 and MOS2 dataset for each flux bin.
As our selection of flux bin limits is somewhat arbitrary, we repeat the model dependent analyses reported in Section 3 on rebinned data, where the highest flux observation of the low and medium flux bins was promoted into the next highest bin. In all cases we find behaviour consistent with the results reported below, indicating our results are not simply an artefact of the flux bins used.
The total aggregated counts for each observation are given in Table 1 and, whilst the dispersion in the co-added data will be affected by the weighted differences between the observations, the data quality overall is very good for the low and medium flux bins (totals of and 53000 counts respectively). The data quality for the high flux bin is somewhat poorer ( counts), but still a substantial improvement on most ULX datasets in the XMM-Newton archive, and sufficient to constrain the spectra and draw conclusions on spectral variability in M33 X-8.
3 flux binned spectroscopy
An initial inspection of the data using simple empirical models demonstrated that M33 X-8 does indeed display spectral variability between the flux binned datasets (which can be trivially confirmed by inspection of both Tables 2 & 3, and Figures 2 & 3). Here, we focus on how the spectra evolve with luminosity, and analyse this evolution in light of a range of physical assumptions and models.
3.1 Sub-Eddington models
Several authors have used the high luminosity of ULXs to claim the presence of an intermediate-mass black hole (500 M⊙, e.g. Kaaret et al. 2003; Miller et al. 2003; Miller, Fabian & Miller 2004), which must imply sub-Eddington mass accretion rates. In black hole X-ray binaries such states are characterised by a two-component model of optically thick disc emission (Shakura & Sunyaev 1973) and Comptonisation (see the reviews of McClintock & Remillard 2006; Done, Gierliński & Kubota 2007). We test this assertion by applying a model containing both of these components together with neutral absorption and a constant to account for the differences between the detectors (in xspec: constant*tbabs*(diskbb+comptt))222In these and all subsequent fits a constant component is utilised. It is fixed for MOS1, and the MOS2 value never deviates by more than . A Galactic column of in the direction of M33 (Kalberla et al. 2005) is assumed, and used as the lower bound in fitting the absorption component.. Whilst Table 2 shows this model provides an acceptable fit to the data in all three cases, the characteristic temperature of the high energy tail is 1.2 – 1.4 keV and so is inconsistent with the high coronal temperatures seen in sub-Eddington XRB spectra (indicated by the unbroken power-law continua out to keV, see e.g. McClintock & Remillard 2006; although see e.g. Zdziarski et al. 2005 for the ULX-like behaviour of GRS 1915+105). We confirm this physical difference by fixing the plasma temperature at 50 keV in our models, and measuring the resulting change in fit quality. In all three cases the fit is poorer with a hot corona, by of 134, 42 and 15 respectively for one more degree of freedom. This shows that a cool corona provides a 99.98% improvement according to the F-test for the high flux bin, and a substantially more significant improvement for the other bins, compelling evidence that the corona does not appear similar to that in standard sub-Eddington states.
| Flux bin | Low | Medium | High |
|---|---|---|---|
| tbabs*(diskbb+comptt) | |||
| 0.069 | 0.080 | 0.081 | |
| (keV) | 0.29 | 0.66 | 0.67 |
| (keV) | 1.40 | 1.27 | 1.40 |
| 9.18 | |||
| (d.o.f.) | 689.8 (655) | 654.9 (614) | 521.9 (478) |
| Null P | 0.17 | 0.12 | 0.08 |
| tbabs*kerrbb | |||
| 0.052 | 0.072 | 0.067 | |
| 0.50 | 0.42 | 0.42 | |
| (d.o.f.) | 1080.1 (655) | 717.3 (614) | 570.6 (478) |
| Null P | 2.0 10-23 | 2.010-3 | 2.010-3 |
Notes: Best-fitting parameters for the two sub-Eddington models used. The units of the foreground column, NH, are 1022 cm-2. is the temperature of the inner edge of the accretion disc, and and are the temperature and optical depth of the Comptonising medium. is the dimensionless spin parameter and is the ‘effective’ mass accretion rate of the relativistically-smeared accretion disc (with the latter in units of 1018 g s-1), assuming zero torque at the inner boundary. The table also shows the values for and the number of degrees of freedom for each model, and the null hypothesis probability for this model being an acceptable fit to the data.
Additionally, the Compton tail in a sub-Eddington state is highly variable on short timescales providing an unambiguous test for such a model. We characterise the variability using the excess rms of the 3 – 10 keV lightcurve in each flux bin (binned to 250 s), i.e. the variability above the Poisson (white) noise level of the lightcurve (see Edelson et al. 2002). We find that there is no constrained variability above 3 keV with 3 upper limits of 9%, 8% and 11% for the three flux bins respectively. This strongly argues against a two-component sub-Eddington model for the data. Indeed, we note that the combination of a hot disc (in 2/3 fits), and a cool, optically thick and invariant corona, demonstrates that this ULX cannot be described by the cool disc plus power-law continuum toy model previously used to infer IMBHs in ULXs.
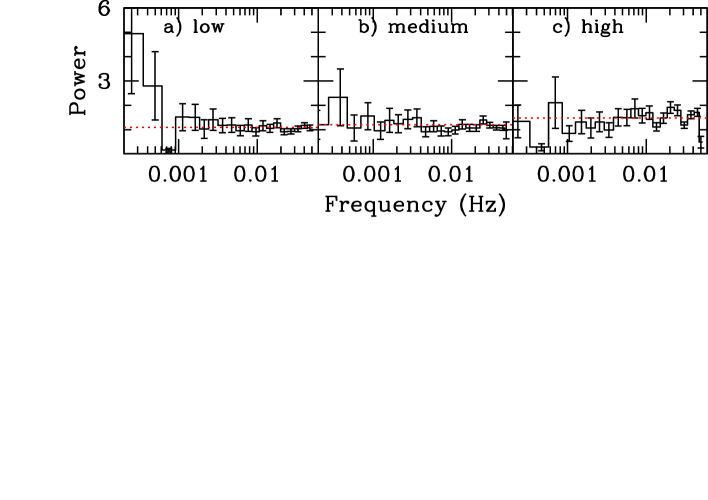
If the data were to be described solely by disc emission then we would not expect there to be any variability on anything other than the longest timescales (Wilkinson & Uttley 2009). As we have substantial evidence against the two-component sub-Eddington model and are now interested in the variability behaviour of the emission as a whole, we extract the Fourier-frequency dependent power density spectra (PDS) over the full energy bandpass. Weng et al. (2009) report the lack of high frequency variability in the individual observations. Here however, we can extend this to longer timescales by selecting the shortest segment of continuous lightcurve and taking integer number of intervals of this length across the remaining observations. This can require certain finessing to obtain the maximum amount of available data and broadest frequency bandpass (as this goes from 1/[longest available individual segment length] to 1/[2 bin size]). In Figure 1 we present the average power density spectrum (PDS - extracted using the ftool powspec) for each flux bin, normalised to rms2 units following geometrical re-binning with white noise included. Quite clearly there is no constrained variability over any of the available frequency bins, consistent with the source having suppressed red noise as seen in a handful of ULXs (Heil et al. 2009), and the emission originating in the accretion disc.
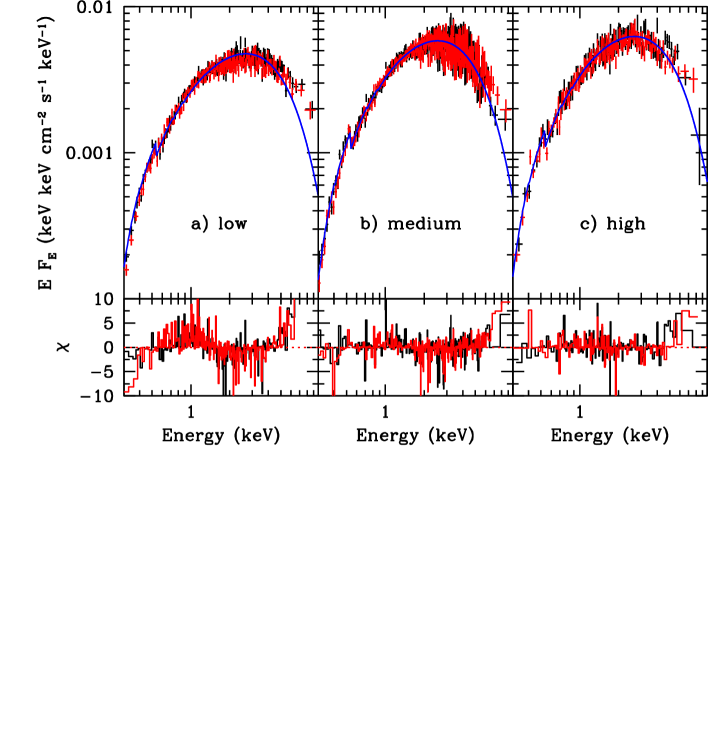
However, a thin disc is a poor description of the spectral data as the Wien tail is not broad enough to fit the high energy emission, leading to poor fits ( of 1441.5/658, 931.4/617 and 650.7/481 for an absorbed multi-colour disc blackbody spectrum – diskbb in xspec – fit to each flux bin respectively). Disc emission that has been smeared by relativistic effects is considerably broader and so we also fitted the spectral data with the xspec model constant*tbabs*kerrbb. The data and best fitting models are shown in Figure 2, and the fit parameters are detailed in Table 2. Even in this extremely relativistically broadened case we still find the models poorly describe the data, with obvious excesses above the model at high energies. It would therefore appear that none of the sub-Eddington models can describe both the broad shape of the spectra and also the lack of high energy variability.
 |
3.2 Eddington to super-Eddington models
Examples of Eddington accretion rates (i.e. accretion rates closely approximating those expected at the Eddington limit for an object) have been inferred in the outburst of several Galactic X-ray binaries, for example V404 Cyg (Życki, Done & Smith 1999), V4641 Sgr (Revnivtsev et al. 2002) and the neutron star system Cir X-1 (Done & Gierliński 2003). However, ULXs are observed to be persistently luminous, which would suggest a closer analogy to a long-lived outburst system such as GRS 1915+105 (see Remillard & McClintock 2006), although this source is also known to undergo dramatic state changes on short timescales (e.g. Belloni et al. 2000; Middleton et al. 2006).
Taking a theoretical approach, we would expect that, as the Eddington limit is neared, the properties of the flow through the disc would change as advection becomes more important as a method for removing energy from the flow (Mineshige et al. 2000; Abramowicz et al. 1988). We would also expect that, where the flow is highly illuminated, material would be driven off the disc surface by radiation pressure, with the massive outflow forming a photosphere above the disc (see Poutanen et al. 2007). This should modify the shape of the continuum emission via absorption, emission and scattering, producing a fully thermalised, blackbody-like component. Here however, the spectral shape of M33 X-8 is unlikely to be described solely by a photosphere covering a hot disc, as the peak temperatures of the observed spectra are implausibly high for a pure photosphere (c.f. King 2004).
| Flux bin | Low | Medium | High |
|---|---|---|---|
| tbabs*diskpbb | |||
| 0.172 | 0.148 | 0.151 | |
| (keV) | 1.90 | 1.42 | 1.51 |
| 0.52 | 0.56 | 0.56 | |
| (d.o.f.) | 699.10 (657) | 667.5 (616) | 532.1 (480) |
| Null P | 0.12 | 0.07 | 0.05 |
| tbabs*(diskpbb+comptt) | |||
| 0.160 | 0.115 | 0.099 | |
| (keV) | 1.22 | 0.93 | 0.70 |
| 0.54 | 0.62 | 0.68 | |
| (keV) | 1.67 | 1.52 | |
| 9.63 | 10.19 | ||
| (d.o.f.) | 691.0 (654) | 651.4 (613) | 521.6 (477) |
| Null P | 0.15 | 0.14 | 0.08 |
Notes: Best-fitting parameters for the Eddington and/or super-Eddington models. Here is the dimensionless index of the radial temperature dependence of an advection dominated slim disc (see text), and the other variables are as per Table 2.
 |
We therefore arrive at the model of an advection-dominated Eddington ‘slim’ disc (Mineshige et al. 2000). Several authors (Foschini et al. 2006; Weng et al. 2009) have shown this model to be a reasonable description of the moderate signal-to-noise data of individual observations, with a reported requirement for an additional soft power-law continuum to high energies in some cases. Here however, we fit the flux binned data with an absorbed -free disc model (constant*tbabs*diskpbb in xspec), where the index of the temperature profile is a free parameter ( for disc temperature and radius ). Such a model has been used as evidence for slim disc spectra in ULXs, as a predicted change in the profile from for standard discs to for slim discs is indeed seen in some objects (e.g. Vierdayanti et al. 2006; although also see Gladstone et al. 2009). The best-fit parameters and their 90% confidence limits are shown in Table 3. The model provides a very acceptable description of the low and medium flux binned datasets, and the peak temperature is constrained to drop with the increase in flux. The model is a poorer, although still marginally adequate description of the high flux data; however its parameters are not significantly different from the medium flux bin.
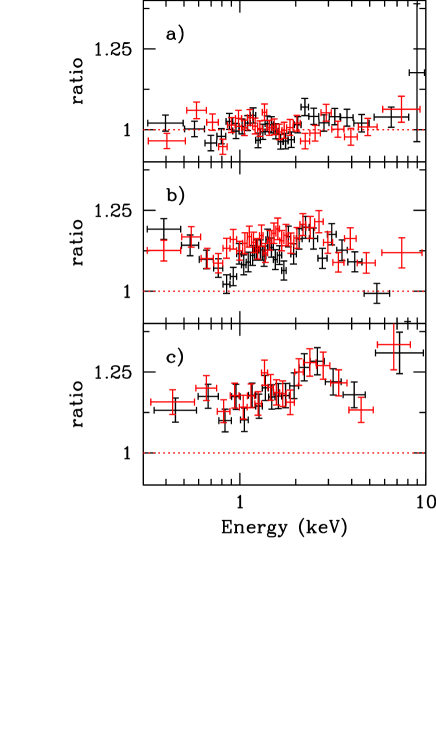
Although a slim disc by its very definition does not follow the same radial temperature profile as the standard thin disc (Shakura & Sunyaev 1973), we would not expect the temperature of the inner edge to drop with increasing flux unless the radius had moved substantially outwards (contrary to what is seen in Galactic black hole X-ray binaries). Similarly, we would not expect the index of the radial temperature dependence to increase significantly with flux either. We can see from Table 3 that the temperature drops by more than 0.3 keV yet the value increases significantly. Thus the change here is contrary to what we would expect for an advection-dominated Eddington flow. However, the decrease in temperature of the peak of the emission could be explained by the inclusion of a flux-dependent cooling mechanism. In particular, cooling could occur via the launching of a wind, and Comptonisation in the optically thick plasma of the outflowing material. In Eddington/super-Eddington flows, the launching of material is dominated by the radiation pressure (as the effective gravity goes as 1-L/LEdd) and so one would expect to see its effect increase with luminosity. Hence, in terms of the spectral evolution, we might expect to see both the disc cool, and an optically-thick Comptonisation medium emerge, with increased luminosity. We illustrate what the data shows in Figure 3, where we show the spectral residuals for each dataset compared to the best fitting model for the absorbed -free disc model in the lowest flux bin (cf. also Table 3). This shows that, besides the expected change in the flux level, we also see changes in the shape of the continuum with flux. In particular, a component with turnover in the 2 – 3 keV range appears in the medium flux bin spectrum, and appears more pronounced in the high flux bin.
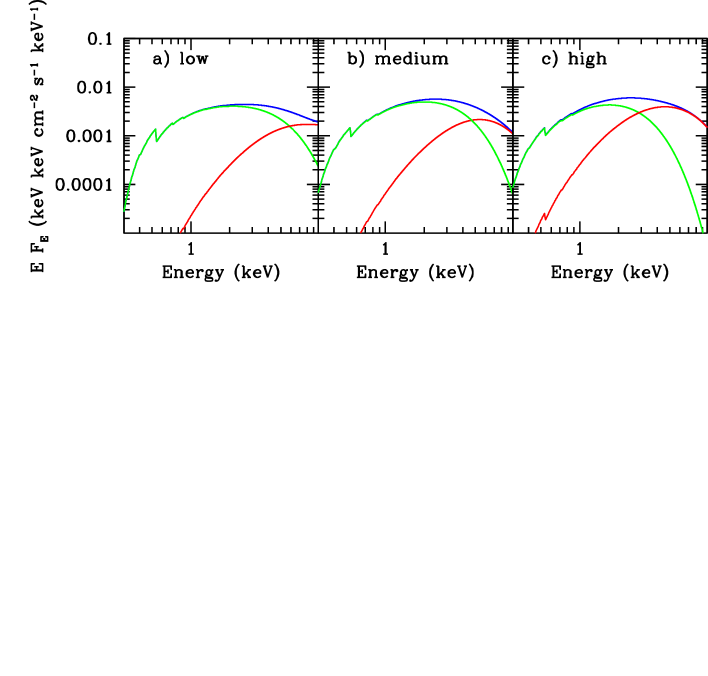
We attempt to model this by introducing a Compton tail to the model (using the comptt model, such that we employed a constant*tbabs*(diskpbb+comptt) model in xspec) with the seed photons drawn from the soft component in order to provide a physically limiting case and allow the spectral parameters to be constrained. In the case of the medium flux binned dataset the fit is notably improved by this additional component ( of 16 for 3 d.o.f.s), and it is also marginally improved in the high flux binned dataset ( of 11 for 3 d.o.f.s). Although we would expect the slim disc emission to dominate at lower luminosities we also fit this model to the low flux binned data. We obtain only a slightly improved fit ( of 8 for 3 d.o.f.s) and, as expected, the disc dominates the spectrum with only a small contribution to the higher energy emission made via Comptonisation. In order to realistically constrain the properties of the best-fitting two component model, we freeze each best-fitting component in turn and determine 90% error limits on the model parameters. The resulting fit parameters and errors are presented in Table 3. They suggest that, as the luminosity of M33 X-8 increases, the soft component decreases in temperature and becomes less advection-dominated whilst the hard component becomes stronger and cooler. A plot of the evolution of the best-fitting models is shown in Figure 4. As a consistency check we apply these best-fitting models to each of the individual observations of M33 X-8 in each bin and, in every case, find a good or acceptable fit to the data.
 |
4 Discussion & Conclusion
Assuming that the population of ULXs contain stellar mass black holes rather than IMBHs, their spectral evolution should provide the much sought-after explanation for the changing structure of the accretion flow at and above the Eddington limit. This requires repeat observations of bright ULXs at different luminosities. Whilst the relatively large amounts of data from M33 X-8 have been analysed by other authors (e.g. Weng et al. 2009, La Parola et al. 2003, etc), it has not previously been flux binned in an overt attempt to identify spectral evolution. Using this method, we have been able to test models for the spectral behaviour of this source. We argue strongly against a sub-Eddington two-component description, particularly one describing ULXs as IMBHs, based on the shape of and lack of variability in the harder spectral component, that results from Comptonisation. The average PDS of each flux bin further constrained the source’s properties and showed that, across the full energy bandpass, there is no constrained variability above the white noise at any frequency. Whilst this could imply that the spectrum is dominated by stable emission from a disc, we show that neither a standard nor a relativistically broadened thin (sub-Eddington) disc is a suitable description of the data.
Given the source luminosity of 1-21039 erg s-1, Eddington mass accretion rates are easily satisfied by a black hole mass of 10M⊙, consistent with the masses of Galactic black holes. We find that an Eddington slim disc provides a good description of the data with constrained differences in the temperatures and radial emission profiles of the low and medium flux binned data. However, these differences are inconsistent with the expected characteristics of disc accretion, and instead imply the presence of an additional cooling mechanism. Subtle changes in the spectra of the medium and high flux binned states, compared to the low flux state, are well modelled by including a Comptonised component.
M33 X-8, then, turns out to be a crucial object for furthering our understanding of accretion at Eddington and super-Eddington rates. At its lower fluxes it appears well described by a slim disc model alone; however as its flux increases, an optically-thick Comptonisation media becomes more important, in effect ‘stretching’ the disc-like spectrum by cooling the disc component, and simultaneously providing a harder, upscattered, spectral component. This is crucial because it appears to reflect the initial stages of the divergence of the ULX spectra we see at higher luminosities, where the spectra are well-modelled by a cool, disc-like component and a harder, optically-thick Comptonisation component (Gladstone et al. 2009). If so, it is likely the result of the emergence of the expected radiatively-driven wind.
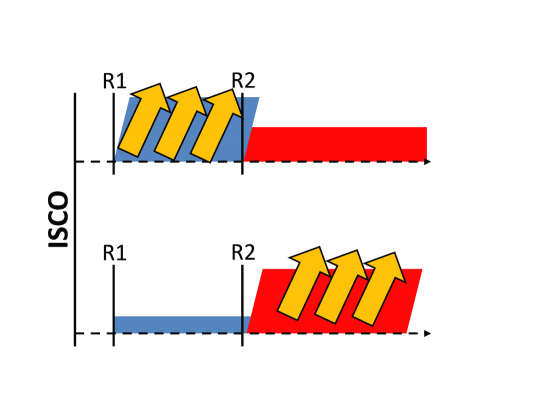
We sketch a toy model of a possible physical scenario to explain both this initial wind emergence phase, and the higher luminosity photosphere phase in Figure 5. In the top panel, the accretion rate is only just entering the Eddington regime. Here, the soft component is the outer, advection-dominated slim disc, which extends down to some radius (given as R2 in Figure 5). Within this radius the accretion flow is highly illuminated and we see the emergence of outflowing winds down to some radius close to the innermost stable circular orbit (ISCO) beyond which we expect the flow to become highly turbulent (possibly producing the expected, as yet unobserved, high energy, optically thin component). The unbound plasma in the wind Comptonises the underlying hotter disc photons, producing the hard component in the spectrum. As the luminosity increases, winds may be driven from further out, whereas closer in, the wind may become increasingly mass loaded as bound material at lower luminosities may now be lifted from the ‘surface’ of the disc. This further cools the underlying accretion flow leading to a cooler peak in the hard spectral component. In addition, the soft component is now cut off at a larger radius and so peaks at a lower temperature as well as being less advection dominated (due to being further out in the gravitational potential of the BH). This scenario qualitatively matches the implied behaviour of M33 X-8. The key remaining issue is then how this scenario relates to the spectra seen for more luminous ULXs. We emphasise that in this toy model, as the X-ray luminosity increases we would expect to see the wind being driven from increasingly further out from the ISCO. Eventually this would leave little or no disc emission beyond the outer launching radius, as the very massive wind would extend over most of the hot (X-ray emitting) regions of the disc and fully thermalise the underlying disc photons, producing the soft excess seen in ULX spectra. However, we would also expect to see ‘bare’ disc emission from within the inner launching radius of the wind (the photospheric radius) where the local gravity is so low that the radiation pressure has ‘blown’ the excess material away, leaving an approximate hot thin disc. The thermal Comptonisation spectrum then originates either in a corona of hot electrons tightly bound to the upper layers of the accretion disc; or perhaps is the spectrum of the accretion disc itself, as its opacity would alter at the high temperatures within the photospheric radius. This scenario is shown in the bottom panel of Fig. 5, and can explain the spectral properties of the more luminous ULXs seen to have clear two-component spectra (see Fig. 8 Gladstone et al. 2009, also Middleton et al. 2011). In these cases the wind/photosphere emission is thermally decoupled from the inner disc emission and so the relative amounts of hard/soft emission are most likely degenerate in inclination angle and mass accretion rate.
 |
This model can also consistently explain the associated variability properties of ULXs as in all cases the spectral components in the X-ray bandpass are stable (although we predict that at higher energies there is likely to be an optically thin, highly variable component as seen in Galactic black hole binaries). However, if our line-of-sight intercepts the launching region of the photosphere at high luminosities where the wind is in the outer rather than inner disc, then we expect this extrinsic variability to lead to the hard component being highly variable (e.g. NGC 5408 X-1: Middleton et al. 2011).
Hence, by examining how the X-ray spectral and timing properties of the nearest ULX vary with source flux, we have shown that it is consistent with the picture of a source accreting at the threshold of the super-Eddington regime. As its luminosity increases, it begins to betray the signature of a possible outflow from its central regions. This may be the emergence of the outflow that appears to dominate the characteristics of ULXs at higher luminosities. This work shows the power of considering both spectral and timing data, using the highest quality datasets available from XMM-Newton. Clearly, if we are to develop a deeper understanding of how ULXs work, and further investigate this picture of objects dominated by a radiatively-driven wind, obtaining an increased number of similar datasets must be a priority for this and future missions.
5 Acknowledgements
We thank the anonymous referee for their useful suggestions. MM and TR thank STFC for support in the form of a standard grant, and AS similarly thanks STFC for support via a PhD studentship. This work is based on observations obtained with XMM-Newton, an ESA science mission with instruments and contributions directly funded by ESA Member States and NASA.
References
- [\citeauthoryearAbramowicz et al.1988] Abramowicz M. A., Czerny B., Lasota J. P., Szuszkiewicz E., 1988, ApJ, 332, 646
- [\citeauthoryearBegelman, King, & Pringle2006] Begelman M. C., King A. R., Pringle J. E., 2006, MNRAS, 370, 399
- [\citeauthoryearBelloni et al.2000] Belloni T., Klein-Wolt M., Méndez M., van der Klis M., van Paradijs J., 2000, A&A, 355, 271
- [\citeauthoryearDone & Gierliński2003] Done C., Gierliński M., 2003, MNRAS, 342, 1041
- [\citeauthoryearDone, Gierliński, & Kubota2007] Done C., Gierliński M., Kubota A., 2007, A&ARv, 15, 1
- [\citeauthoryearDubus, Charles, & Long2004] Dubus G., Charles P. A., Long K. S., 2004, A&A, 425, 95
- [\citeauthoryearEdelson et al.2002] Edelson R., Turner T. J., Pounds K., Vaughan S., Markowitz A., Marshall H., Dobbie P., Warwick R., 2002, ApJ, 568, 610
- [\citeauthoryearFeng & Kaaret2006] Feng H., Kaaret P., 2006, ApJ, 650, L75
- [\citeauthoryearFeng & Kaaret2009] Feng H., Kaaret P., 2009, ApJ, 696, 1712
- [\citeauthoryearFoschini et al.2004] Foschini L., Rodriguez J., Fuchs Y., Ho L. C., Dadina M., Di Cocco G., Courvoisier T. J.-L., Malaguti G., 2004, A&A, 416, 529
- [\citeauthoryearFoschini et al.2006] Foschini L., et al., 2006, AdSpR, 38, 1378
- [\citeauthoryearGladstone2011] Gladstone J. C., 2011, arXiv, arXiv:1101.5387
- [\citeauthoryearGladstone, Roberts, & Done2009] Gladstone J. C., Roberts T. P., Done C., 2009, MNRAS, 397, 1836
- [\citeauthoryearGottwald, Pietsch, & Hasinger1987] Gottwald M., Pietsch W., Hasinger G., 1987, A&A, 175, 45
- [\citeauthoryearHeil, Vaughan, & Roberts2009] Heil L. M., Vaughan S., Roberts T. P., 2009, MNRAS, 397, 1061
- [\citeauthoryearKaaret et al.2003] Kaaret P., Corbel S., Prestwich A. H., Zezas A., 2003, Sci, 299, 365
- [\citeauthoryearKajava & Poutanen2009] Kajava J. J. E., Poutanen J., 2009, MNRAS, 398, 1450
- [\citeauthoryearKalberla et al.2005] Kalberla P. M. W., Burton W. B., Hartmann D., Arnal E. M., Bajaja E., Morras R., Pöppel W. G. L., 2005, A&A, 440, 775
- [\citeauthoryearKing2004] King A. R., 2004, NuPhS, 132, 376
- [\citeauthoryearKong et al.2010] Kong A. K. H., Yang Y. J., Yen T.-C., Feng H., Kaaret P., 2010, ApJ, 722, 1816
- [\citeauthoryearKubota et al.2001] Kubota A., Mizuno T., Makishima K., Fukazawa Y., Kotoku J., Ohnishi T., Tashiro M., 2001, ApJ, 547, L119
- [\citeauthoryearLa Parola et al.2003] La Parola V., Damiani F., Fabbiano G., Peres G., 2003, ApJ, 583, 758
- [\citeauthoryearLa Parola et al.2001] La Parola V., Peres G., Fabbiano G., Kim D. W., Bocchino F., 2001, ApJ, 556, 47
- [\citeauthoryearLong et al.1981] Long K. S., Dodorico S., Charles P. A., Dopita M. A., 1981, ApJ, 246, L61
- [\citeauthoryearMcClintock & Remillard2006] McClintock & Remillard, 2006, In Compact Stellar X-ray Sources, ed. WHG Lewin, M van der Klis, pp. 157. Cambridge: Cambridge University Press
- [\citeauthoryearMiddleton et al.2006] Middleton M., Done C., Gierliński M., Davis S. W., 2006, MNRAS, 373, 1004
- [\citeauthoryearMiddleton et al.2011] Middleton M. J., Roberts T. P., Done C., Jackson F. E., 2011, MNRAS, 411, 644
- [\citeauthoryearMiller & Colbert2004] Miller M. C., Colbert E. J. M., 2004, IJMPD, 13, 1
- [\citeauthoryearMiller et al.2003] Miller J. M., Fabbiano G., Miller M. C., Fabian A. C., 2003, ApJ, 585, L37
- [\citeauthoryearMiller, Fabian, & Miller2004] Miller J. M., Fabian A. C., Miller M. C., 2004, ApJ, 607, 931
- [\citeauthoryearMineshige et al.2000] Mineshige S., Kawaguchi T., Takeuchi M., Hayashida K., 2000, PASJ, 52, 499
- [\citeauthoryearMineshige & Ohsuga2011] Mineshige S., Ohsuga K., 2011, AN, 332, 402
- [\citeauthoryearParmar et al.2001] Parmar A. N., et al., 2001, A&A, 368, 420
- [\citeauthoryearPoutanen et al.2007] Poutanen J., Lipunova G., Fabrika S., Butkevich A. G., Abolmasov P., 2007, MNRAS, 377, 1187
- [\citeauthoryearRemillard & McClintock2006] Remillard R. A., McClintock J. E., 2006, ARA&A, 44, 49
- [\citeauthoryearRevnivtsev et al.2002] Revnivtsev M., Gilfanov M., Churazov E., Sunyaev R., 2002, A&A, 391, 1013
- [\citeauthoryearRoberts2007] Roberts T. P., 2007, Ap&SS, 311, 203
- [\citeauthoryearRoberts et al.2006] Roberts T. P., Kilgard R. E., Warwick R. S., Goad M. R., Ward M. J., 2006, MNRAS, 371, 1877
- [\citeauthoryearShakura & Sunyaev1973] Shakura N. I., Sunyaev R. A., 1973, A&A, 24, 337
- [\citeauthoryearStobbart, Roberts, & Wilms2006] Stobbart A.-M., Roberts T. P., Wilms J., 2006, MNRAS, 368, 397
- [\citeauthoryearTakano et al.1994] Takano M., Mitsuda K., Fukazawa Y., Nagase F., 1994, ApJ, 436, L47
- [\citeauthoryearTüllmann et al.2011] Tüllmann R., et al., 2011, ApJS, 193, 31
- [\citeauthoryearVierdayanti et al.2010] Vierdayanti K., Done C., Roberts T. P., Mineshige S., 2010, MNRAS, 403, 1206
- [\citeauthoryearVierdayanti et al.2006] Vierdayanti K., Mineshige S., Ebisawa K., Kawaguchi T., 2006, PASJ, 58, 915
- [\citeauthoryearWeng et al.2009] Weng S.-S., Wang J.-X., Gu W.-M., Lu J.-F., 2009, PASJ, 61, 1287
- [\citeauthoryearWilkinson & Uttley2009] Wilkinson T., Uttley P., 2009, MNRAS, 397, 666
- [\citeauthoryearZdziarski et al.2005] Zdziarski A. A., Gierliński M., Rao A. R., Vadawale S. V., Mikołajewska J., 2005, MNRAS, 360, 825
- [\citeauthoryearŻycki, Done, & Smith1999] Życki P. T., Done C., Smith D. A., 1999, MNRAS, 309, 561