X-ray Stripes in Tycho’s Supernova Remant: Synchrotron Footprints of a Nonlinear Cosmic Ray-driven Instability
Abstract
High-resolution Chandra observations of Tycho’s SNR have revealed several sets of quasi-steady, high-emissivity, nearly-parallel X-ray stripes in some localized regions of the SNR. These stripes are most likely the result of cosmic-ray (CR) generated magnetic turbulence at the SNR blast wave. However, for the amazingly regular pattern of these stripes to appear requires the simultaneous action of a number of shock-plasma phenomena and is not predicted by most models of magnetic field amplification. A consistent explanation of these stripes yields information on the complex nonlinear plasma processes connecting efficient CR acceleration and magnetic field fluctuations in strong collisionless shocks. The nonlinear diffusive shock acceleration (NL-DSA) model described here, which includes magnetic field amplification from a cosmic-ray current driven instability, does predict stripes consistent with the synchrotron observations of Tycho’s SNR. We argue that the local ambient mean magnetic field geometry determines the orientation of the stripes and therefore it can be reconstructed with the high resolution X-ray imaging. The estimated maximum energy of the CR protons responsible for the stripes is eV. Furthermore, the model predicts that a specific X-ray polarization pattern, with a polarized fraction 50%, accompanies the stripes, which can be tested with future X-ray polarimeter missions.
Subject headings:
ISM: supernova remnants—X-rays: individual (Tycho’s SNR)— shock waves — turbulence1. Introduction
X-ray synchrotron emission structures have been observed with the superb spatial resolution of the Chandra telescope in many young supernova remnants (SNRs) (see e.g., Vink & Laming, 2003; Bamba et al., 2005; Uchiyama et al., 2007; Patnaude & Fesen, 2009; Eriksen et al., 2011). The morphology of the extended, nonthermal, thin filaments observed at the SNR edges, and their X-ray brightness profiles, strongly support the interpretation that TeV electrons are accelerated at the forward shock of the expanding supernova shell and produce synchrotron radiation in an amplified magnetic field. Recently, very unusual structures consisting of ordered sets of bright, non-thermal stripes were discovered by Eriksen et al. (2011) in SN 1572 (Tycho’s SNR) with a deep Chandra exposure. Understanding these structures presents a formidable challenge for current models of X-ray synchrotron images of young SNRs.
While diffusive shock acceleration (DSA) has long been favored as the likely acceleration mechanism for producing the highly relativistic electrons needed for X-ray synchrotron emission (e.g., Blandford & Eichler, 1987; Jones & Ellison, 1991; Malkov & Drury, 2001; Ellison et al., 2000), a number of basic questions remain concerning the nature of DSA in SNRs. One is the relative efficiency for accelerating protons versus electrons and their dependence on the magnetic field obliquity, another is the origin of the strong magnetic field fluctuations required for DSA to produce CR ions up to the “knee” near eV in SNRs. (e.g., Bell, 1978; Blandford & Eichler, 1987; Berezhko & Krymskiĭ, 1988; Blasi et al., 2007; Vladimirov et al., 2008; Bykov et al., 2011a). These questions are all interrelated in non-linear diffusive shock acceleration (NL-DSA) and a consistent modeling of the X-ray stripes seen in Tycho may help resolve these problems.
A fast and efficient mechanism for amplifying magnetic field fluctuations with scales below the gyroradii of the energetic particles producing the amplification was proposed by Bell (2004, 2005). Recently, it has been shown that this short-wavelength turbulence can ignite another instability that produces turbulence with wavelengths well above the gyroradii of the responsible CR particles (Bykov et al., 2011b). Large-scale turbulence is particularly important for determining the maximum energy CRs that a given shock can produce. Particle-in-cell (PIC) simulations (e.g., Niemiec et al., 2008; Ohira et al., 2009; Riquelme & Spitkovsky, 2010) have reproduced the basic predictions of Bell (2004). Studies of the fast Bell instability accounting for the nonlinear MHD cascade of the growing modes in a parallel shock precursor were performed by Bell (2004); Zirakashvili et al. (2008); Reville et al. (2008); Zweibel & Everett (2010).111In a strong, CR-modified shock precursor, where the magnetic field fluctuations likely exceed the mean field value, the distinction between a parallel and perpendicular shock is blurred. We define a perpendicular shock as one where the mean field outside the precursor region is transverse to the local shock normal. This mean ambient field outside the precursor determines the anisotropy and polarization of the most strongly amplified modes within the precursor. Modes with wavevectors along the mean field are most strongly amplified. This work assumed a CR current as a fixed external parameter and showed a fairly broad distribution of the magnetic fluctuations due to the nonlinear cascading. The backreaction of the energetic particle on the shock structure and the turbulence generation when a sizable fraction of the shock energy goes into relativistic protons is not included in these studies.
To account for the CR current backreaction on the fluctuation amplification, Vladimirov et al. (2009) included Bell’s nonresonant, CR current driven instability in a Monte Carlo model of strong shocks undergoing efficient particle acceleration. The Monte Carlo simulation self-consistently models four strongly coupled shock properties: the bulk plasma flow, the full particle spectrum, the self-generated MHD turbulence including cascading, and particle injection. In a strong shock, CRs are produced with enough energy density to modify the upstream flow speed. These precursor CRs produce a current that results, via the Bell instability, in the growth of magnetic turbulence. The turbulence, in turn, sets the momentum and space dependence of the particle diffusion coefficient and, subsequently, the injection and acceleration efficiency of the CRs, closing the system.
Vladimirov et al. (2009) found that the shock structure depends critically on the efficiency of the magnetic turbulence cascading.222Only energy transfer from long to short wavelengths is included in Vladimirov et al. (2009). If the cascading along the mean field is suppressed (e.g., Goldreich & Sridhar, 1997; Brandenburg & Nordlund, 2011) and magnetic field amplification (MFA) is strong, then the CR shock precursor becomes stratified, and the turbulence spectrum contains several discrete peaks well separated in wavenumber, . We show below that these relatively narrow peaks, where the wave spectrum energy density can be orders of magnitude greater than between the peaks (see Figure 3 in Vladimirov et al., 2009), can produce stripes in synchrotron emission consistent with the Tycho SNR observations. The peaks in turbulence energy density occur because of the strong coupling between the particle acceleration and MFA processes. They will not appear in a test-particle calculation that ignores this coupling. In Vladimirov et al. (2009), three downstream peaks were found for the case with TeV. In other examples without cascading, two and four peaks were found with correspondingly lower and higher . We note that while the simulations of Vladimirov et al. (2009) were for a parallel shock, the Bell instability always produces fastest wave growth along the mean field direction, even though the CR current, which comes from the CR density gradient, may be in a different direction (Bell, 2005). The shock modification and concentration of wave energy into peaks we require should be nearly independent of the mean field geometry in all strong shocks that show efficient CR acceleration and large amplitude turbulence as long as cascading is suppressed. Furthermore, the details of the peak structure found by Vladimirov et al. (2009) are less important for producing strips than the fact that a narrow, long-wavelength peak is generated by the maximum energy ions accelerated by the shock.
A satisfactory explanation of the highly regular, nearly-parallel, X-ray stripes observed in Tycho’s SNR by Chandra (Eriksen et al., 2011) requires a number of conditions to be satisfied. The conditions are: (i) the mean magnetic field geometry at the outer blast wave, where the stripes are prominent, must be nearly perpendicular, i.e., the field is perpendicular to the local shock normal; (ii) the unstable growing MHD modes must be linearly polarized and maintain coherence over a fairly long spatial scale, , that is somewhat below the scale size of the CR precursor, (iii) the background turbulence must have narrow peaks in wavenumber ; (iv) the stripes must persist without significant variation long enough to be seen in a deep Chandra observation; (v) the relativistic electrons producing the synchrotron radiation must have a steep spectrum to enhance the emissivity contrast between regions of low and high magnetic field; (vi) NL-DSA must be efficient enough in a quasi-perpendicular configuration to produce a shock precursor structure and MFA; and (vii) turbulence cascading along the mean field should be suppressed to prevent spectral broadening. The model we now detail provides all of these properties in rather a natural way.
2. Model
The coherent nature of the X-ray stripes suggests that the underlying magnetic turbulence is strongly anisotropic. Isotropic turbulence would not produce extended coherent structures with thin stripes. Both the Bell short-wavelength instability and the long-wavelength instability, considered by Bykov et al. (2011b), produce anisotropic turbulence with a prominent growth-rate maximum along the mean ambient magnetic field direction. The mean ambient magnetic field is the field averaged over scales larger than the CR shock precursor. Since the SNR radius in Tycho is considerably larger than the shock precursor, the local ambient field direction may vary over the SNR surface.
The SNR geometry we model is shown in Figure 1, where the ambient (i.e., upstream) field, , is in the -direction and is tangent to the shock surface for the region of the forward shock in the -plane. The pattern shown has the linear polarization vector, , in the -direction and the wavevectors of the growing modes are along . The rectangular box schematically shows the magnetic field amplification region where the CR-driven instability occurs. The inflowing fluctuations in the ISM field with wavevectors along the mean field direction are amplified most rapidly by the CR-current instability in the box of scale size . This scale determines the coherence length of the amplified field. The projected scale of the box is imprinted into the simulated image shown in the top-left inset in Figure 1 and in Figure 2. The linear polarization of the waves propagating along the downstream field of the transverse shock results in regions parallel to the shock surface with alternating high and low field strengths, which will translate into bright and dim regions of synchrotron emission.
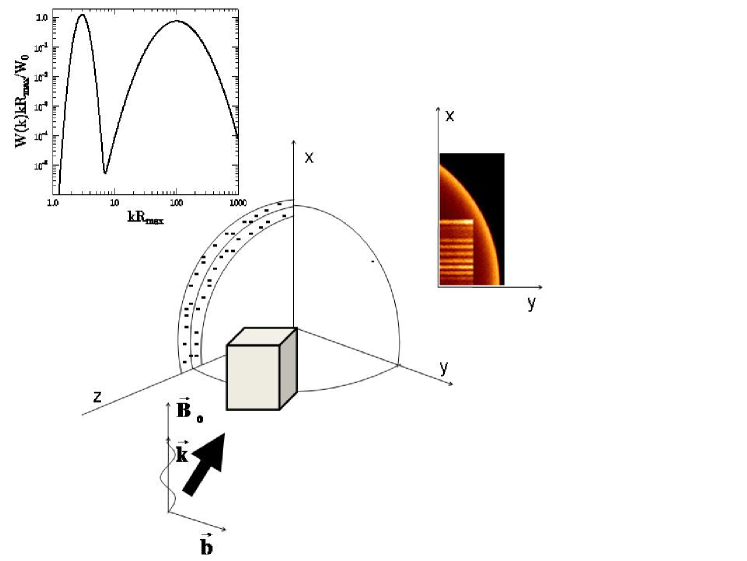
In both the Bell and long-wavelength instabilities, the polarization of the turbulence depends on the orientation of the ambient magnetic field (see Bell, 2005; Bykov et al., 2011b). The amplified field fluctuations have circular polarization for a parallel shock where the ambient field and the CR density gradient are directed along the shock normal. In contrast, linearly polarized waves, propagating along the ambient field, are amplified in the case of a perpendicular shock. The mode polarization is important to produce stripes as well as the shock geometry. If the stripes were produced in the quasi-parallel shock, they would be limited in length to the thickness of the synchrotron -bright downstream region, , and this thickness is estimated below to be small compared to the length of the observed stripes. The linearly polarized waves in a perpendicular shock, however, can produce a nearly static, striped emission pattern with a length much longer than along the shock surface.
However, even with linearly polarized waves in a uniform perpendicular field, any stripes that might occur will be washed out if the waves in the long-wavelength peak have a significant spread in wave number, i.e., if , where is the long-wavelength peak position in the two peak spectrum shown in the inset in Figure 1.333Fluctuations with wavelengths longer than produced by the Bell instability may also be amplified (e.g., Bykov et al., 2011b) or produced by inverse cascading (Riquelme & Spitkovsky, 2010). The longer wavelengths have slower growth rates then those produced by the fast Bell instability. These may somewhat broaden the spectral peak. Any longer wavelength turbulence will increase the maximum CR proton energy, and if this turbulence is included in the Monte Carlo simulation, there would be a shift of to smaller . A NL-DSA model that accounts for all of the resonant and nonresonant instabilities is not yet available. The peaks found by Vladimirov et al. (2009) obey . When combined with linearly polarized waves in a perpendicular shock, these narrow peaks result in the creation of stripe-like structures in the synchrotron image.
We constructed synchrotron images of a spherical SNR in a model that accounts for the fluctuating magnetic field structures described above following the approach developed in Bykov et al. (2008, 2009). The amplified magnetic field in the downstream is simulated as a superposition of the predominantly linearly polarized modes of random phases, with a spectral distribution consisting of a few isolated narrow peaks in wavenumber space, as was obtained in the NL-DSA model with a CR-driven instability. The magnetic fluctuation spectrum, shown in the inset in Fig. 1, has two peaks; the long-wavelength peak at (where is the gyro-radius of the maximum energy ion accelerated by the shock) has a width . The second peak at the shorter wavelength (with ) is wider. The energy density of magnetic fluctuations in both peaks are comparable, as was the case in the NL-DSA model by Vladimirov et al. (2009). The scales corresponding to the short-wavelength peak at cannot be resolved in Tycho’s SNR even with arcsecond resolution X-ray telescopes, while the long-wavelength fluctuations have scales resolvable with these instruments.
Regarding the timing and spacing of the stripes, the wavelength of the turbulence at must be consistent with the observed spacing, and the period must be long enough so that the structure does not change significantly in a deep Chandra observation of duration .
In the quasi-perpendicular portion of the SNR shock the stripes move transverse to the flow velocity. The structure moves with a phase velocity on the order of the Alfvén velocity and the time scale for changes in the structure is , yielding a constraint . The separation of the stripes is determined by the wavelength . We estimate that the apparent movement of the stripes due to this effect is /yr for a SNR at kpc, expanding in ambient gas of number density , and assuming the amplified magnetic field downstream from the shock is G, yielding . Given the extended spatial structure of the stripes, their proper motion can hardly be noticed in 10 years of Chandra observations.
An important point to address is why the stripes that appear in the X-ray synchrotron emission do not appear in the radio synchrotron observations of Tycho’s SNR (Reynoso et al., 1997; Vigh et al., 2011). This is naturally explained if the TeV electrons producing the X-rays have a steeper distribution than the GeV electrons producing the radio. The synchrotron emissivity of a power-law electron spectrum with spectral index is proportional to , i.e., the local emissivity is relatively very high for large local and large . With a steep electron distribution, the intensity contrast between the peak and trough of the magnetic turbulence produces a greater luminosity contrast for the TeV electrons than for the flatter GeV electrons. The stripes in radio are not distinct enough to be visible in the VLA observations.
The kinetic model we used here to simulate the electron distribution is similar to that discussed by Bykov et al. (2009). The spatially inhomogeneous electron distribution function is calculated from the kinetic equation for electrons at a SNR shock using a piece-wise parametrization of the particle diffusion coefficient that is consistent with that obtained for TeV protons by Vladimirov et al. (2009). The synchrotron-Compton losses of electrons in magnetic fields of are accounted for. The narrow spherical shell of thickness filled with the accelerated electrons is shown schematically in Figure 1 as a dotted region.
Finally, as Vladimirov et al. (2009) showed, energy cascading spreads out the peaks in turbulence power and eliminate the key feature needed to produce an ordered pattern of stripes. Therefore, such stripes can form only if the turbulent cascading along the mean magnetic field is quenched.
3. Discussion
The width of the region with synchrotron emitting electrons in the shock downstream is typically rather narrow (dotted region in Figure 1). The thickness of the layer depends on the cooling rate in the downstream magnetic field: cm, where the r.m.s. magnetic field is in G, is the shock velocity in units of , and is the electron energy in TeV. After accounting for the projection effect, the value of provides the limb brightening observed in many synchrotron images of young SNRs.
While the synchrotron X-ray emission is mainly produced in a thin downstream layer that cannot always be resolved in X-rays, the transverse (relative to the shock normal) scale size of the emitting region is determined by the projected scale size of the magnetic field amplification region in the shock precursor. The wave vectors of the fast growing modes flowing into the shock must be directed, in the shock rest frame, within a fairly narrow cone along the mean ambient field direction. The transverse scale size of the locally amplified fluctuations should be comparable to the precursor scale size, which is assumed to be much smaller than the shock radius. It is also important that the fast amplification of the field implies that the field correlation length is also on the order of the precursor scale size. Therefore, the length of a stripe is determined by the projected scale size of the magnetic field amplification region. In the model under consideration, the fast amplification of magnetic field fluctuations due to the CR current-driven instability occurs in the CR precursor of the strong shock. The scale size of the CR-precursor, for Bohm diffusion, is a fraction of , and typically from the Monte Carlo simulations.
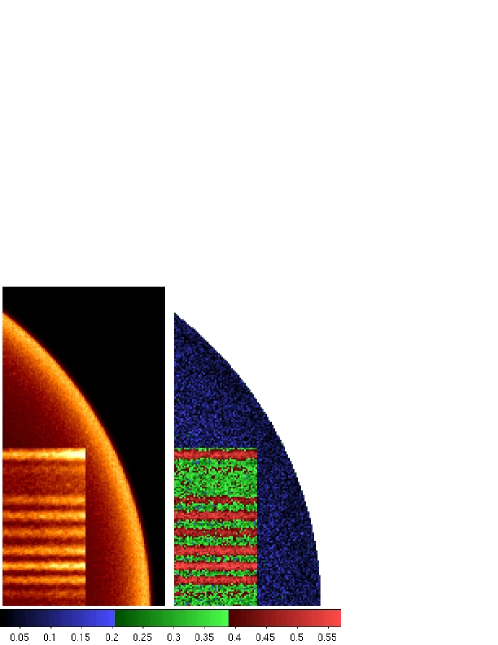
The distance between the stripes is set by the wavelength of the turbulence which is on the order of . Therefore, the ratio of the stripe elongation length to the distance between the field maxima is about , and that number also estimates the number of the stripes in a single coherent set shown in Figure 2.
4. Conclusions
It has been known for quite some time that NL-DSA can be efficient with a strong coupling between the CR spectrum and the magnetic field dynamics. However, a nonlinear study, using Monte Carlo techniques by Vladimirov et al. (2009), has recently produced a surprising result: if the turbulence cascading is suppressed along the mean magnetic field, the shock precursor becomes stratified, and a multiple-peak structure of the amplified, fluctuating magnetic field spectrum forms.
As we have shown here, the multiple-peak power spectrum, along with the anisotropic character of the CR-current driven instability, can result in structures in synchrotron images of SNRs similar to the recent observations of Tycho’s SNR by Eriksen et al. (2011). The unusual nature of the nearly-parallel X-ray stripes is highly constraining and a number of conditions must be fulfilled for them to be produced. Observationally, the stripe-like structures should be prominent and resolvable for a quasi-perpendicular shock configuration, but they are likely too small or indistinct to be resolved with current instruments in regions where the shock is quasi-parallel. The synchrotron emission from the stripes should be linearly polarized. The simulated degree of polarization is shown in the right panel in Figure 2. The high polarized fraction of predicted for the bright stripes should make these structures highly prominent in future X-ray polarization observations. The lack of Faraday rotation and the relatively steep spectra of synchrotron emission are advantageous for X-ray polarization studies of young SNRs (see Bykov et al., 2009).
Stripe-like structures should form in a section where the local field lies along the shock surface and where the turbulence cascading is suppressed. We argue that it is difficult to produce the stripe structure in synchrotron images in any natural way other than with narrow peaks in the magnetic turbulence in a perpendicular shock. This uniqueness offers a new way to infer the geometry of the local ambient magnetic field. The magnetic field structure is particularly important in modeling the TeV gamma-ray emission from Tycho’s SNR recently detected with the VERITAS ground based gamma-ray observatory by Acciariet al. (2011).
References
- Acciariet al. (2011) Acciari, V. A. et al. 2011, ApJ, 730, L20+
- Bamba et al. (2005) Bamba, A., Yamazaki, R., Yoshida, T., Terasawa, T., & Koyama, K. 2005, ApJ, 621, 793
- Bell (1978) Bell, A. R. 1978, MNRAS, 182, 147
- Bell (2004) —. 2004, MNRAS, 353, 550
- Bell (2005) —. 2005, MNRAS, 358, 181
- Berezhko & Krymskiĭ (1988) Berezhko, E. G., & Krymskiĭ, G. F. 1988, Soviet Physics Uspekhi, 31, 27
- Blandford & Eichler (1987) Blandford, R., & Eichler, D. 1987, Phys. Rep., 154, 1
- Blasi et al. (2007) Blasi, P., Amato, E., & Caprioli, D. 2007, MNRAS, 375, 1471
- Brandenburg & Nordlund (2011) Brandenburg, A., & Nordlund, Å. 2011, Reports on Progress in Physics, 74, 046901
- Bykov et al. (2011a) Bykov, A. M., Ellison, D. C., & Renaud, M. 2011a, Space Sci. Rev., DOI: 10.1007/s11214-011-9761-4
- Bykov et al. (2011b) Bykov, A. M., Osipov, S. M., & Ellison, D. C. 2011b, MNRAS, 410, 39
- Bykov et al. (2009) Bykov, A. M., Uvarov, Y. A., Bloemen, J. B. G. M., den Herder, J. W., & Kaastra, J. S. 2009, MNRAS, 399, 1119
- Bykov et al. (2008) Bykov, A. M., Uvarov, Y. A., & Ellison, D. C. 2008, ApJ, 689, L133
- Ellison et al. (2000) Ellison, D. C., Berezhko, E. G., & Baring, M. G. 2000, ApJ, 540, 292
- Eriksen et al. (2011) Eriksen, K. A., Hughes, J. P., Badenes, C., Fesen, R., Ghavamian, P., Moffett, D., Plucinksy, P. P., Rakowski, C. E., Reynoso, E. M., & Slane, P. 2011, Astrophysical Journal, 728, L28+
- Goldreich & Sridhar (1997) Goldreich, P., & Sridhar, S. 1997, ApJ, 485, 680
- Jones & Ellison (1991) Jones, F. C., & Ellison, D. C. 1991, Space Science Reviews, 58, 259
- Malkov & Drury (2001) Malkov, M. A., & Drury, L. 2001, Reports on Progress in Physics, 64, 429
- Niemiec et al. (2008) Niemiec, J., Pohl, M., Stroman, T., & Nishikawa, K. 2008, ApJ, 684, 1174
- Ohira et al. (2009) Ohira, Y., Reville, B., Kirk, J. G., & Takahara, F. 2009, ApJ, 698, 445
- Patnaude & Fesen (2009) Patnaude, D. J., & Fesen, R. A. 2009, ApJ, 697, 535
- Reville et al. (2008) Reville, B., O’Sullivan, S., Duffy, P., & Kirk, J. G. 2008, MNRAS, 386, 509
- Reynoso et al. (1997) Reynoso, E. M., Moffett, D. A., Goss, W. M., Dubner, G. M., Dickel, J. R., Reynolds, S. P., & Giacani, E. B. 1997, ApJ, 491, 816
- Riquelme & Spitkovsky (2010) Riquelme, M. A., & Spitkovsky, A. 2010, ApJ, 717, 1054
- Uchiyama et al. (2007) Uchiyama, Y., Aharonian, F. A., Tanaka, T., & et al. 2007, Nature, 449, 576
- Vigh et al. (2011) Vigh, C. D., Velázquez, P. F., Gómez, D. O., Reynoso, E. M., Esquivel, A., & Matias Schneiter, E. 2011, ApJ, 727, 32
- Vink & Laming (2003) Vink, J., & Laming, J. M. 2003, ApJ, 584, 758
- Vladimirov et al. (2008) Vladimirov, A. E., Bykov, A. M., & Ellison, D. C. 2008, ApJ, 688, 1084
- Vladimirov et al. (2009) —. 2009, ApJ, 703, L29
- Zirakashvili et al. (2008) Zirakashvili, V. N., Ptuskin, V. S., & Völk, H. J. 2008, ApJ, 678, 255
- Zweibel & Everett (2010) Zweibel, E. G., & Everett, J. E. 2010, ApJ, 709, 1412