Metallicities, Age–Metallicity relationships, and Kinematics of Red Giant Branch Stars in the Outer Disk of the Large Magellanic Cloud111Based on observations collected at the European Southern Observatory, Chile, within the observing programs 074.B-0474 and 082.B-0900
Abstract
The outer disk of the Large Magellanic Cloud (LMC) is studied in order to unveil clues about its formation and evolution. Complementing our previous studies in innermost fields (3 kpcR7 kpc), we obtained deep color magnitude diagrams in 6 fields with galactocentric distances from 5.2 kpc to 9.2 kpc and different azimuths. The comparison with isochrones shows that while the oldest population is approximately coeval in all fields, the age of the youngest populations increases with increasing radius. This agrees with the results obtained in the innermost fields. Low-resolution spectroscopy in the infrared Ca II triplet region has been obtained for about 150 stars near the tip red giant branch in the same fields. Radial velocities and stellar metallicities have been obtained from these spectra. The metallicity distribution of each field has been analyzed together with those previously studied. The metal content of the most metal-poor objects, which are also the oldest according to the derived age-metallicity relationships, is similar in all fields independently of the galactocentric distance. However, while the metallicity of the most metal-rich objects measured, which are the youngest ones, remains constant in the inner 6 kpc, it decreases with increasing radius from there off. The same is true for the mean metallicity. According to the derived age-metallicity relationships, which are consistent with being the same in all fields, this result may be interpreted as an outside-in formation scheme in opposition with the inside-out scenario predicted by CDM cosmology for a galaxy like the LMC. The analysis of the radial velocities of our sample of giants shows that they follow a rotational cold disk kinematics. The velocity dispersion increases as metallicity decreases indicating that the most metal-poor/oldest objects are distributed in a thicker disk than the most metal-rich/youngest ones in agreement with the findings in other disks such as that of the Milky Way. They do not seem to be part of a hot halo, if one exists in the LMC.
1 Introduction
The formation and evolution of stellar disks in galaxies are still not well understood processes in spite of the observational and theoretical effort developed in the last years (see van der Kruit & Freeman, 2011, for a review). Simulations based on CDM predict that the inner parts of disks form first and then they grow up to reach their present-day size (e.g. White & Frenk, 1991; Mo et al., 1998; Roškar et al., 2008). According to this scenario, so-called inside-out, it is expected that the youngest populations are located in the outermost regions. Therefore, to understand the formation and evolution of disks, it is important to have information about the spatial distribution of their different stellar populations in a large range of galactocentric distances. In particular, their outskirts are key since they might retain a fossil record of the disk formation due to their long dynamical timescales.
From an observational point of view, the study of the outer disks is difficult due to their low-surface brightness at the level of, or even bellow, the background. The behaviour of the star formation rate with radius can be studied with surface photometry in galaxies within a few Mpc (e.g. de Jong, 1996; Taylor et al., 2005). In general, these investigations found that massive early-type spirals are bluer in their outer disk (e.g. Trujillo & Pohlen, 2005), in agreement with the inside-out scenario although these disks are mainly populated by old (10 Gyr) old stars (e.g. Sánchez-Blázquez et al., 2011). Disks in late-type spirals and irregular galaxies have more puzzling behaviors (e.g. de Jong, 1996; Gadotti & dos Anjos, 2001; Taylor et al., 2005; Hunter & Elmegreen, 2006). Some of them follow the same trend observed in early-type spirals. However, others become redder outward which is interpreted as the youngest populations being located in the innermost regions, since no galaxy formation model predicts positive metallicity gradients. This suggests an outside-in scenario in the way predicted by Stinson et al. (2009) for less massive galaxies and observed by Hidalgo et al. (2011) for less massive (M109 M⊙) galaxies.
Nearby galaxies, in which their stars can be resolved, offer the opportunity to study galactic disks in more detail. The observations in the two most massive spirals in the Local Group, M31 and the Milky Way, agree quite well with the predictions of the inside-out scenario. M31 does not show a clear metallicity gradient (Ibata et al., 2005) while in the Milky Way a smooth gradient is observed which was more sharp in the past (e.g. Carrera & Pancino, 2011). There is another spiral in the Local Group, M33, of later type and much less massive than the previous ones. This galaxy shows a truncation in its radial brightness surface profile (Ferguson et al., 2007) which is also observed in other galaxies (e.g. Trujillo & Pohlen, 2005). Although still not well understood, this truncation can be originated during the collapse of the protogalactic cloud (van der Kruit, 1987) or can be related to different star formation thresholds at different galactocentric distances (e.g. Schaye, 2004). The scale-length of M33 increases with time within the break radius (Williams et al., 2009) and steepens and even reverse from there out (Barker et al., 2007). These authors interpreted this result in the context of the inside-out scenario: the inner disk would have been grown from the inner regions, while secular processes radially redistribute stars causing an inflection point in the stellar age gradient at the break radius.
There is a fourth disk galaxy in the Local Group, the Large Magellanic Cloud (LMC). Sometimes considered an irregular, it is more properly classified as a Barred Magellanic Spiral (SBm). This kind of objects are frequent through the Universe and are characterised by a mass between that of large and dwarf galaxies, and the presence of a bar and a disk containing a single spiral arm. The proximity of the LMC allows us to investigate it using both spectroscopy and photometry of individual stars. Therefore, we can obtain information about the age and/or chemical abundances spatial distribution and about kinematics. Moreover, the LMC contains the only resolved bar in the Local Group and it forms an interacting system together with the Small Magallanic Cloud and the Milky Way, although their history of past interactions are still not well understood (e.g. Besla et al., 2007, 2010).
The LMC inner disk444In this paper we call “inner disk” the region within kpc, and “outer disk” the region from that distance off. Note that at the distance of the LMC, 1 kpc corresponds to 112 on the sky (van der Marel, 2001) ( kpc) has been the subject of most work about its stellar population (e.g. Bertelli et al., 1992; Olsen, 1999; Holtzman et al., 1999; Cole et al., 2000; Castro et al., 2001; Smecker-Hane et al., 2002; Cole et al., 2005; Pompéia et al., 2008; Harris & Zaritsky, 2009). However, the LMC disk extends at least to 12-14 kpc (Majewski et al., 2009; Saha et al., 2010). The lack of works in the outer LMC do not allow to study radial trends in detail. Studies covering large galactocentric distances use stellar clusters as test particles (e.g. Olszewski et al., 1991; Grocholski et al., 2006; Sharma et al., 2010). They did not find neither age nor metallicity gradients. The spatial distribution of asymptotic giant branch stars (AGB) in the field of the LMC has been also studied using the ratio between the number of carbon and oxygen-rich stars, traditionally denoted as C/M. Two works have used this indicator reaching contradicting conclusions for the inner disk. Cioni (2009) found that the C/M ratio increases rapidly with increasing distance which is interpreted as a metallicity gradient with the outskirts being more metal-poor. However, using the same data Feast et al. (2010) found that the C/M ratio is nearly constant in the inner 4 kpc, from there off the ratio decreases. Since carbon-rich stars are rare in old populations this result is interpreted as the outer disk stars are older. Unfortunately, high-resolution spectroscopy studies at different galactocentric distances, which would allow investigation of the possible presence of abundance gradients of some key chemical species, are not available.
Our group is involved in a major effort to study the LMC using both photometric and spectroscopic observations. Gallart et al. (2008, hereafter Paper I) studied four fields located at different galactocentric distances (3 kpc R 7 kpc)555The galactocentric distances used in Paper I are different from those used here and in Paper II, because they have been calculated assuming different centres. While the dynamical center of the Carbon stars was used here, which better represents the center of the older populations, paper I used the center of the Bar. The distance between both is about 1 kpc.. They found that the age of the youngest populations in each field increases with galactocentric distance. In fact, a more detailed analysis of these fields by Meschin et al. (2011) found a gradual decrease of the ratio of young to old populations with radius. Carrera et al. (2008a, hereafter Paper II) derived ages and metallicities for about 100 red giant branch (RGB) stars confirmed as LMC members from their radial velocities in each of these fields using the infrared Ca II triplet (CaT) lines. The three inner fields have a similar mean metallicity, but that of the outermost one is a factor of two more metal-poor (see Paper II for details). This is explained by the lack of the youngest stars in the latter field which are also more metal-rich. These results point toward an outside-in formation of the LMC disk, on contrary to the inside-out scenario usually predicted for a galaxy with a mass similar to that of the LMC. The observed behaviour is more like that expected for less massive galaxies (Stinson et al., 2009; Hidalgo et al., 2011).
In this paper, we extend our study of the LMC disk at larger galactocentric distances (R7 kpc). For this purpose we have obtained deep CMDs and low resolution spectroscopy for 6 new fields spread over the LMC disk. Their spatial distribution and color-magnitude diagrams (CMD) are described in Sections 2 and 3, respectively. The spectroscopic observations and data reduction, together with the tools used to derive radial velocities, metallicities, and ages are described in Section 4. The metallicity distribution and age-metallicity relation (AMR) of each field are presented in Sections 7.1, and 7.2, respectively. The kinematics of our RGB sample is analysed in Section 7.3. Finally, the implications of the main results of this work are discussed in Section 8 and summarised in Section 9.
2 Spatial Distribution of Observed Fields
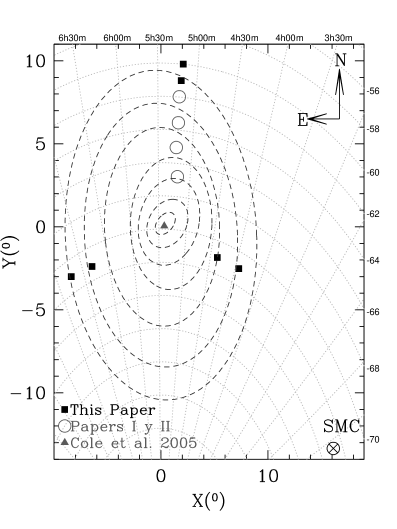
We have selected 6 fields in addition to the ones presented in Papers I and II. They are shown in Figure 1 together with the near infrared isopleths from van der Marel (2001) for reference. Two of the new fields presented in this paper are situated at either side of the LMC bar, in the East-West direction, toward the SMC (West) and the Galactic center (East). With them we aim to investigate the possible influence of the SMC in the LMC’s disk evolution. The remaining two fields are located northward of the bar, as those studied in Paper II, but further out than them. These fields were selected to study the outermost regions of the LMC disk and are key to investigate the presence of a metallicity gradient.
Equatorial -right ascension and declination- coordinates over the celestial sphere for observed fields, named according to their right ascension and declination as in Paper I, are listed in Table 1. Angular -distance and position angle- coordinates have been computed using the equations described by van der Marel (2001) considering the dynamical center of the carbon stars as origin ( and ; van der Marel et al., 2002) are also listed in Table 1. Distances computed in this way might not be actual physical distances because they do not take into account the viewing angles of the disk: inclination, , and the major–axis position angle, , which are needed to deproject the observed morphology. We deproject the angular distances of our fields following Cioni (2009), assuming and (van der Marel & Cioni, 2001). These values, listed in the last column of Table 1, will be used throughout this work.
3 Color-Magnitude Diagrams
- and -band images for the northern fields, and - and -band images for the others, were obtained with WFI at the 2.2 m telescope at La Silla Observatory, Chile. The WFI camera is a mosaic of 4 2 of 2048 4096 CCDs covering a total area of 34′ 33′ with a scale of 0.238 pixel-1. The images were bias and flat-field corrected in the usual way with the IRAF666IRAF is distributed by the National Optical Astronomy Observatories,which is operated by the Association of Universities for Research in Astronomy, Inc., under cooperative agreement with the National Science Foundation. MSCRED package. Profile-fitting photometry was obtained with the DAOPHOT/ALLFRAME suite of codes (Stetson, 1994) and calibrated to the standard system using observations of several Stetson (2000) fields obtained in the same run.
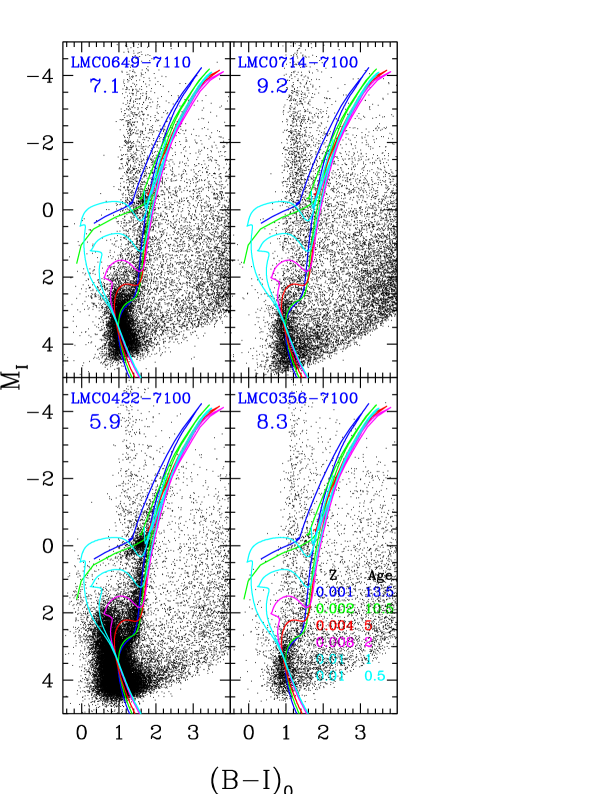
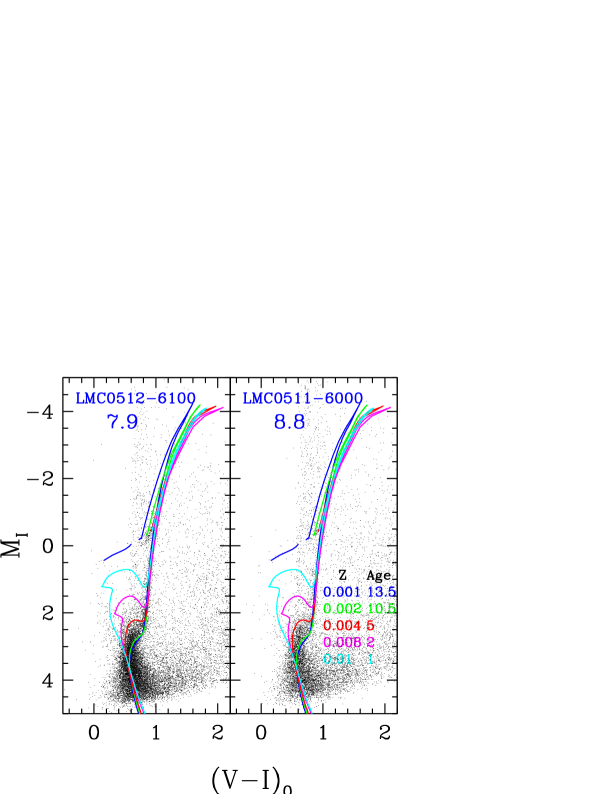
[,] CMDs of the western (towards the SMC) and eastern (in the opposite direction) fields are shown in the bottom and top panels of Figure 2, respectively. [, ] CMDs of the northern fields are plotted in Figure 3. Although we postpone to a forthcoming paper the detailed analysis of these CMDs, a set of isochrones has been overimposed on them with the purpose of intercomparing fields. We used the same set of overshooting isochrones as in Paper I selected from the BaSTI library (Pietrinferni et al., 2004). Their metallicities follow approximately the AMRs derived in Paper II (see section 7.2).
All fields studied, even those at a distance of 9 kpc, have a well populated old main-sequence turn-off region. This, in agreement with the results obtained in Paper I, suggests that star formation started at about the same time in all of them. An alternative is that these stars were formed in the inner disk and then they have migrated to the outskirts. All fields contain an important amount of intermediate-age LMC populations. The bulk of stars in the innermost field studied, LMC0422-7100, have ages older than 2 Gyr while most of the stars in the remaining fields have ages older than 5 Gyr. In all fields a number of stars overlapping the 1 Gyr can be observed, which number increases as the global number of the stars in the field increases. The presence of this population was also noted by Gallart et al. (2004) in a field located at 7 kpc and interpreted as a burst of star formation 1 Gyr ago. However, since they are present in all studied fields and their number is correlated with the density of stars in each field they may be blue stragglers. As in the case of Paper I the comparison with isochrones show an increase of the age of the intermediate-age populations present in each field with galactocentric distance. There are not clear differences with azimuth since CMDs of fields at similar distances but different azimuths have a similar morphology.
4 Spectroscopic Observations, Data Reduction and Radial Velocities
As in Paper II, the stars observed spectroscopically were selected on the upper part of the RGB trying not to exclude metal-poor objects on the blue ridge but avoiding inclusion of red-clump and red supergiant objects. Stars below the tip of the RGB were given the highest priority of observation and brighter objects were only targeted when no others were available. The observations were carried out in service mode on ESO period 82 with FLAMES mounted at VLT UT2. We used the low-resolution grating LR8 which covers the wavelength range between 8200 to 9400 Å with a resolution of R 6500, in order to accurately measure equivalent widths of the CaT lines as well as radial velocities.
The ESO provides reduced data obtained with the GIRAFFE data-reduction pipeline (Melo et al., 2009). This pipeline performs the bias, flatfield and scattered light corrections, find, trace and extract the spectra and obtain the wavelength calibration based on daytime calibration exposures. The only reduction step that this pipeline does not perform is the sky subtraction. To do this, we followed a similar procedure as in Paper II but with some modifications as described by Battaglia et al. (2008). In brief, for each exposure we average the spectra of all fibers placed on the sky to obtain a high signal-to-noise ratio (S/N) sky spectrum. This sky spectrum, and the objects spectra are separated into two components: continuum and line spectra. To obtain the continuum we fitted a polynomial rejecting the contribution of both sky and object lines. The line spectrum is obtained by subtracting the continuum. The sky-line component is cross correlated with each object-line to put both in the same wavelength scale. This also provides an additional test of the wavelength calibration. After updating the wavelength calibration, the sky- and object-line components are compared looking for the scale factor that minimises the sky line residuals over the whole spectral region. The object-continuum component is wavelength updated and added back to the sky subtracted object-line spectrum. Finally, the sky-continuum is subtracted assuming that the scale factor is the same than for the sky-line component. The result is that the residuals of the sky lines are lower than 3%.
Since 2 or 3 exposures were obtained for each configuration we combined all the spectra of the same object, thus improving the S/N and minimising the contribution of cosmic rays and bad pixels. Finally, each object spectrum is normalised.
Radial velocities are key to reject foreground objects, but they also provide valuable information about the LMC kinematics (see Section 7.3). However, radial velocity standard stars were not observed, so we used one of our targets with a very high S/N as template. We obtained the radial velocity of this star using the laboratory position of the three CaT lines and other lines easily identified in its spectrum using the rvidlines task in IRAF. Then, the radial velocities of all stars were calculated by cross-correlation using the IRAF fxcor task, with this high S/N star as template. As in paper I, we considered as LMC members those stars with radial velocities in the range 170V380 km s-1 (Zhao et al., 2003). In total, we have determined ages, and metallicities for 147 stars confirmed as LMC members from their radial velocities in the 6 fields observed. Their magnitudes, CaT equivalent widths (see below), and radial velocities are listed in Table 2.
5 CaT Equivalent Widths and Metallicity Determination
The metallicity of each star was determined from the equivalent widths of the CaT lines using the procedure described by Carrera et al. (2007, hereafter Paper III). The line profiles were obtained by fitting a Gaussian plus a Lorentzian, which provides the best fit to line core and wings (see Paper III for details). Although the spectra had already been normalised, the position of the continuum was recalculated by a linear fitting to the mean values of each continuum bandpass defined in Paper III. The CaT index, denoted as Ca, is defined as the sum of the equivalent widths of the three CaT lines.
The strength of the CaT lines depends on the temperature, gravity and chemical abundance of the stellar atmosphere. Since we are only interested on the abundance dependence, the temperature and gravity contributions must be removed. The procedure followed is described in depth in Paper III and we summarize here the most important details. For a given chemical abundance, the stars define a sequence in the Luminosity- Ca plane when the temperature and/or gravity change. Although this sequence is not linear for the whole magnitude range covered by the RGB it is very close to linear when only stars in the upper two magnitudes of the RGB are considered as in our case. The non-linearity of the sequences in the Luminosity- Ca plane is in general important for [Fe/H]-3 (Starkenburg et al., 2010). However, the expected number of stars in that metallicity range is negligible based on the results described in Paper I. We safely assume therefore that the sequence defined by stars of the same metallicity in the Luminosity- Ca plane is linear. We used MI as luminosity indicator, because the CaT metallicity calibration based on MI is less sensitive to age. In the MI- Ca plane the sequences can be parametrised in the form . W’I is called the reduced equivalent width. The slope is independent of the metallicity, whereas W’I changes with the chemical abundance.
In Paper III, we obtained relationships between W’I and metallicity in different metallicity scales, including the Carretta & Gratton (1997, hereafter CG97). The stellar metallicities of the objects studied in Paper II are calculated in this scale. Recently Carretta et al. (2009, hereafter C09) have updated their metallicity scale based on more homogeneous and higher resolution spectra of a larger sample of bright giants in 24 Galactic globular clusters. They provide the relation between their new and old scales. The existence of this new metallicity scale for globular clusters as well as new determinations of metallicities for some open clusters used in Paper III from high-resolution spectroscopy (R20000) motivate us to obtain a new relation between the strength of the CaT lines and metallicity. To do this we used the same cluster sample as in Paper III and listed in Table Metallicities, Age–Metallicity relationships, and Kinematics of Red Giant Branch Stars in the Outer Disk of the Large Magellanic Cloud111Based on observations collected at the European Southern Observatory, Chile, within the observing programs 074.B-0474 and 082.B-0900. The reduced equivalent width of each cluster in and shown in columns 2 and 3 are the same of those used in Paper III. The metallicities used in Paper III, the new values calculated here and the corresponding references are listed in column 4, 5 and 6, respectively.
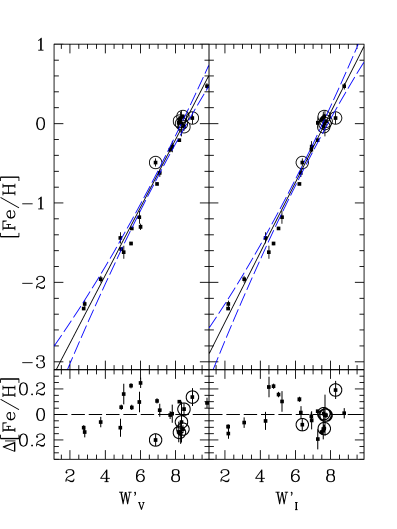
The behaviour of W’V and W’I as a function of metallicity are shown in Figure 4. We have used 25 clusters for the calibration in and 23 for that in . In both cases a linear correlation is obtained with best fits given by:
| (1) | |||||
| (2) |
In Paper III we determined that the linear sequence in the MI- Ca plane is given by . Therefore, using Equation 2 the metallicities of the LMC stars are given by:
| (3) |
To obtain the absolute magnitudes of the LMC stars we assumed a distance modulus of and the reddenings listed in Table 1 obtained from Schlegel et al. (1998).
Since different metallicity scales are available in the literature, it is necessary to determine to what extent the metallicity distributions obtained here depend on the scale used. To do this we have calculated the metallicities of all stars observed in the northern fields ( 400) in three different scales, which we display as follows. The left panel of Figure 5 shows the difference of metallicities obtained in Paper II and those obtained here as a function of the last ones. The new values are systematically more metal-poor than those derived in Paper II, and the difference increases towards lower metallicities. This is explained by the difference between the two globular cluster metallicity scales used in each case (for a detailed comparison see Carretta et al., 2009). It is interesting to note that all the CaT surveys performed until now in dwarf spheroidals companions of the Milky Way do not find objects as metal-poor as those observed in the Galactic halo (e.g. Helmi et al., 2006). The new scale seems to solve in part this discrepancy. However, Starkenburg et al. (2010) demonstrated that the lack of metal-poor stars in CaT surveys is due to the way in which the temperature and gravity contributions are taken into account. They proposed that extremely metal-poor stars are not detected because of the wrong assumption that stars of the same metallicity follow a linear sequence in the MI- Ca plane (see also Paper III). On the right panel of Figure 5 we have compared the difference of metallicities derived using the Starkenburg et al. (2010) recipe to those obtained here with our method. As before, our metallicities are systematically lower than those by Starkenburg et al. (2010) at low metallicities. However in this case the dispersion is much larger. We conclude that the differences between the three scales are only noticeable ([Fe/H]0.2 dex) for extreme values of the metallicity but that in the metallicity range which contains most of the LMC stars (i.e., -1.6[Fe/H]+0.3) they produce values within 0.2 dex.
6 Estimation of Stellar Ages
The age-metallicity degeneracy in the position of the RGB in the CMD can be broken when either the metallicity or the age can be obtained independently of each other. Because of this, combining the metallicities of stars derived from spectroscopy with their position in the CMD allows us to estimate their age. In Paper II, a polynomial relationship was computed to derive stellar ages from their metallicities and positions in the CMD. For this purpose, a synthetic CMD was created with IAC-star (Aparicio & Gallart, 2004), adopting BaSTI stellar evolution models with overshooting (Pietrinferni et al., 2004). The aforementioned relation was obtained in Paper II for () and MV while Carrera et al. (2008b) derived a similar relation from the same synthetic CMD for () and MI. We refer the reader to these papers for a detailed discussion of the procedure used, uncertainties and tests of confidence levels. Carrera et al. (2008b) confirmed that both relationships produce similar results within the uncertainties. We have used the corresponding coefficients -those derived for () in the case of the North fields, and those for () for the remaining fields- obtained in these papers to derive ages for each program star.
7 Analysis
7.1 Metallicity Distributions
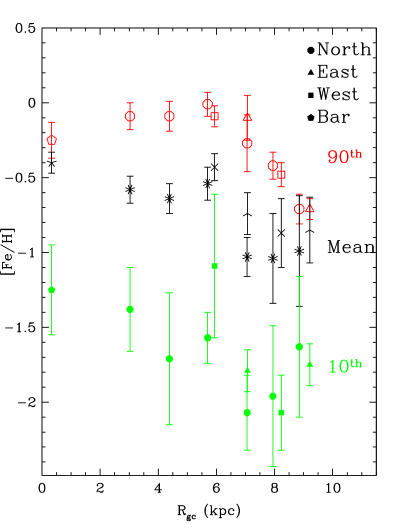
The metallicity distributions for each field are shown in Figures 6 and 7. Because we used here a different metallicity scale than in Paper II, we have also recalculated the metallicity distributions of the fields analysed there (Figure 6). The differences between the distributions described in Paper II and those obtained with the new scale are only appreciable for low metallicity stars, which are poorly sampled. The small number of objects () confirmed as LMC members from their radial velocity in the new fields studied, except for field LMC0422-7100 (see Table 4), do not allow us to perform a detailed analysis of these distributions. However, we can use their mean metallicity to investigate possible differences among them as well as metallicity gradients. In Paper II means and dispersions were obtained by Gaussian fitting to each distribution. This is correct for samples with a number of objects large enough (50). But Gaussian fitting is not adequate for poorly sampled distributions. To overcome this problem we have adopted the following procedure. Half of the stars in each sample were randomly selected and the mean, standard deviation and 10th and 90th percentile of their metallicity distribution were computed. This procedure was repeated 104 times using random subsets each time. The values obtained in all of them for each statistical parameter have Gaussian distributions centered in the true mean, dispersion or percentile value. The width of each distribution provides an estimation of its uncertainty. The values thus obtained are listed in Table 4, where the fields are ordered by their distance to the center (see Section 2) given in column 2. Uncertainties are smaller for better sampled fields, as expected. The RGB sample studied in the LMC bar by Cole et al. (2005) has been also analysed in the same way and the results are also listed in Table 4. Since their CaT index is equivalent to ours, as was demonstrated in Paper III, we used their index to calculate the metallicities from Equation 3.
The mean metallicity values in the inner 7 kpc are similar within the uncertainties but are lower than -0.8 dex beyond this radius suggesting the presence of a gradient. The computed 10th and 90th percentile values provide further insight into the possible presence of a gradient. They are listed in columns 5 and 6 of Table 4, and have been plotted in Figure 8 as a function of radius. The 10th percentile value (filled symbols), account for the most metal-poor regime and have similar values in all disk fields and in the bar within the uncertainties. The 90th percentile values (open symbols) which account for the most metal-rich populations, are however, constant within the inner 7 kpc, but decrease from this point on, indicating a metallicity gradient in the most metal-rich populations outwards of 7 kpc. The implications of this gradient are discussed in depth in Section 8.
7.2 Age-Metallicity Relationships
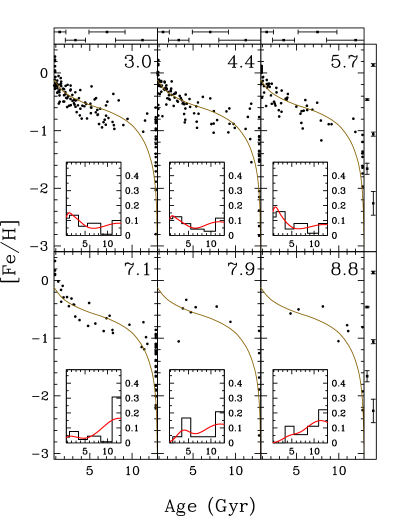
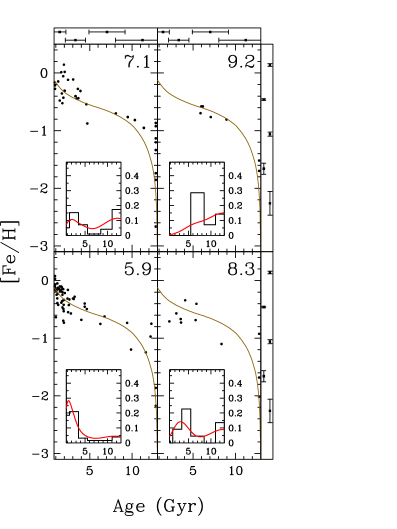
We will further investigate the nature of the changes in the spatial metallicity distribution with the help of the AMRs of each field. In spite of the large uncertainties of the individual age determinations presented in Section 6, the AMRs are useful to characterise the general trend of the run of metallicity with age. The AMR for each field is plotted in Figures 9 and 10. The many stars with the same age that appear both at the old and young limits result from the method degeneracy. As discussed in Paper II and in Carrera et al. (2008b), our procedure to estimate ages saturates for values older than 10 Gyr, so we can only give 10 Gyr as a lower limit for older stars. We assume for them an age of 12.9 Gyr, the age of the oldest globular cluster observed in our galaxy (Salaris & Weiss, 2002, NGC 6426, ). In the case of the youngest stars in our sample, stellar evolution models indicate that the region in which we selected the observed stars is not populated by objects younger than 0.8 Gyr. Therefore, although equations used to estimate ages can formally lead to ages younger than this value, we assign them an age of 0.8 Gyr.
All fields studied, independently of their distance to the center, show a rapid chemical enrichment reaching [Fe/H]-1 in the first 2–3 Gyr. After this, the metallicity increased steadily but moderately until around 3 Gyr ago, thus increasing another 0.5 dex in about 7 Gyr. This period corresponds with the age-gap observed in the clusters (e.g. Grocholski et al., 2006; Sharma et al., 2010) and with a period of lower star formation rate observed in the field (e.g. Meschin et al., 2011). Finally, another episode of rapid chemical enrichment in the last 3 Gyr is only observed in fields inner to 7 kpc. In fact, we do not find stars younger than 3 Gyr in our sample in the outermost fields despite the fact that these are among the most common on the innermost fields. The two periods of chemical enrichment at old and young ages are also observed in the clusters (e.g. Olszewski et al., 1991). We refer the reader to Paper II for a detailed comparison among clusters, bar, and disk AMRs. In Paper II, we performed a test to check that the AMRs of the fields studied there are statistically indistinguishable among them. Due to the small number of stars confirmed as LMC member in the outermost fields studied here, a test is not adequate in this case and we will restrict ourselves to a qualitative comparison among the AMRs of the different fields. To help with this comparison, we have plotted in Figures 9 and 10 one of the chemical evolution models derived in Paper II that reproduces adequately the observed AMRs. This model was computed assuming a rate of gas outflow of 2.5 (see Paper II for details)777This model has been recomputed with the metallicity scale used in this paper.. The AMRs of all fields are well reproduced by this model and therefore we feel confident that the chemical enrichment has proceded in a similar way in all the studied fields.
Inset panels of Figures 9 and 10 show the age distribution of the stars measured on each field, with and without taking into account the age uncertainty (solid line and histogram, respectively; see Paper II for details). In the innermost fields there are two peaks which correspond to the two periods of faster chemical enrichment. The amount of stars younger than 5 Gyr gradually decreases with increasing radius. Since the younger stars are also more metal-rich, the metallicity gradient observed in the outer disk may be explained by the gradual increase of the age of the youngest populations with radius.
7.3 Kinematics of the LMC RGBs
The kinematics of the LMC has been studied by many authors using different tracers (see van der Marel et al., 2009, for a review). There is agreement among workers that all tracers studied describe a similar cold disk kinematics but with different rotational velocities for each of them: 61 km s-1 for the carbon stars (van der Marel et al., 2002); 80 km s-1 for H I gas (Olsen & Massey, 2007); and 107 km s-1 for red supergiants (Olsen & Massey, 2007). It is also known that the velocity dispersion, related to the disk scale height, increases from the youngest (Olsen & Massey, 2007, red supergiants 9 km s-1,) to the oldest populations (Borissova et al., 2006; Minniti et al., 2003, RR Lyrae stars 50 km s-1,). The fact that the oldest populations have the highest velocity dispersion suggests the possibility that they may be distributed in a halo similar to that of the MW (e.g. Minniti et al., 2003; Borissova et al., 2006)
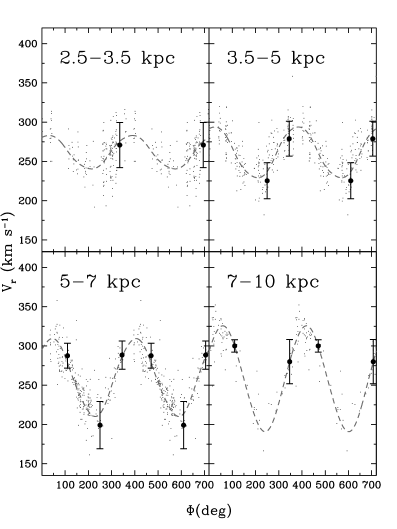
Our sample of almost 500 RGB stars studied in an homogeneous way covers a large range of angular distances. Larger samples have been studied but always at lower galactocentric radius (e.g. Zhao et al., 2003; Cole et al., 2005). In Figure 11 we have plotted the velocities of the RGB stars studied here versus position angle for different galactocentric radius (filled circles). Our RGB sample is well reproduced by the kinematical rotational disk model derived by van der Marel et al. (2002) for carbon stars (dashed line). In Figure 11 the carbon stars data (dots) from Kunkel et al. (1997) and Hardy (2010) have also been plotted as comparison. The velocity dispersion of the RGB sample studied here (=24.10.2 km s-1) is slightly larger than that of the carbon stars (=20.20.5 km s-1). Our result is in very good agreement with other analysis of LMC field RGB by Zhao et al. (2003, =24 km s-1,) and Cole et al. (2005, =24.70.4 km s-1,).
Since RGBs have a wide range of metallicities and ages, we can compare the velocity dispersion of different ages/metallicities, which provides information about the scale height of different populations. In fact, if a classical halo formed by old, metal-poor, high-velocity dispersion objects existed in the LMC, a dependence between the velocity dispersion and metallicity might be observed. To investigate this we have compared the velocity dispersion in different metallicity bins. The mean velocity of each field was subtracted from the radial velocity of each star to eliminate the rotational component, as in Paper II. Then, we divided the metallicity range in 4 bins and computed the velocity dispersion of each of them by fitting a Gaussian to the velocity distribution. The number of objects and velocity dispersion in each metallicity bin are listed in Table 5. It can be noted that the velocity dispersion increases as metallicity decreases, or age increases. This agrees with the fact found by other authors that the velocity dispersion increases from the youngest population to the oldest ones (e.g. Olsen & Massey, 2007; van der Marel et al., 2009). The velocity dispersion of our most metal-poor, and therefore older, bin is =26.81.4 km s-1 based on 45 objects. This value, similar to that found in Paper II from a smaller sample, is lower than the dispersion found by Cole et al. (2005) for the most metal-poor RGBs in the bar, =40.81.7 km s-1 based only on 18 stars. Although we believe that we are sampling the most metal-poor/oldest populations, we do not find evidences that they belong to a hot halo. Borissova et al. (2006) (see also Minniti et al., 2003) found =502 km s-1 for a sample of RR Lyrae in the center of the LMC. These values are significantly higher than the value found here for the most metal-poor stars. These larger velocity dispersions have been quoted as evidence for the presence of a classical halo. However, this is still an open question since most RR Lyrae have an exponential surface density distribution with a similar scale length as other well known tracers of the disk (Alves, 2004; Subramaniam & Subramanian, 2009), and only a small fraction, 10%, is likely to trace the extended halo of the LMC (Subramaniam & Subramanian, 2009).
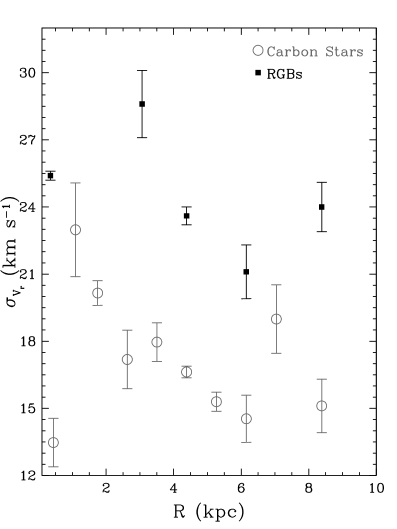
The galactocentric distance covered by our sample also allows us to investigate the behaviour of the velocity dispersion as a function of radius. This is a key analysis to investigate the stability of the disk and, to our knowledge, this is the first time it is done in the LMC. As before, the velocity dispersion in four radial annuli has been computed by fitting a Gaussian to the rotational-free velocities of stars in each of them. The obtained values, together with the number of objects in each annulus, are listed in Table 6 and plotted as filled squares in Figure 12. The velocity dispersion decreases with radius with the exception of the outermost annulus studied. As comparison, we obtained in the same way the velocity dispersion of the Bar from the sample presented by Cole et al. (2005). The Bar has a smaller dispersion than the innermost disk annulus analysed. Since our sample is not well distributed in angular distances, we have also calculated the velocity dispersion as a function of radius for the carbon stars sample described above (open circles). As in the case of the RGBs, the velocity dispersion decreases with radius if we exclude the central area. The behaviour in the outermost annulus studied may not be reliable because of the small number of objects studied at this galactocentric distance. The implications of these results are discussed in depth in the following section.
8 Discussion
8.1 Age and Metallicity Gradients in the LMC
The spatial distribution of our fields allows us to investigate the presence of age and/or metallicity gradients in the field populations of the LMC. In the 4 fields studied in Paper I, located at galactocentric distances from 3 to 7 kpc, we found that while the oldest populations are coeval in all fields, the age of the youngest component gradually increases with radius. With the new data, we confirm that the trend continues at larger galactocentric distances (9 kpc). If we assume that the youngest stars were formed in-situ (e.g. there is no significant stellar migration), we are observing an outside-in quenching of star formation at recent times.
This age gradient observed across the LMC disk is not accompanied by a gradient in the mean metallicity, which it is observed only for R6 kpc. A gradient in the metallicity in the youngest objects cannot be excluded with our observations since they do not have counterparts in the red giant branch. However, the fact that the AMR is so similar at all radii points to a similar history of metal enrichment across the whole LMC disk. In this context, a gradient in the mean metallicity of different fields would be mainly related to a varying proportion of stars of different ages in different fields. A similar trend of metallicity with radius has been found by Feast et al. (2010) for AGB stars (but see also Cioni, 2009). Recent studies in clusters also show hints of a possible metallicity gradient in the outer disk (Figure 16 of Sharma et al., 2010). However, the small number of clusters at these outer distances prevents them from extracting further conclusions.
A dynamical bar, as that observed in the LMC, might be able to mix the stellar content of a disk within a certain radius (Friedli et al., 1994; Zaritsky et al., 1994). Therefore this result might put a constrain to the mixing produced by the LMC bar. The age gradient observed at R6 kpc can be explained by the fact that the galaxy has not had enough time to mix populations younger than 1 Gyr. It is expected that the stellar content of the LMC is well mixed in a few crossing times. At a distance of 6 kpc, the crossing time888This value has been computed from the (e.g. Binney & Tremaine, 1987) using a velocity dispersion of =24.1 km s-1 derived in previous section. is 2 yr which is in agreement with what observed.
The mean metallicity of the most metal-rich objects in each field gradually decreases with the galactocentric distance from R6 kpc. This trend is due to an increase of the age of the youngest population in each field with radius, because the chemical enrichment history has been the same over the LMC disk. A similar trend has been also observed in the M33 outer disk (Barker et al., 2007). Taylor et al. (2005) studied the behaviour of color with radius in a sample of irregular and late-type spiral galaxies finding that these galaxies became redder with increasing radius which is also interpreted as the existence of an age gradient. This agrees with an outside-in disk evolution scenario proposed in Paper I for the LMC as opposed to the inside-out scenario predicted by CDM cosmology (White & Frenk, 1991; Mo et al., 1998) and observed in more massive early-type spirals (e.g. Trujillo & Pohlen, 2005). This outside-in disk evolution scenario is qualitatively similar to that predicted by Stinson et al. (2009) for dwarf galaxies and observed in several Local Group dwarfs in the LCID project (e.g. Hidalgo et al., 2009). However, for a galaxy like the LMC, the Stinson et al. (2009) models predict an inside-out scenario. This may put constraints to the mechanisms that shape the radial distribution of stellar populations in galaxies of intermediate mass such as the LMC.
It is well known that the LMC forms an interacting system with the SMC and the MW at the moment. However it is not clear if the same has happened in the past. New dynamical models, based on accurate proper motions (Kallivayalil et al., 2006; Piatek et al., 2008), suggest that the Magellanic Clouds are unbound and they might be in their first passage around the Milky Way (Besla et al., 2007). Repeated encounters with one or more external systems might have erased, or at least weakened, any gradient. The results of this paper tend to support an evolution of the LMC in a more isolated environment.
8.2 Kinematics of the RGB Field Populations
Our RGB sample has rotational cold disk kinematics similar to that of carbon stars. The velocity dispersion is =24.10.2 km s-1. It increases from most metal-rich/youngest stars, =20.91.2 km s-1, to the most metal-poor/oldest ones, =26.81.4 km s-1. Other tracers have a similar behaviour (see van der Marel et al., 2009, for a review). Therefore, the scale height of the LMC disk increases with time. However, even for the most metal-poor/oldest objects there are not evidences of the presence of a classical hot halo. In fact, recent works indicate that the LMC disk extends, at least, to a distance of 12-14 kpc (Majewski et al., 2009; Saha et al., 2010).
The velocity dispersion of disk RGBs decreases with increasing galactocentric radius, except for those objects in the bar region, which have a lower velocity dispersion than those in the inner disk. Carbon stars have a similar trend. From pioneering works in the disk of spiral galaxies it is well known that the velocity dispersion decreases with increasing radius (e.g. Bottema, 1993). The same trend has been also found in the only two disk irregular galaxies studied until now to our knowledge: NGC 2552 (Swaters, 1999); and NGC 4449 (Hunter et al., 2005). This trend is easily explained by the decreases of stellar density with galactocentric distance if the scale height remains constant with radius, as is observed in most disk galaxies (van der Kruit & Searle, 1981). The fact that the velocity dispersion is lower in the bar than in the innermost disk is a feature also observed in at least one half of barred spirals (e.g. Chung & Bureau, 2004). The velocity dispersion increase observed in the outermost radius studied can be interpreted as a thickening in the external disk due to dynamical interactions with the MW (Weinberg, 2000). However the small number of objects confirmed as LMC members as this galactocentric distance prevents us from extracting further conclusions.
9 Summary
In this paper we have presented deep CMDs for 6 fields in the outer LMC disk, covering different distances, 5.9 kpcR9.2 kpc, and azimuths. Using CaT spectroscopy we have derived stellar metallicities for a sample of RGB stars in these fields, which have been analysed together with those stars studied in Paper II. In total, including those studied in Paper II, our sample has 497 disk RGB stars confirmed as LMC members from their radial velocity, covering a galactocentric radius from 3.0 to 9.5 kpc and different position angles. The main results of this paper are:
-
•
The comparison of the CMDs with isochrones shows that the age of the youngest populations gradually increases with radius. This is a continuation of the trend found in Paper I for inner fields.
-
•
The small number of stars confirmed as LMC members in the outermost fields (R7 kpc) does not allow a detailed analysis of the metallicity distributions of these fields. A statistical analysis shows that the 10th percentile of the metallicity distribution, which accounts for the most metal-poor populations, does not show a clear trend with radius within the errors. Therefore, we may conclude that the most metal-poor, and old, population is similar in all of them. On the contrary, the 90th percentile, indicative of the most metal–rich populations, remains constant in the inner 6 kpc, and gradually decreases from that point on. This result, which is independent of the position angle, may be explained by the gradual increase of the age of the youngest populations with galactocentric distance.
-
•
As in Paper II, we have estimated the ages of the observed stars from the combination of spectroscopic metallicities, and positions of the stars in the CMD. This allows us to obtain the AMR for each field. It is consistent with a chemical enrichment that has been similar in all studied fields as was found in Paper II for inner fields: i.e. coeval stars would have the same metallicity everywhere in the LMC disk.
-
•
Our RGB sample has a rotational cold disk kinematics similar to that inferred from carbon stars, with a velocity dispersion of =24.10.2 km s-1. The velocity dispersion increases from most metal-rich/youngest stars, =20.91.2 km s-1, to the most metal-poor/oldest ones, =26.81.4 km s-1 as has been observed for other kinematical tracers (see van der Marel et al., 2009, for a review). However, even for the most metal-poor/oldest objects there is not evidence of the presence of a classical hot halo.
References
- Alves (2004) Alves, D. R. 2004, ApJ, 601, L151
- Aparicio & Gallart (2004) Aparicio, A., & Gallart, C. 2004, AJ, 128, 1465
- Barker et al. (2007) Barker, M. K., Sarajedini, A., Geisler, D., Harding, P., & Schommer, R. 2007, AJ, 133, 1138
- Battaglia et al. (2008) Battaglia, G., Irwin, M., Tolstoy, E., Hill, V., Helmi, A., Letarte, B., & Jablonka, P. 2008, MNRAS, 383, 183
- Bertelli et al. (1992) Bertelli, G., Mateo, M., Chiosi, C., & Bressan, A. 1992, ApJ, 388, 400
- Besla et al. (2007) Besla, G., Kallivayalil, N., Hernquist, L., Robertson, B., Cox, T. J., van der Marel, R. P., & Alcock, C. 2007, ApJ, 668, 949
- Besla et al. (2010) Besla, G., Kallivayalil, N., Hernquist, L., van der Marel, R. P., Cox, T. J., & Kere , D. 2010, ApJ, 721, L97
- Binney & Tremaine (1987) Binney, J., & Tremaine, S. 1987, Princeton, NJ, Princeton University Press, 1987, 747 p.,
- Borissova et al. (2006) Borissova, J., Minniti, D., Rejkuba, M., & Alves, D. 2006, A&A, 460, 459
- Bottema (1993) Bottema, R. 1993, A&A, 275, 16
- Bragaglia et al. (2001) Bragaglia, A., et al. 2001, AJ, 121, 327
- Carrera et al. (2007) Carrera, R., Gallart, C., Pancino, E., & Zinn, R. 2007, AJ, 134, 1298, Paper III
- Carrera et al. (2008a) Carrera, R., Gallart, C., Hardy, E., Aparicio, A., & Zinn, R. 2008a, AJ, 135, 836, Paper II
- Carrera et al. (2008b) Carrera, R., Gallart, C., Aparicio, A., Costa, E., Méndez, R. A., & Noël, N. E. D. 2008b, AJ, 136, 1039
- Carrera & Pancino (2011) Carrera, R. & Pancino, E. 2011, A&A, submitted
- Carretta & Gratton (1997) Carretta, E., & Gratton, R. G. 1997, A&AS, 121, 95, CG97
- Carretta et al. (2007) Carretta, E., Bragaglia, A., & Gratton, R. G. 2007, A&A, 473, 129
- Carretta et al. (2009) Carretta, E., Bragaglia, A., Gratton, R., D’Orazi, V., & Lucatello, S. 2009, A&A, 508, 695, C09
- Castro et al. (2001) Castro, R., Santiago, B. X., Gilmore, G. F., Beaulieu, S., & Johnson, R. A. 2001, MNRAS, 326, 333
- Chung & Bureau (2004) Chung, A., & Bureau, M. 2004, AJ, 127, 3192
- Cioni (2009) Cioni, M.-R. L. 2009, A&A, 506, 1137
- Cole et al. (2000) Cole, A. A., Smecker-Hane, T. A., & Gallagher, J. S., III 2000, AJ, 120, 1808
- Cole et al. (2005) Cole, A. A., Tolstoy, E., Gallagher, J. S., III, & Smecker-Hane, T. A. 2005, AJ, 129, 1465
- de Jong (1996) de Jong, R. S. 1996, A&A, 313, 377
- Feast et al. (2010) Feast, M. W., Abedigamba, O. P., & Whitelock, P. A. 2010, MNRAS, 408, L76
- Ferguson et al. (2007) Ferguson, A., Irwin, M., Chapman, S., Ibata, R., Lewis, G., & Tanvir, N. 2007, Island Universes - Structure and Evolution of Disk Galaxies, 239
- Friedli et al. (1994) Friedli, D., Benz, W., & Kennicutt, R. 1994, ApJ, 430, L105
- Friel et al. (2010) Friel, E. D., Jacobson, H. R., & Pilachowski, C. A. 2010, AJ, 139, 1942
- Gadotti & dos Anjos (2001) Gadotti, D. A., & dos Anjos, S. 2001, AJ, 122, 1298
- Gallart et al. (2004) Gallart, C., Stetson, P. B., Hardy, E., Pont, F., & Zinn, R. 2004, ApJ, 614, L109
- Gallart et al. (2008) Gallart, C., Stetson, P. B., Meschin, I. P., Pont, F., & Hardy, E. 2008, ApJ, 682, L89, Paper I
- Gonzalez & Wallerstein (2000) Gonzalez, G., & Wallerstein, G. 2000, PASP, 112, 1081
- Grocholski et al. (2006) Grocholski, A. J., Cole, A. A., Sarajedini, A., Geisler, D., & Smith, V. V. 2006, AJ, 132, 1630
- Hardy (2010) Hardy, E. 2010, private comunication
- Harris & Zaritsky (2009) Harris, J., & Zaritsky, D. 2009, AJ, 138, 1243
- Helmi et al. (2006) Helmi, A., et al. 2006, ApJ, 651, L121
- Hidalgo et al. (2009) Hidalgo, S. L., Aparicio, A., Martínez-Delgado, D., & Gallart, C. 2009, ApJ, 705, 704
- Hidalgo et al. (2011) Hidalgo, S. L., et al. 2011, ApJ, 730, 14
- Holtzman et al. (1999) Holtzman, J. A., et al. 1999, AJ, 118, 2262
- Hunter et al. (2005) Hunter, D. A., Rubin, V. C., Swaters, R. A., Sparke, L. S., & Levine, S. E. 2005, ApJ, 634, 281
- Hunter & Elmegreen (2006) Hunter, D. A., & Elmegreen, B. G. 2006, ApJS, 162, 49
- Ibata et al. (2005) Ibata, R., Chapman, S., Ferguson, A. M. N., Lewis, G., Irwin, M., & Tanvir, N. 2005, ApJ, 634, 287
- Jacobson et al. (2009) Jacobson, H. R., Friel, E. D., & Pilachowski, C. A. 2009, AJ, 137, 4753
- Kallivayalil et al. (2006) Kallivayalil, N., van der Marel, R. P., Alcock, C., Axelrod, T., Cook, K. H., Drake, A. J., & Geha, M. 2006, ApJ, 638, 772
- Kunkel et al. (1997) Kunkel, W. E., Demers, S., Irwin, M. J., & Albert, L. 1997, ApJ, 488, L129
- Majewski et al. (2009) Majewski, S. R., Nidever, D. L., Mu oz, R. R., Patterson, R. J., Kunkel, W. E., & Carlin, J. L. 2009, IAU Symposium, 256, 51
- Minniti et al. (2003) Minniti, D., Borissova, J., Rejkuba, M., Alves, D. R., Cook, K. H., & Freeman, K. C. 2003, Science, 301, 1508
- Melo et al. (2009) Melo, C., Smoker, J., Marconi, G., & Dumas, C. 2009, VLT-MAN-ESO-13700-4034
- Meschin et al. (2011) Meschin, I., et al. 2011, in preparation
- Mo et al. (1998) Mo, H. J., Mao, S., & White, S. D. M. 1998, MNRAS, 295, 319
- Olsen (1999) Olsen, K. A. G. 1999, AJ, 117, 2244
- Olsen & Massey (2007) Olsen, K. A. G., & Massey, P. 2007, ApJ, 656, L61
- Olszewski et al. (1991) Olszewski, E. W., Schommer, R. A., Suntzeff, N. B., & Harris, H. C. 1991, AJ, 101, 515
- Olszewski et al. (1996) Olszewski, E. W., Suntzeff, N. B., & Mateo, M. 1996, ARA&A, 34, 511
- Pancino et al. (2010) Pancino, E., Carrera, R., Rossetti, E., & Gallart, C. 2010, A&A, 511, A56
- Piatek et al. (2008) Piatek, S., Pryor, C., & Olszewski, E. W. 2008, AJ, 135, 1024
- Pietrinferni et al. (2004) Pietrinferni, A., Cassisi, S., Salaris, M., & Castelli, F. 2004, ApJ, 612, 168
- Pompéia et al. (2008) Pomp ia, L., et al. 2008, A&A, 480, 379
- Randich et al. (2003) Randich, S., Sestito, P., & Pallavicini, R. 2003, A&A, 399, 133
- Roškar et al. (2008) Roškar, R., Debattista, V. P., Stinson, G. S., Quinn, T. R., Kaufmann, T., & Wadsley, J. 2008, ApJ, 675, L65
- Saha et al. (2010) Saha, A., et al. 2010, AJ, 140, 1719
- Salaris & Weiss (2002) Salaris, M., & Weiss, A. 2002, A&A, 388, 492
- Sánchez-Blázquez et al. (2011) Sánchez-Blázquez, P., Ocvirk, P., Gibson, B. K., Pérez, I., & Peletier, R. F. 2011, MNRAS, 822
- Schaye (2004) Schaye, J. 2004, ApJ, 609, 667
- Schlegel et al. (1998) Schlegel, D. J., Finkbeiner, D. P., & Davis, M. 1998, ApJ, 500, 525
- Sharma et al. (2010) Sharma, S., Borissova, J., Kurtev, R., Ivanov, V. D., & Geisler, D. 2010, AJ, 139, 878
- Smecker-Hane et al. (2002) Smecker-Hane, T. A., Cole, A. A., Gallagher, J. S., III, & Stetson, P. B. 2002, ApJ, 566, 239
- Starkenburg et al. (2010) Starkenburg, E., et al. 2010, A&A, 513, A34
- Stetson (1994) Stetson, P. B. 1994, PASP, 106, 250
- Stetson (2000) Stetson, P. B. 2000, PASP, 112, 925
- Stinson et al. (2009) Stinson, G. S., Dalcanton, J. J., Quinn, T., Gogarten, S. M., Kaufmann, T., & Wadsley, J. 2009, MNRAS, 395, 1455
- Subramaniam & Subramanian (2009) Subramaniam, A., & Subramanian, S. 2009, A&A, 503, L9
- Swaters (1999) Swaters, R. A. 1999, Ph.D. Thesis, Rijksuniv. Groningen
- Tautvaišienė et al. (2005) Tautvai ienė, G., Edvardsson, B., Puzeras, E., & Ilyin, I. 2005, A&A, 431, 933
- Taylor et al. (2005) Taylor, V. A., Jansen, R. A., Windhorst, R. A., Odewahn, S. C., & Hibbard, J. E. 2005, ApJ, 630, 784
- Trujillo & Pohlen (2005) Trujillo, I., & Pohlen, M. 2005, ApJ, 630, L17
- van der Marel (2001) van der Marel, R. P. 2001, AJ, 122, 1827
- van der Marel & Cioni (2001) van der Marel, R. P., & Cioni, M.-R. L. 2001, AJ, 122, 1807
- van der Marel et al. (2002) van der Marel, R. P., Alves, D. R., Hardy, E., & Suntzeff, N. B. 2002, AJ, 124, 2639
- van der Marel et al. (2009) van der Marel, R. P., Kallivayalil, N., & Besla, G. 2009, IAU Symposium, 256, 81
- van der Kruit & Searle (1981) van der Kruit, P. C., & Searle, L. 1981, A&A, 95, 105
- van der Kruit (1987) van der Kruit, P. C. 1987, A&A, 173, 59
- van der Kruit & Freeman (2011) van der Kruit, P. C., & Freeman, K. C. 2011, ARA&A, in press: arXiv:1101.1771
- Weinberg (2000) Weinberg, M. D. 2000, ApJ, 532, 922
- Williams et al. (2009) Williams, B. F., Dalcanton, J. J., Dolphin, A. E., Holtzman, J., & Sarajedini, A. 2009, ApJ, 695, L15
- White & Frenk (1991) White, S. D. M., & Frenk, C. S. 1991, ApJ, 379, 52
- Yong et al. (2005) Yong, D., Carney, B. W., & Teixera de Almeida, M. L. 2005, AJ, 130, 597
- Zaritsky et al. (1994) Zaritsky, D., Kennicutt, R. C., Jr., & Huchra, J. P. 1994, ApJ, 420, 87
- Zhao et al. (2003) Zhao, H., Ibata, R. A., Lewis, G. F., & Irwin, M. J. 2003, MNRAS, 339, 701


| ID | aaAngular coordinates over the celestial sphere (see text for details). | P. A.aaAngular coordinates over the celestial sphere (see text for details). | E(B-V) | bbDe-projected radius calculated assuming =347 and =1893. | ccfootnotemark: | ||
|---|---|---|---|---|---|---|---|
| LMC0512-6648 | 05h12m | -66°48′ | 34 | 3330 | 0.10 | 35 | 3.0 |
| LMC0514-6503 | 05h14m | -65°03′ | 50 | 3433 | 0.05 | 50 | 4.4 |
| LMC0513-6333 | 05h13m | -63°33′ | 65 | 3454 | 0.04 | 65 | 5.7 |
| LMC0422-7100 | 04h22m | -71°00′ | 56 | 2507 | 0.08 | 68 | 5.9 |
| LMC0513-6159 | 05h13m | -61°59′ | 80 | 3476 | 0.03 | 80 | 7.1 |
| LMC0649-7110 | 06h49m | -71°10′ | 69 | 1103 | 0.13 | 80 | 7.1 |
| LMC0512-6100 | 05h12m | -61°00′ | 90 | 3478 | 0.03 | 90 | 7.9 |
| LMC0356-7100 | 03h56m | -71°00′ | 77 | 2509 | 0.09 | 93 | 8.3 |
| LMC0511-6000 | 05h11m | -60°00′ | 100 | 3480 | 0.03 | 100 | 8.8 |
| LMC0714-7100 | 07h14m | -71°00′ | 89 | 1097 | 0.19 | 104 | 9.2 |
| Ca | B or V | I | Vr (km s-1) | (km s-1) | Comments | |||
|---|---|---|---|---|---|---|---|---|
| 04:23:02.04 | -70:58:51.0 | 8.218 | 0.262 | 19.9325 | 17.9836 | 239.6648 | 2.880 | Low S/N |
| 04:22:52.95 | -70:57:00.3 | 8.605 | 0.147 | 19.4462 | 16.8805 | 251.9283 | 1.260 | |
| 04:23:25.27 | -70:56:16.2 | 7.839 | 0.120 | 18.9702 | 16.4791 | 241.2483 | 1.494 | |
| 04:22:21.24 | -70:55:42.2 | 7.565 | 0.203 | 19.8558 | 17.7160 | 225.6490 | 2.196 | |
| 04:23:00.06 | -70:54:18.2 | 8.422 | 0.102 | 19.3202 | 16.9670 | 214.9008 | 1.587 |
| Cluster | W’V | W’I | [Fe/H]CG97 | [Fe/H]C09 | Reference |
|---|---|---|---|---|---|
| NGC 104 | 6.940.01 | 6.230.01 | -0.670.05 | -0.760.02 | 1 |
| NGC 188 | 8.170.07 | 7.270.08 | -0.070.04 | +0.010.08 | 2 |
| NGC 288 | 5.510.01 | 5.040.01 | -1.070.03 | -1.320.02 | 1 |
| NGC 362 | 6.010.01 | -1.090.03 | -1.300.04 | 1 | |
| NGC 1851 | 5.940.03 | 5.240.04 | -1.030.06 | -1.180.08 | 1 |
| NGC 1904 | 4.910.03 | -1.370.05 | -1.580.02 | 1 | |
| Be 20 | 6.860.03 | 6.390.03 | -0.490.05 | -0.490.05 | 3 |
| NGC 2141 | 8.330.01 | 7.670.02 | -0.140.05 | +0.000.16 | 4 |
| Cr 110 | 8.210.04 | 7.740.06 | +0.030.02 | 5 | |
| NGC 2298 | 3.750.03 | 3.090.03 | -1.740.04 | -1.960.04 | 1 |
| Melote 66 | 7.690.03 | 6.900.03 | -0.380.06 | -0.330.03 | 3 |
| Be 39 | 8.210.04 | 7.270.06 | -0.210.01 | 6 | |
| NGC 2682 | 8.240.01 | 7.480.01 | -0.030.03 | +0.050.02 | 5 |
| NGC 3201 | 5.460.03 | 4.760.02 | -1.230.05 | -1.510.02 | 1 |
| NGC 4590 | 2.840.02 | 2.190.06 | -1.990.03 | -2.270.04 | 1 |
| NGC 5927 | 7.810.01 | 6.920.01 | -0.290.07 | 1 | |
| NGC 6352 | 7.100.01 | 6.310.01 | -0.640.06 | -0.620.05 | 1 |
| NGC 6528 | 8.280.04 | 7.580.04 | -0.170.02 | +0.070.08 | 1 |
| NGC 6681 | 5.050.03 | 4.490.07 | -1.350.03 | -1.620.08 | 1 |
| NGC 6705 | 8.950.07 | 8.280.12 | +0.070.05 | +0.070.07 | 7 |
| NGC 6715 | 4.860.03 | 4.300.03 | -1.250.06 | -1.440.07 | 1 |
| NGC 6791 | 9.780.09 | 8.770.09 | +0.470.04 | +0.470.04 | 8 |
| NGC 6819 | 8.410.04 | 7.640.04 | +0.070.03 | +0.090.03 | 9 |
| NGC 7078 | 2.780.01 | 2.180.01 | -2.120.04 | -2.330.02 | 1 |
| NGC 7789 | 8.470.02 | 7.610.02 | -0.040.05 | -0.040.05 | 10 |
| ID | [Fe/H] | [Fe/H]90th | [Fe/H]10th | N∗ | ||
|---|---|---|---|---|---|---|
| Bar | 0.3 | -0.400.07 | 0.350.07 | –0.250.12 | –1.250.30 | 373 |
| LMC0512-6648 | 3.0 | –0.580.09 | 0.470.07 | –0.090.09 | –1.380.28 | 130 |
| LMC0514-6503 | 4.4 | –0.640.10 | 0.540.11 | –0.090.10 | –1.710.44 | 110 |
| LMC0513-6333 | 5.7 | –0.540.11 | 0.480.07 | –0.010.08 | –1.570.17 | 69 |
| LMC0422-7100 | 5.9 | –0.430.09 | 0.390.14 | –0.090.07 | –1.090.48 | 63 |
| LMC0513-6159 | 7.1 | –1.030.13 | 0.640.10 | –0.270.16 | –2.170.25 | 65 |
| LMC0649-7110 | 7.1 | –0.740.14 | 0.620.15 | –0.100.15 | –1.790.14 | 24 |
| LMC0512-6100 | 7.9 | –1.040.30 | 0.700.25 | –0.420.15 | –1.960.47 | 12 |
| LMC0356-7100 | 8.3 | –0.870.23 | 0.560.16 | –0.480.08 | –2.070.25 | 12 |
| LMC0511-6000 | 8.8 | –0.990.37 | 0.200.10 | –0.710.10 | –1.630.47 | 6 |
| LMC0714-7100 | 9.2 | –0.850.22 | 0.350.23 | –0.710.07 | –1.750.14 | 7 |
| [Fe/H] | Age (Gyr) | N∗ | |
|---|---|---|---|
| –0.25 to +0.5 | 2 | 117 | 20.91.2 |
| –0.75 to –0.25 | 2-6 | 212 | 21.80.9 |
| –1.5 to –0.75 | 6-10 | 122 | 26.21.1 |
| –3.5 to –1.5 | 10 | 45 | 26.81.4 |
| R (kpc) | N∗ | |
|---|---|---|
| Bar | 374 | 25.40.2aaValue obtained from Cole et al. (2005) data following the same procedure than for our sample. This value is similar to that obtained in the original work of 24.70.4 km s-1. |
| 2.5–3.5 | 130 | 28.61.5 |
| 3.5–5 | 172 | 23.60.4 |
| 5–7 | 138 | 21.11.2 |
| 7–10° | 56 | 24.01.1 |