The evolution of quiescent galaxies at high redshifts ( z 1.4)
Abstract
The goal of this work is to study the evolution of high redshift () quiescent galaxies over an effective area of deg2 in the COSMOS field. Galaxies have been divided according to their star-formation activity and the evolution of the different populations, in particular of the quiescent galaxies, has been investigated in detail. We have studied an IRAC (22.0) selected sample of 18000 galaxies at z 1.4 in the COSMOS field with multi-wavelength coverage extending from the U band to the Spitzer 24 m one. We have derived accurate photometric redshifts () through a SED-fitting procedure. Other important physical parameters (masses, ages and star formation rates (SFR)) of the galaxies have been obtained using Maraston (2005) models. We have divided our sample into actively star-forming, intermediate and quiescent galaxies depending on their specific star formation rate (). We have computed the galaxy stellar mass function (GSMF) of the total sample and the different populations at . We have studied the properties of high redshift quiescent galaxies finding that they are old ( Gyr), massive (M⊙), weakly star forming stellar populations with low dust extinction (E(B-V) 0.15) and small e-folding time scales ( Gyr). We observe a significant evolution of the quiescent stellar mass function from to , increasing by dex in this redshift interval. We find that is an epoch of transition of the GSMF: while the GSMF at is dominated by the star-forming galaxies at all stellar masses, at the contribution to the total GSMF of the quiescent galaxies is significant and becomes higher than that of the star-forming population for M⊙. The fraction of star-forming galaxies decreases from to from to for M⊙, while the quiescent population increases from to at the same redshift and mass intervals. We compare the fraction of quiescent galaxies derived with that predicted by theoretical models and find that the Kitzbichler White (2007) model, implemented on the Millennium Simulation, is the one that better reproduces the shape of the data. Finally, we calculate the stellar mass density of the star-forming and quiescent populations as a function of redshift and find that there is already a significant number of quiescent galaxies at ( M⊙Mpc-3), meaning that efficient star formation had to take place before that time.
keywords:
galaxies: evolution - galaxies: high-redshift - galaxies: star formation1 Introduction
Understanding the processes that regulate stellar mass growth in galaxies as well as tracing the history of galaxy star formation and mass assembly over the cosmic time (Lilly et al. 1996, Madau et al. 1996, Pozzetti et al. 1998, Dickinson et al. 2003) are among the most important and discussed topics in modern cosmology. During the last decade, extraordinary progress has been made in our comprehension of the formation and evolution of galaxies. Thanks to deep multi-wavelength surveys we are now able to observe large samples of distant galaxies, thus reducing cosmic variance and allowing us to study objects at early cosmic times.
In the present Universe, it is known that galaxies can be separated into two broad populations: passively evolving galaxies with red colors, also known as quiescent galaxies or early type galaxies (ETGs hereafter), and star-forming galaxies with blue colors (e.g., Baldry et al. 2004, Brinchmann et al. 2004). A similar division extends to at least (Bell et al. 2004, Willmer et al. 2006) and possibly to (Giallongo et al. 2005, Cirasuolo et al. 2007, Cassata et al. 2008).
ETGs are the most massive galaxies in the present day Universe and are characterized by simple and homogeneous properties (morphologies, colors, passively evolving stellar populations, scaling relations). As a consequence, they are a key population to investigate the stellar mass assembly of massive galaxies over the cosmic time (e.g., Renzini 2006). Gallazzi et al. (2006) studied the properties of local quiescent galaxies and, in particular, the color-magnitude and the Mg2- relation. They found that for high-mass elliptical galaxies the dispersion in age is small, while at the low mass end there is a tail towards younger ages, reflecting a shift in stellar growth towards less massive galaxies in recent epochs. Besides, they also argue that at increasing stellar mass there is also an increase in both total metallicity and Fe ratio, suggesting that massive early type galaxies formed in a relatively short time-scale. The stellar mass and ages of the passive ETGs at require precursors characterized by strong (Myr) and short-lived ( Gyr) starbursts occurring at (e.g., Cimatti 2009 and references therein).
Stellar mass assembly in galaxies subdivided by spectral and morphological types, as well as by star formation activity has been investigated at by many authors (e.g., Bundy et al. 2005, Franceschini et al. 2006, Pannella et al. 2006, Pozzetti et al. 2010). Cimatti (2006) studied the B-band luminosity function of ETGs since , finding that the amount of the evolution for the ETG population depends critically on the range of masses considered, i.e., most of the massive ETGs are already in place at 1, while the density is still increasing with time for lower masses. This means that more massive galaxies have older stellar populations and formed their stars earlier and more rapidly than low mass galaxies, in agreement with Gallazzi et al. (2006). Therefore, the downsizing pattern (Cowie et al., 1996) could be applied to the assembly process of ellipticals at . The downsizing trend is also confirmed by a recent work based on a spectroscopic sample up to in the COSMOS field (Pozzetti et al., 2010) that showed how the ETGs increase in number density with cosmic time faster for decreasing M. They also found that the number density of blue or spiral galaxies with M M⊙ remains almost constant, while the most extreme population of star-forming galaxies at intermediate/high mass is rapidly decreasing in number density with cosmic time. The authors suggest a transformation from blue active spiral galaxies of intermediate mass into blue quiescent and successively into red passive types with low specific star formation. This is in agreement with the result obtained by Faber et al. (2007) who concluded that most present-day E/S0 near arose from blue galaxies with ongoing star-formation that were quenched after and then migrated to the red sequence. The properties of nearby ETGs support a mixed scenario in which quenched galaxies enter the red sequence via wet, gas-rich mergers, followed by a limited number of dry, stellar mergers along the sequence. The evolution of the stellar mass function of the ETGs up to has also been studied by other authors ( e.g., Bell et al. 2004, Brown et al. 2007,Taylor et al. 2009, Nichol et al. 2007), finding a moderate increase in the number density of quiescent galaxies with cosmic time which is mass dependent.
At higher redshifts Arnouts et al. (2007) and Cirasuolo et al. (2007) found a rapid rise in the space density of massive red sequence galaxies from 2 to 1. These results are confirmed by Ilbert et al. (2010) who found that the stellar mass density of quiescent galaxies of all masses increases by 1.1 dex between and , while it evolves only by 0.3 dex between and . This trend is also confirmed by Fontana et al. (2009), who found that the fraction of quiescent galaxies increases from at 2 to at , and recently by Nicol et al. (2011), who found that the red sequence massive galaxies ( M⊙) increase in mass density by a factor from to 1.
Some groups have claimed the existence of a substantial population of massive galaxies at (e.g., Mobasher et al. 2004, Yan et al. 2006, Rodighiero et al. 2007, Fontana et al. 2009, Mancini et al. 2009). Marchesini et al. (2009) and Marchesini et al. (2010) found that the number density of most massive galaxies ( M⊙) seems to evolve very little from to , with a larger subsequent evolution down to . These results are broadly consistent with the work from van Dokkum et al. (2010), where the authors derived an increase of massive galaxies by a factor of since to the present. They concluded that this growth is likely dominated by mergers, as in situ star-formation can only account for of the mass build up from to .
Several studies suggest that the critical redshift range where the strongest evolution and assembly took place is 1 (eg., Arnouts et al. 2007, Abraham et al. 2007). However, while the results up to are quite solid thanks to the large samples of galaxies and to the spectroscopic infomation available, the samples of ETGs studied up to now at are still small. Besides, ETG are the more clustered galaxies in the universe, making their study very complicated given field to field variations which introduce large uncertainties due to the cosmic variance. Anyway, many works have identified these objects spectroscopically, showing that passive/quiescent galaxies with elliptical morphology may exist up to (Cimatti et al. 2004, McCarthy & GDDS 2004, Cimatti et al. 2008). There are even some candidates of ETGs at , but their nature is still unknown as they are optically too faint for being spectroscopically observed. Therefore, the uncertainties involved in the study of the evolution of quiescent galaxies at high redshifts are still large due to the observational difficulty to identify large samples of ETGs at high (). In particular, long wavelength data are necessary to cover the optical-near infrared part of the spectrum of high redshift galaxies, a spectral range fundamental when calculating the galaxy stellar masses. In addition, the collection of a large sample of high redshift galaxies requires a combination of large areas and deep near-IR (NIR) observations. Due to these difficulties, the study of the galaxy stellar mass function (GSMF hereafter) divided by galaxy types at has been explored only roughly and our knowledge of the evolution of galaxies at high is still rather poor.
Motivated by the limited information available at , we present in this paper the evolution of the GSMF with cosmic time at for the total galaxy population and for the sample divided on the basis of the galaxy star-forming activity in the COSMOS field. The COSMOS survey is the perfect wide area sample to look for rare and clustered objects such as the old and massive ETGs with much improved statistics. This survey (Scoville et al., 2007) presents many advantages when compared with other surveys. First of all, the continuous coverage of deg2 substantially reduces the effect of cosmic variance. Besides, its extensive multi- coverage allows to calculate accurate photometric redshifts (Ilbert et al., 2009) and to study the sources based on their spectral energy distributions (SEDs), which is a more physical and complete approach than using only colors or morphological information. Secondly, the multiwavelength data include deep Spitzer/IRAC (m; Sanders et al. 2007) and -band data (McCracken et al., 2010), crucial for estimating stellar masses at 2.
Galaxies of the present work are selected in the IRAC1 channel (3.6 m), allowing to sample the optical-NIR stellar bump at 1. In addition, data at red wavelength are crucial to detect galaxies that are very faint in the optical (even undetected) but may contribute significantly to, or even dominate, the stellar mass density at high redshift (Yan 2000, Franx et al. 2003, Rodighiero et al. 2007). The extensive multi-band data are used to separate galaxies into different populations based on their SEDs. The present work extends to higher redshifts the study of Ilbert et al. (2010). The sample of Ilbert et al. (2010) was selected at 3.6 m as the present one, but their restriction to IRAC sources with an -band counterpart ( 25.5) limited their study to and to larger stellar masses. Our work was possible after a careful analysis of sources not detected in the optical.
The paper is organized as follows: in Section 2 we introduce the COSMOS data and the cross-correlation method. In Sections 3 and 4 we describe the method to estimate the photometric redshifts and the galaxy stellar masses, while the criteria used to split the sample in different populations is described in Section 5. In Section 6 we study the main properties of the high redshift quiescent galaxies and in Section 7 we present the GSMF for the whole sample and for the different populations, discussing our results in Section 8. Finally, in Section 9 we summarize our conclusions.
Throughout this paper we use standard cosmology (), with km s-1 Mpc-1. Magnitudes are given in AB system. The stellar masses are given in units of solar masses (M⊙) for a Chabrier (Chabrier, 2003) initial mass function (hereafter IMF). The stellar masses based on a Salpeter IMF were converted into a Chabrier IMF by adding dex to the logarithm of stellar masses (Arnouts et al. 2007) .
2 Data
We have built a multi-wavelength IRAC 3.6 m selected catalogue in the COSMOS field by associating the IRAC sources with the optical and MIPS counterparts through the likelihood ratio method (see Section 2.2). For sources undetected at in the -band selected catalogue we have performed a nearest match with the -selected catalogue. The IRAC catalogue is 95 complete at 5.75 Jy (22.0 mag). The final catalogue consists of 78649 sources with : (74742) of them with an optical counterpart, (3554) with no optical counterpart but a -band counterpart and (353) with only IRAC detection. Besides, (11352) of the IRAC sample are also detected in the MIPS band.
2.1 Catalogues
-
1.
IRAC
The COSMOS IRAC catalogue (Sanders et al., 2007) includes photometry in the 4 IRAC channels (3.6, 4.5, 5.8, 8.0 m ) for sources that have a measured flux in IRAC Channel 1 above 1 Jy (23.9 mag) in the COSMOS field. We used the aperture corrected flux and we considered sources with 22.0.
-
2.
Optical
The optical catalogue (Capak et al., 2007) is an -band ( mag) selected catalogue in the area of the Subaru survey ( deg2) and includes photometry in 9 bands (, , , ,, , , , ). We applied systematic offsets derived to optimise the photometric redshifts by Ilbert et al. (2009) and auto-offset corrections (which account for the aperture correction) to the optical catalogue.
-
3.
24 m
The 24 m catalogue (Le Floc’h et al., 2009) is composed by sources detected above 0.15 mJy (18.5 mag).
-
4.
2.2 The cross-correlation
We have performed a cross-correlation of the IRAC sources with the optical and MIPS catalogues through the likelihood ratio method.
The likelihood ratio technique (Sutherland & Saunders 1992; Ciliegi et al. 2003) has the advantage of taking into account not only the position (as for the nearest neighbour method, commonly used in literature), but also the magnitude distribution of the background sources, helping to reduce wrong identifications. The likelihood ratio LR is defined as the ratio between the probability that the source is the correct identification and the corresponding probability of a background, unrelated object:
| (1) |
where is the expected probability distribution, as a function of magnitude, of the true counterparts, is the probability distribution function of the positional errors of the IRAC sources (assumed to be a two-dimensional Gaussian) and is the surface density of background objects with magnitude . In order to derive an estimate for we have first counted all objects in the optical/MIPS catalogue within a fixed radius around each source ). This has then been background subtracted and normalized to construct the distribution function of real identifications:
| (2) |
where (the sum is over all the magnitude bins of the distribution) and Q is the probability that the optical/MIPS counterpart of the source is brighter than the magnitude limit of the optical/MIPS catalogue (). Finally, a best threshold value for LR is chosen in order to maximize both the completeness (avoid missing real identifications) and reliability (keep spurious identifications as low as possible) of the associations.
2.2.1 Results
In this Section we present the final multi-wavelength catalogue created by cross-correlating the IRAC catalogue with the optical and the MIPS catalogues. For the sources with no -band counterpart we have performed a match with the -band catalogue.
-
1.
IRAC + Optical
We considered sources in the optical catalogue with flux in the -band , and eliminated the masked areas and the stars from both catalogues. We performed a match through the likelihood ratio method considering a maximum radius of 3 arcsec (in order to maximize the overdensity around the IRAC position) and a dispersion of for the distribution of the positional errors. The distribution of the background, the total and the real counts is shown in Fig. 1.
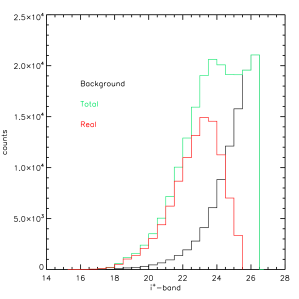
Figure 1: Magnitude distribution of the background (black line), total (green line) and real counts (red line) in the -band. The majority () of the associations have a separation 1 arcsec, with the median separation being 0.34 arcsec. For a non negligible fraction of the associations with a separation 1 arcsec, the photometric redshift we obtained (see Section 3) was not in agreement with the spectroscopic one, meaning a probable spurious IRAC-optical association. Therefore, we have considered as reliable only matches within a separation of 1 arcsec, which is a standard separation used in literature when cross-correlating optical and IRAC catalogues. To reduce contamination from Active Galactic Nuclei (AGN) we have also eliminated the IRAC sources with an optical counterpart asociated to an X-ray detection with XMM-Newton ( of the IRAC sample). Finally, we obtained a reliable optical counterpart for 74742 IRAC sources (). We will refer to these sources as the ”optical sub-sample” hereafter.
-
2.
IRAC+24 m
We found 11352 IRAC sources (14) with a reliable MIPS counterpart detected at . The likelihood ratio method, as described above, has been used.
-
3.
IRAC+
For the sources without an optical counterpart we have performed a match with the -selected catalogue. In this case we used the nearest neighbour technique with a maximum separation of 1 arcsec. The similar wavelengths of the and IRAC1 bands allows to perform this match with a low probability of misidentification. (3554 sources over 3907) of the IRAC sources with no optical counterpart, have a counterpart ( ” sub-sample” hereafter). As already mentioned, the -band catalogue from McCracken et al. (2010) contains also information in additional bands ( and ). The median magnitude in the -band of these sources is , i.e., these sources are optically very faint, consistent with them being not in the ”optical sub-sample ”.
Finally, we have 353 sources for which we did not find neither an -band counterpart, nor a counterpart and for which we have only the IRAC bands information ( ”IRAC sub-sample” hereafter) and, eventually, the 24 m (50 sources). The results of the cross-correlation and the final numbers of our catalogue are summarized in Table 1.
| N ( of the whole sample) | MIPS detection | |
|---|---|---|
| IRAC sample (all) | 78649 | 11352 |
| Opt. sub-sample | 74742 () | 10779 |
| sub-sample | 3554 () | 523 |
| IRAC sub-sample | 353 () | 50 |
3 Photometric Redshift
The only efficient way to estimate the redshifts of the galaxies for the whole sample, given the large number of sources considered, is to determine their photometric redshifts through a detailed SED-fitting procedure.
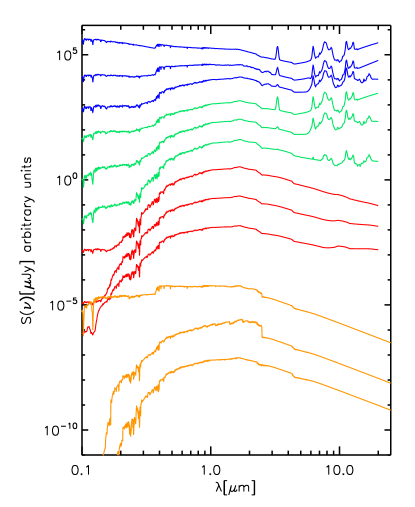
Photometric redshifts were derived using the Le Phare code (Arnouts et al. 2001, Ilbert et al. 2006), which computes photometric redshifts based on a simple template-fitting procedure. We used the COSMOS SED library provided by Ilbert et al. (2009), which contains a set of templates composed of ellipticals and spirals from the Polletta et al. (2007) library and also includes blue galaxies from the Bruzual & Charlot (2003) population synthesis models. We added 6 simple stellar population (SSP) models of different ages (0.05, 0.5, 1.0, 1.5, 2.0 and 3.0 Gyr) from Maraston (2005) to account for passively evolving galaxies at high redshifts. The final library is composed of 7 ellipticals, 12 spirals, 12 starbursts and 6 SSP templates. Some representative templates of the library are shown in Fig. 2. This set of templates maximizes the accuracy of the derived photometric redshifts () when compared with the available spectroscopic redshifts () (see Section 3.1.).
We allowed 3 different extinction laws (Calzetti et al. 2000, Calzetti modified and Prevot et al. 1984) to be applied to each template. The Calzetti modified extinction law includes a UV bump at 2175 (Ilbert et al. 2009), which is fundamental to have good at . We used 9 different values of E(B-V): 0, 0.05, 0.1, 0.15, 0.2, 0.25, 0.3, 0.4 and 0.5.
We set an upper limit (5) to each band when there is no detection, as shown in Table 2. This 5 limit has been chosen following a conservative approach, i.e., as the brightest magnitude value of the sources in the catalogue detected with S/N=5. We fitted our data from the to the 24m band. The minimization procedure is highly affected by the adopted photometric errors (see Ilbert et al. 2009 for a detailed discussion of the issue). We have increased the flux error by 6, 5 and 8 for the optical, IRAC and MIPS bands respectively.
| band | optical sub-sample | sub-sample |
|---|---|---|
| 25.3 | - | |
| 25.7 | 27.0 | |
| 25.5 | - | |
| 25.5 | - | |
| 25.6 | - | |
| 25.1 | 26.2 | |
| 24.5 | 25.0 | |
| 22.0 | 22.0 | |
| 22.0 | - | |
| - | - | |
| 23.3 | - | |
| 21.2 | - | |
| 21.0 | - | |
| 18.5 | - |
3.1 Photometric Redshift accuracy
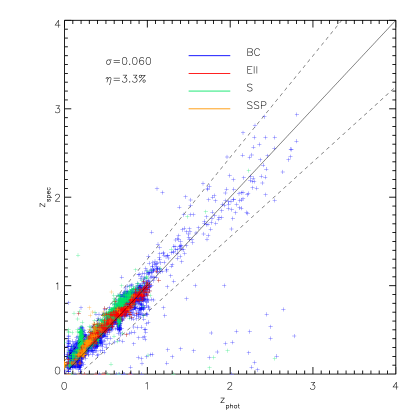
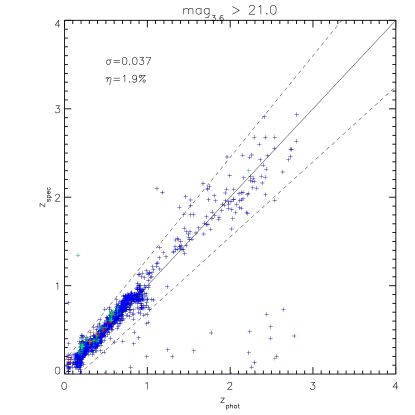
We were able to test the qualitity of our derived photometric redshifts for the IRAC sources with -band detection by comparison with a large sample of spectroscopic redshifts. In particular, we made use of 8176 sources with derived spectroscopic redshift at a very high confidence level (, flags 3.1, 3.5, 4.1, 4.5) from the zCOSMOS faint and bright surveys (Lilly et al. 2007, 2009). We estimated the redshift accuracy as (where is the difference between the photometric and the spectroscopic redshifts) using the normalized median absolute deviation defined as . We also defined the percentage of catastrophic errors, , as the objects with . We obtained an accuracy of and a percentage of catastrophic failures of as can be seen in Fig. 3. As a comparison, Ilbert et al. (2009) using the bright ( mag) sample with 30 bands and narrow filters obtained and of catastrophic errors for their derived photometric redshifts, while the average value of obtained by Pérez-González et al. (2008) using an IRAC selected catalogue with data from the UV to the MIR is 0.055. Given the fact that we use 14 broad bands, we find our result comparable to those in literature.
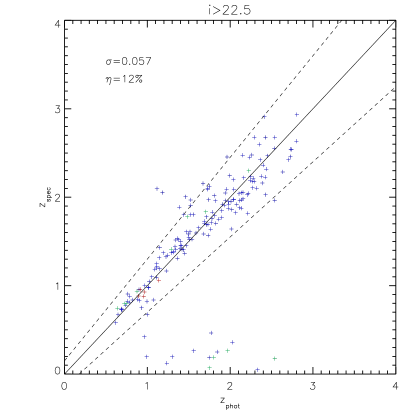
We also tested the reliability of our for the faintest sources, with and , as shown in Figs. 4 and 5. The value of for the faint -band sources () is comparable to the value of for the whole sample, while the number of catastrophic errors increases (). For the faint IRAC1 sample both and are smaller than for the whole sample (, ). This may surprise the reader, but it must be noticed taht the values for the whole spectroscopic sample are highly affected by a significant dispersion on low redshift sources ( , see Fig. 3), which are present in a smaller fraction in the faint IRAC sample.
3.2 Photometric Redshift accuracy for the IRAC sources with no I band counterparts
For the sources with no -band counterpart it is not possible to directly compare the photometric redshifts with spectroscopic redshifts, since no are available for these sources. To test the quality of the derived photometric redshifts we have made use of the dispersion of the distribution, given as an output of the Le Phare code. The mean error on the for the whole sample is , which corresponds to at , meaning that the dispersion of the distribution is consistent with the derived from the and comparison. The redshift uncertainties derived from Le Phare have been used in the Montecarlo simulations (see Section 7).
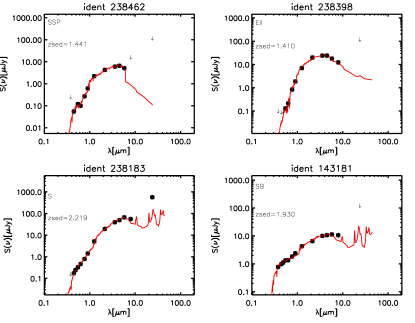
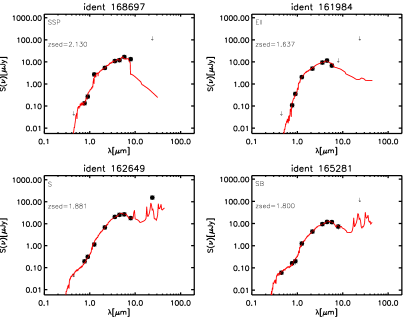
In Figs. 6,7 and 8 we show some examples of SED fitting for sources fitted by different templates (elliptical (Ell), simple stellar populations (SSP), spirals (S) and blue galaxies or starbursts (SB)) for sources from the optical, and IRAC sub-samples.
3.3 Redshift distribution
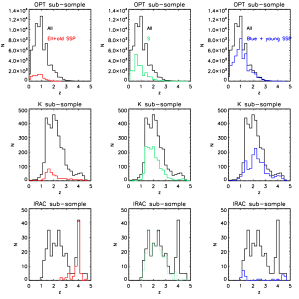
Fig. 9 shows the redshift distribution for each sub-sample, highlighting the contribution from different classes of best-fitting templates. Templates have been divided in 3 classes: elliptical/old SSP (older than 1 Gyr), blue/young SSP (younger than 1 Gyr) and spirals. It can be observed that these redshift distributions are not smooth, but show some peaks at given redshifts, e.g., at 1.0, 2.0 for the sub-sample or a very prominent peak at z 4.0 for the IRAC sub-sample. Note that the peak at in the IRAC sub-sample is not used in this paper since we limit our analysis to and also the small number of sources involved in this peak ( of the sample ). This kind of features in the redshift distribution are presumably not real, but due to the determination of the redshifts through a SED fitting procedure. Spiky redshift distributions have also been reported in literature, e.g., by Pérez-González et al. (2008) and Franx et al. (2008) among others. The number of sources in each subsample with a reliable is shown in Table 3, as well as the number of sources for each sub-sample fitted with each class of template. The number of high redshift ( and ) sources for each sub-sample is also shown.
| Opt. sub-sample | sub-sample | IRAC sub-sample | |
| All | 74742 | 3554 | 328 |
| Ell/old SSP | |||
| S | |||
| Blue/young SSP | |||
It is clear how differently the three sub-samples behave, with and of the and the IRAC sub-samples respectively found at high redshift (), in comparison to of the optical sub-sample. For very high redshift sources () the differences are even more significant, since only 2.3 of the optical sub-sample is found at those redshifts, while this percentage is and for the and IRAC sub-samples, respectively. Also the relative fractions of best-fitting templates are very different. On the one hand, of the optical sub-sample is fitted by an elliptical/old SSP model, while for the IRAC sub-sample the fraction is double (). On the other hand, only of the IRAC sub-sample is fitted by a blue/young SSP model, while these templates represent of the solutions for the optical sub-sample. These percentages are indicative of the importance of an IRAC selected sample to study the properties of high redshift galaxies whose SED is reproduced by quiescent populations.
4 Galaxy stellar masses
To study the evolution of the galaxy stellar mass function of sources at high
redshift we have selected the sources with . When available, we have
made use of (654 out of 19042 sources, of the sample).
The galaxy stellar masses have been derived by means of the Lephare
code by fitting our data (up to 5.8m) with a set of SED templates from
Maraston (2005) with star formation histories exponentially declining with time as
. We used 9 different values of (0.1, 0.3, 1.0,
2.0, 3.0, 5.0, 10.0, 15.0 and 30.0 Gyr) with 221 steps in age. The metallicity
is solar and the IMF Chabrier. Dust extinction was applied using the
Calzetti et al. (2000) extinction law, with a maximum E(B-V) value of 0.5.
We imposed to the derived age of the
galaxies to be less than the age of the Universe at that redshift and greater
than years (the latter requirement avoids having galaxies with extremely
high specific star formation rates, (SSFR hereafter).
The Maraston (2005) models include a better treatment of the thermally pulsing
asymptotic giant branch (TP-AGB) phase, which has a high impact on modelling the
templates at ages in the range Gyr, where the fuel
consumption in this phase is maximum, specially for the near-IR part. Although some authors (Kriek et al., 2010) have recently claimed
that the Maraston (2005) models do not properly reproduce the observed data in a sample of post-starburst galaxies, i.e., at the time
when TP-AGB stars are thought to be most dominant, we have instead found good fits for our SEDs.
Pozzetti et al. (2010) measured an average systematic shift of 0.14 dex between the stellar masses
computed with the Bruzual &
Charlot (2003) models and the Maraston (2005). We will
take into account this difference when comparing our results with those obtained with the Bruzual &
Charlot (2003) models.
Uncertainties in the stellar mass derivation are due to a number of different assumptions in the SED fitting procedure, like, for example, the use of different IMF, extinction laws, metallicities, star formation histories (SFH) or SED template libraries. Tests on simulated catalogues considering the effect on stellar mass estimates of different choices of reddening law, SFHs, metallicities and SED libraries show a typical dispersion of the order of (see Bolzonella et al. 2009), showing that the stellar mass is a rather stable parameter in SED-fitting.
The mean error on the stellar mass, as estimated from the dispersion of the mass distribution (given as an output of the Le Phare code), is 0.16 dex, consistent with the uncertainties mentioned above.
5 Galaxy classification
We are interested in studying the characteristic evolution of the quiescent and star-forming galaxies. To discriminate between these two types, we have made use of a classification based on the SSFR derived through the SED-fitting process. We considered 3 different populations:
-
1.
Actively star-forming galaxies: those for which Gyr
-
2.
Intermediate galaxies: those for which Gyr.
-
3.
Quiescent galaxies: those for which Gyr.
We found 84 sources ( of the high redshift sample, i.e., sources with ) with Gyr and detected in the m band. As the emission at 24 m usually arises from dust heated by star-formation activity, we include these sources in the intermediate population.
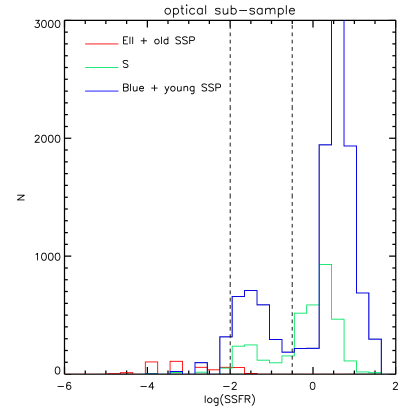
The limits on the SSFR values have been defined from the distribution of the SSFR values (Fig. 10 for the optical sub-sample) and we have verified that they are consistent with the best-fitting template classification. Most of the sources with very low SSFR are fitted by an elliptical or old SSP template, while those with the highest activity are generally fitted by a young SSP or a blue template, as should be expected on the basis of their colors. Considering the whole sample, we have carefully studied the cases where star-forming sources are fitted by an elliptical or old SSP template, as well as quiescent sources fitted by a blue or a young SSP template. We found only 26 sources ( of the high redshift sample) fitted by an elliptical or old SSP template with high activity. On the other hand, more than of the 639 sources ( of the high redshift sample) fitted by a blue template with low SSFR are not detected in the U band, which is a critical band to determine the star formation activity of a galaxy.
In Table 4 we report the number of galaxies classified as star-forming, intermediate and quiescent, as well as the MIPS detected sources, in each redshift bin for sources with .
| all | quiescent | intermediate | star-forming | MIPS | |
|---|---|---|---|---|---|
| 1.4-1.6 | 5142 | 515 | 1325 | 3302 | 261 |
| 1.6-2.0 | 6303 | 512 | 1445 | 4346 | 1286 |
| 2.0-2.5 | 4693 | 287 | 914 | 3492 | 1178 |
| 2.5-3.0 | 1794 | 77 | 415 | 1302 | 272 |
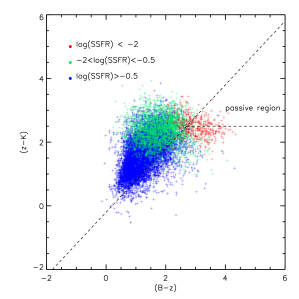
Other tests, such as the BzK classification (Daddi et al., 2004), which separates star forming and quiescent galaxies with respect to their , colors for sources with , shows that galaxies for which low activity is derived roughly occupy the passive region in the BzK diagram ( and ), while for the star-forming galaxies, their colors are consistent with the BzK star-forming selection (Fig. 11). Only 3 sources defined as active star forming fall in the passive region of the BzK diagram.
The lack of detection in some bands worsens the derived SSFR, thus complicating a precise classification. We have derived mean SSFR errors making use of the dispersion of the SSFR distribution, obtaining a mean SSFR error of 0.38 dex for the whole sample.
6 Properties of high-z quiescent galaxies
The evolution over the cosmic time of quiescent galaxies represents a key tool to understand the galaxy mass assembly. In this Section we summarize the properties of the high redshift quiescent galaxies (also known as ETGs in literature) by analyzing the physical parameters obtained through the SED-fitting procedure.
We find 1455 quiescent galaxies at . They are old and massive galaxies (M⊙): more than of them have M⊙ and have M⊙. They have weakly star-forming stellar populations, with ages ranging from 1 to 4.25 Gyr. Some of them are so old to reach the limit allowed by the age of the Universe at their redshift, meaning very high formation redshifts. They have e-folding time scales Gyr, i.e., they should have formed in a very intense and brief starburst. They are characterized by very low dust extinction (E(B-V) ), implying that their red optical colors are due to evolved stellar populations and not to dust extinction. These characteristics are in agreement with previous results (e.g., Cimatti 2009, Kriek et al. 2008).
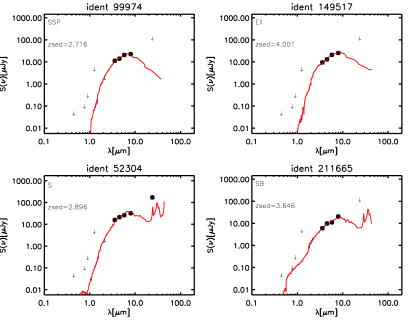
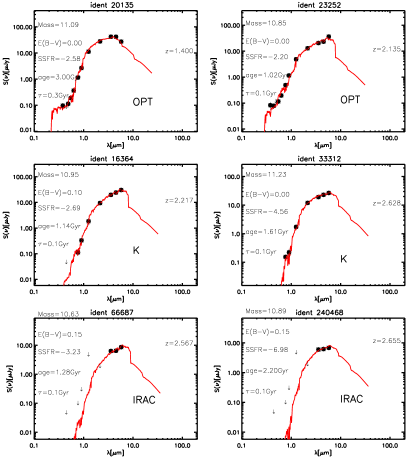
In Fig. 12 we show the SED-fitting and main physical parameters of 6 different high redshift quiescent galaxies. We show examples from the optical, and IRAC sub-samples. We underline the importance of the upper limits in the optical and bands for the IRAC sub-sample to constrain the SED model.
7 The Galaxy Stellar Mass Functions
We study the evolution of the quiescent galaxies by deriving their mass function in four redshift bins. The mass function of the whole sample and of the star forming and intermediate galaxies are also estimated to compare the evolution of the different populations. The classical non-parametric formalism (Schmidt, 1968) has been used and data have been fitted to a Schechter function (Schechter, 1976). The galaxy stellar mass function GSMF is computed only in the non-masked regions with a total covered area of 1.73 deg2.
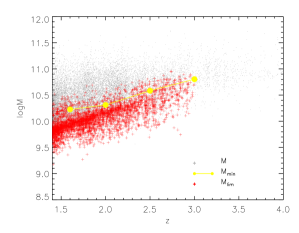
Estimating the stellar mass limit for a magnitude limited sample is not straightforward due to the high range of possible M/L ratios for different galaxy populations and colors. To account for this effect we define, at each redshift, a minimum mass, , above which the derived GSMF is essentially complete because all types of galaxies are potentially observable above this mass.
Following Pozzetti et al. (2009), we calculated for each galaxy its limiting stellar mass, i.e., the mass it would have at its redshift if its observed magnitude were equal to the limiting magnitude of the sample (); ). In order to derive a representative limit for our sample we used the of the faintest galaxies at each redshift. We then defined the as the upper envelope of the distribution below which lie of the values at each redshift. This corresponds to a 95 completeness limit at each redshift. The distribution of mass with redshift, as well as the and the calculated as explained above are shown in Fig. 13 .
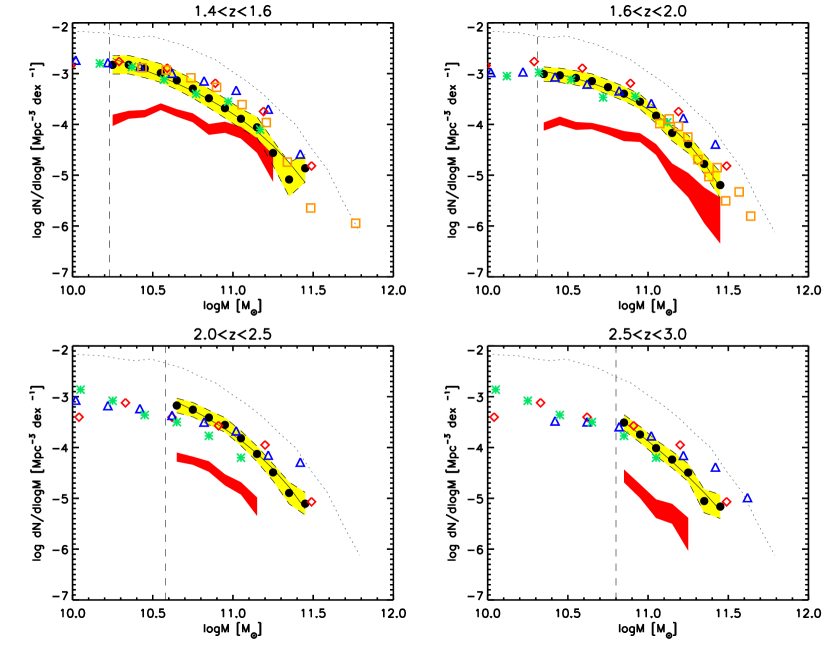
Fig. 14 presents the total and the quiescent GSMF (QSMF hereafter) of our IRAC selected sample in 4 different redshift bins: 1.4-1.6, 1.6-2.0, 2.0-2.5 and 2.5-3.0. At the uncertainties become dominant so we decided to limit our analysis to 3.0. The circles represent the GSMF for all the sources, while the lines show the best Schechter function fitting our data. The Poissonian errors have been computed assuming Poissonian statistics (Zucca et al. 1997):
| (3) |
However, the Poisson errors in our GSMF are an under-estimate of the real uncertainties, since they do not take into account how the uncertainties propagate on the GSMF. This uncertainty is especially important for the optically undetected sources, therefore we have to be very careful in the -bins where these sources dominate (higher redshift). To assess for this uncertainty we have performed Montecarlo simulations. We have created 20 mock catalogues by randomly picking a redshift within the redshift probability distribution function (PDFz) of each object (given by Le Phare code), we have recalculated the mass and other important physical parameters and we have computed the GSMF for each of the 20 mock catalogues. We have then calculated the dispersion of the GSMF values at each mass and redshift bin. The cosmic variance is another important source of uncertainty. Following the formalism of Somerville et al. (2004) we have derived and respectively in the four redshift bins. Finally, we added in quadrature these errors to the Poissonian errors (yellow area in Fig. 14). The red area represents the upper and lower limits of the QSMF calculated in the same way as for the total GSMF.
7.1 Comparison of the total GSMF with literature
In Fig. 14 we show for comparison the GSMF derivations from the literature (blue triangles from Pérez-González et al. 2008, green asterisks from Fontana et al. 2006, red diamonds from Marchesini et al. 2009, orange squares from Ilbert et al. 2010). All GSMF’s were converted to Chabrier IMF and shifted by dex in mass (to account for the difference in the derived mass when using Maraston 2005 or Bruzual & Charlot 2003 models, see Pozzetti et al. 2010). We are in reasonably good agreement with many of the other results. However, a significant difference is observed in all redshift bins at high masses with respect to the results of Pérez-González et al. (2008), as they found a number density significantly higher than ours. With respect to Marchesini et al. (2009), we find less massive galaxies at 2 and more intermediate mass () galaxies at . The agreement with Ilbert et al. (2010), whose sample is also IRAC selected in the COSMOS field, is very good, with small differences probably arising from different redshift binning, as it may happen also with Fontana et al. (2006). However, we have a slight overdensity of intermediate mass galaxies (M⊙) at when compared with all other results from literature, which may be too big to be explained only by differences in redshift binning.
In comparison with other authors, we are using data from the COSMOS survey, which is the largest studied area ( deg2) with full multi-wavelength coverage.
7.2 The evolution of the quiescent galaxies
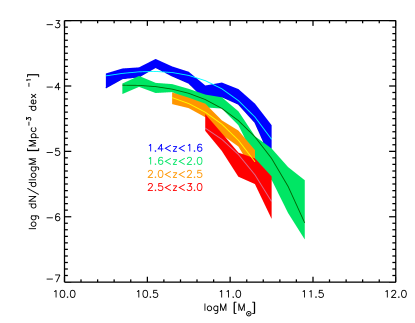
In Fig. 15 the QSMF obtained in the four studied redshift bins is reported. The shaded areas represent the upper and lower limits, derived as explained in Section 7, while the thick lines are the Schechter fitting to our data.
We observe a significant evolution of the QSMF from to , increasing dex for galaxies with in the redshift interval studied. The evolution is dex in each redshift bin, meaning that the number of quiescent galaxies continously increases with cosmic time.
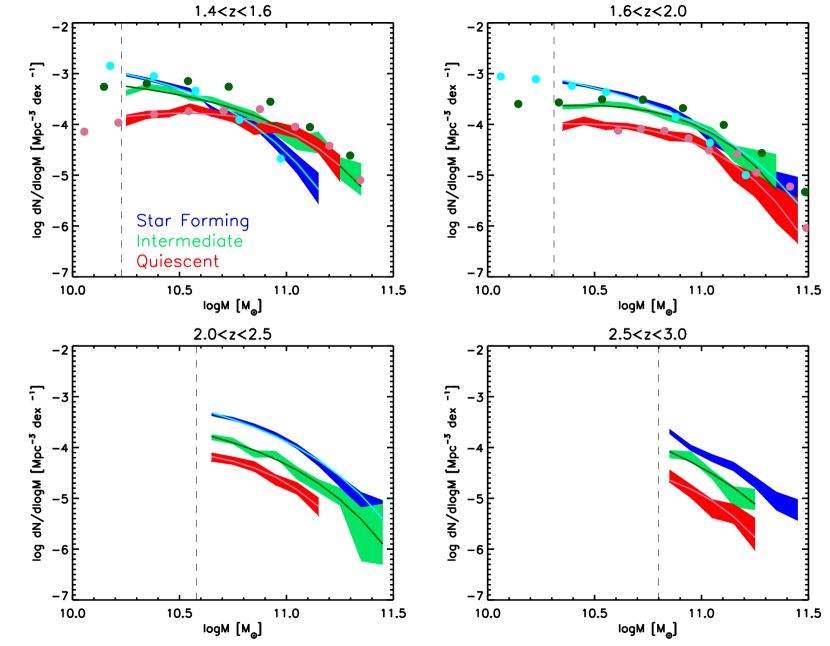
In Fig. 16 we compare the GSMF derived for quiescent galaxies, with those of the other populations. The red, green and blue areas represent the quiescent, intermediate and actively star-forming populations, respectively. We also show for comparison the results obtained by Ilbert et al. (2010), with purple, dark green and light blue circles representing their quiescent, intermediate and high activity galaxies respectively. The agreement is good for the quiescent population in both redshift bins in common (, ), while the differences for the intermediate and star-forming population can be explained by the different classification methods used. While for the quiescent population we used a similar cut in SSFR, for the cut between the intermediate and high activity populations they used Gyr, while we are using a value of .
The evolution of the star-forming galaxies is quite complex (see Fig. 16). They remain almost constant from to , being the dominant population at all masses in those redshift bins. However, their number density decreases when moving to the lowest redshift bins and this decrease depends on the galaxy mass: while for high masses we observe a significant decline ( 0.8 dex for ), for low masses () the GSMF is almost constant. A decrease of the star-forming population from to is in agreement with the results of Ilbert et al. (2010) and, as reported in studies at lower redshift (see for example Ilbert et al. 2010, Pozzetti et al. 2009), the number of star-forming galaxies continues to decrease to almost local redshift (). The intermediate population constantly increases its number at all masses, first at high masses ( dex from to for ), then at low masses ( dex from to for ). This means that they become more abundant than the star-forming population at at . Finally, as mentioned before, for the quiescent population we find an increase of dex in the number density from to for . At the lowest redshift bin ( ) the quiescent population becomes more important than the active one for masses .
Considering all the populations, we find that is a clear epoch of transition of the GSMF: while the GSMF at is dominated by the actively star-forming galaxies at all stellar masses, at the contribution to the total GSMF of the quiescent galaxies is significant and both the intermediate and the quiescent population become more important than the star-forming one for M⊙.
In Table 5 we report the best-fit Schechter parameters for the quiescent sample. In the last redshift bin ( ) the Schechter fit failed to converge when leaving all the parameters free. We fixed the faint end slope to its value at to be able to obtain the other Schechter parameters. While, given the large uncertainties, we cannot derive firm conclusions on the faint end slope nor on , we detect, as already mentioned, a significant increase of from to .
| Type | z-bin | M | Mpc-3 dex | |
|---|---|---|---|---|
| Quiescent | 1.4-1.6 | -0.08 0.98 | 10.57 0.25 | 1.9 0.5 |
| 1.6-2.0 | -0.41 0.92 | 10.61 0.19 | 1.0 0.4 | |
| 2.0-2.5 | -0.34 4.83 | 10.50 0.84 | 0.9 0.8 | |
| 2.5-3.0 | -0.34 (Fixed) | 10.52 0.18 | 0.5 0.6 |
We caution the reader that the uncertainties of this derived GSMF at such high redshift may change our results significantly due to the difficulties in estimating the as well as the activity classification.
8 Discussion
To better understand the behaviour of the different populations we have plotted the fraction of quiescent/star-forming galaxies over the total versus mass for different redshift bins (Fig. 17). The fraction of the actively star-forming galaxies decreases from to from to for M⊙, while that of quiescent galaxies increases from to in the same redshift and mass intervals. The evolution is also mass-dependent, with the most massive galaxies becoming quiescent first, while at M⊙ the star-forming population still dominates the sample at all redshifts.
This trend suggests that actively star-forming galaxies, which dominate the sample at high redshifts (mainly at ), may quench their star formation and become less abundant at later time. This quenching of the star formation seems to be mass dependent, with the most massive galaxies quenching their star-formation first, while the less massive galaxies continue to form stars until later times. If the evolution of the star-forming galaxies should be that of becoming intermediate galaxies to finally end their lives as quiescent galaxies, the increase of this latter population at low redshifts could be explained, with the quiescent population being the dominant population at low redshift, as all galaxies may evolve to that type once their SF has stopped. Therefore, we could be unveling the formation epoch of the very active galaxies and their following evolution from the blue cloud to the red sequence.
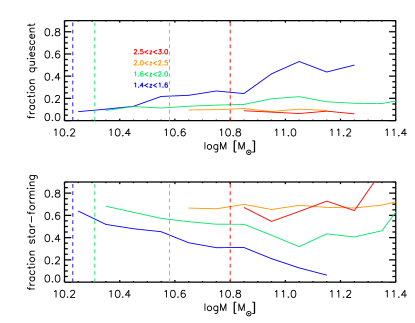
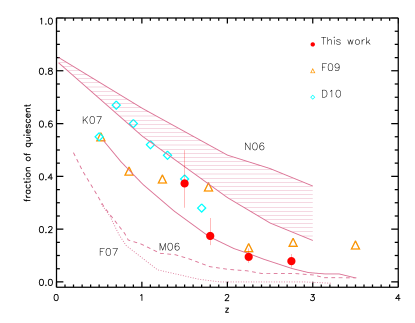
Fig. 18 shows the evolution of the fraction of quiescent galaxies with redshift for sources with M⊙ (red circles). The errors are a combination of the Montecarlo simulations and Poissonian errors. For comparison, we also plotted the values obtained by Fontana et al. (2009, orange triangles) and from Damen et al. (2010, light blue diamonds), as well as the predictions of theoretical models (Menci et al. 2006, M06 hereafter; Kitzbichler & White 2007, K07; Nagamine et al. 2006, N06; Fontanot et al. 2007, F07). We observe a good agreement between the fraction of quiescent galaxies derived in this work and those from Fontana et al. (2009). The values of Damen et al. (2010) are also consistent with our results, although Damen et al. (2010) sources are selected with M⊙ and are defined as quiescent when . The fraction of massive quiescent galaxies increases from to from to , with the main evolution occuring between and (where the fraction increases from to ). This confirms the expected cosmological increase in number density of massive quiescent galaxies with cosmic time. All the theoretical models agree in predicting a gradual increase with time in the fraction of galaxies with low SFR, although large discrepancies between data and theoretical models are observed. It is beyond the scope of the present paper to give a detailed explanation of the differences between models, but we will discuss some generalities. Some models underpredict the fraction of quiescent galaxies at all redshifts, such as the purely semi-analytical models (M06, F07), and in particular predict virtually no such objects at , in contrast to what is observed. This lack of massive galaxies at high redshift for the model of F07 has already been noticed by Fontanot et al. (2007), who admitted that the downsizing trend of the galaxies is not fully reproduced yet in these models, and suggested that some kind of feedback mechanism could help to reproduce the data. A slightly higher fraction of quiescent massive galaxies is predicted by M06, as they include AGN feedback mechanism, due to the growth of supermassive black holes and the AGN triggered by interactions in the host galaxies. This AGN feedback enhances the fraction of galaxies populating the red branch of the color distribution and is particularly effective at high z. However, it is not effective enough to reproduce the observed data at . The purely hydro-dynamical model by Nagamine et al. (2006), represented with a shaded area for three different timescales of the star-formation rate (ranging from 2 x yrs to 2 x yrs), appears to overpredict the fraction of high mass quiescent galaxies. The disagreement in the stellar mass density at between these models and the observations has already been commented by Nagamine et al. (2006). The semi-analytical rendition of the Millennium N-body dark matter simulation by Kitzbichler & White (2007) is the only one which agrees with our observed data, being able to reproduce both the normalization and the shape of the increase in the fraction of quiescent massive galaxies with decreasing redshift. This model introduces radio mode feedback from the central galaxies of groups and clusters, which seems to be fundamental for the predictions to be consistent with the observations.
Finally, the non negligible fraction of quiescent galaxies at implies that these galaxies assembled most of their stellar mass either during an active star-burst phase or through important merging processes at higher redshifts. These star formation episodes must be quenched either by efficient feedback mechanism and/or by the stochastic nature of the hierarchical merging process.
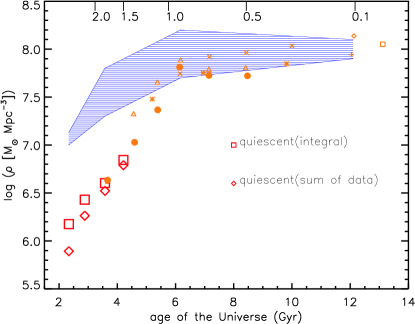
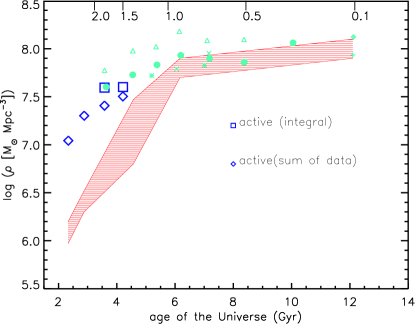
In Fig. 19 and 20 we have calculated the evolution of the stellar mass density with cosmic time for the quiescent sample (red symbols) and the intermediate plus the star-forming samples (dark blue). The values have been obtained in two different ways. The data plotted as squares represent the integral of the Schechter function fitting our data, including the extrapolations to the fainter masses. The diamonds are the sum of the data at all masses. As expected, the latter values are lower (since data are incomplete at low masses) but the two estimates are consistent within dex. We do not show the value of the stellar mass density for the intermediate and star-forming galaxies in the redshift bins and derived through the integration of the Schechter parameters, neither the same value at for the quiescent galaxies, due to the high uncertainties in the derived parameters given the incompletness at low masses. In the plots we also show a colored area representing the upper and lower limits of the quiescent (red) and star-forming (blue) populations, as well as various results from literature. Orange symbols represent the stellar mass density of the quiescent galaxies as derived by other authors, while light blue symbols stand for the star-forming ones (squares from Kochanek et al. 2001, diamonds from Driver et al. (2006), plus symbols from Bell et al. (2003), triangles from Arnouts et al. 2007, asterisks from Franceschini et al. 2006, crosses from Borch et al. (2006), dots from Ilbert et al. 2010). We are in very good agreement with Ilbert et al. (2010) in the common redshift bins. We observe that the increase in stellar mass density in the redshift range of interest ( Gyr) is very rapid for both populations ( dex for the star-forming plus intermediate populations and dex for the quiescent one), then slowing down at lower redshifts. However, this slow down happens earlier in time for the star-forming population ( , Gyr) than for the quiescent galaxies, which continue to rapidly assembly mass until later times (, Gyr ), reaching the star-forming galaxies mass density at .
The existence of a non negligible population (M⊙ Mpc at ) of quiescent galaxies with high masses which have already undergone major star formation even at the highest redshifts () is fundamental for our understanding of the galaxy formation processes and crucial for testing theoretical scenarios.
9 Summary and Conclusions
We derived the GSMF and stellar mass density in a 1.73 deg2 area in the COSMOS field from to for the whole sample and for the sample divided into populations, paying special attention to the quiescent one. The GSMF estimate is based on 18000 galaxies with 22.0 and . We summarize our results below:
-
1.
We find that an IRAC selected sample is fundamental for studying quiescent galaxies at high redshift. About 88 and 91 of the and IRAC sub-samples are found at respectively, with this fraction dropping to 21 for an -band selected sample. Considering the galaxy classification, 62 of the optically selected sub-sample is fitted by a blue template, while the same fraction is much lower () for the IRAC sub-sample.
-
2.
We study the main properties of the high redshift quiescent sample (), finding that they are old and massive galaxies, with M⊙ and ages ranging from to Gyr. They have small e-folding time scales Gyr and very low dust extinction (E(B-V) ), meaning passively evolving populations.
-
3.
We observe a significant evolution of the QSMF from to , amounting to dex for galaxies with . The evolution is dex in each redshift bin, meaning that the number of quiescent galaxies continously increases with cosmic time.
-
4.
We find that is a clear epoch of transition of the GSMF: while the GSMF at is dominated by the star-forming galaxies at all stellar masses, at the contribution to the total GSMF of the quiescent galaxies is significant and the quiescent galaxies become more important than the star-forming population for M⊙.
-
5.
The fraction of star-forming galaxies decreases from to from to for M⊙, while the quiescent population increases from to at the same and mass intervals.
-
6.
All of the theoretical models agree in predicting a gradual increase with cosmic time in the fraction of galaxies with a low SFR. However, only the K07 Millennium-based model is able to properly reproduce the shape of the data.
-
7.
We find a significant number of quiescent galaxies already in place at ( 6.0 M⊙Mpc-3), meaning that these galaxies assembled most of their stellar mass in previous epochs in an active star-burst phase or through important merging processes at higher redshifts.
References
- Abraham et al. (2007) Abraham R. G., Nair P., McCarthy P. J., Glazebrook K., Mentuch E., Yan H., Savaglio S., Crampton D., Murowinski R., Juneau S., Le Borgne D., Carlberg R. G., Jørgensen I., Roth K. e. a., 2007, AJ, 669, 184
- Arnouts et al. (2001) Arnouts S., Vandame B., Benoist C., Groenewegen M. A. T., da Costa L., Schirmer M., Mignani R. P., Slijkhuis R., Hatziminaoglou E., Hook R., Madejsky R., Rité C., Wicenec A., 2001, A&A, 379, 740
- Arnouts et al. (2007) Arnouts S., Walcher C. J., Le Fèvre O., Zamorani G., Ilbert O. e. a., 2007, A&A, 476, 137
- Baldry et al. (2004) Baldry I. K., Glazebrook K., Brinkmann J., Ivezić Ž., Lupton R. H., Nichol e. a., 2004, Astrophysical Journal, 600, 681
- Bell et al. (2003) Bell E. F., McIntosh D. H., Katz N., Weinberg M. D., 2003, ApJS, 149, 289
- Bell et al. (2004) Bell E. F., Wolf C., Meisenheimer K., Rix H.-W., Borch A., Dye S., Kleinheinrich M., Wisotzki L., McIntosh D. H., 2004, ApJ, 608, 752
- Bolzonella et al. (2009) Bolzonella M., nekKovac K., Pozzetti L., Zucca E., Cucciati O., Lilly e. a., 2009, ArXiv e-prints
- Borch et al. (2006) Borch A., Meisenheimer K., Bell E. F., Rix H., Wolf C., Dye S., Kleinheinrich M., Kovacs Z., Wisotzki L., 2006, AAP, 453, 869
- Brinchmann et al. (2004) Brinchmann J., Charlot S., White S. D. M., Tremonti C., Kauffmann G., Heckman e. a., 2004, MNRAS, 351, 1151
- Brown et al. (2007) Brown M. J. I., Dey A., Jannuzi B. T., Brand K., Benson A. J., Brodwin M., Croton D. J., Eisenhardt P. R., 2007, ApJ, 654, 858
- Bruzual & Charlot (2003) Bruzual G., Charlot S., 2003, MNRAS, 344, 1000
- Bundy et al. (2005) Bundy K., Ellis R. S., Conselice C. J., Cooper M., Weiner B., Taylor J., Willmer C., DEEP2 Team 2005, in Bulletin of the American Astronomical Society Vol. 37 of Bulletin of the American Astronomical Society, The Mass-Dependent Evolution of Field Galaxies. pp 1235–+
- Calzetti et al. (2000) Calzetti D., Armus L., Bohlin R. C., Kinney A. L., Koornneef e. a., 2000, ApJ, 533, 682
- Capak et al. (2007) Capak P., Aussel H., Ajiki M., McCracken H. J., Mobasher B., Scoville e. a., 2007, ApJS, 172, 99
- Cassata et al. (2008) Cassata P., Cimatti A., Kurk J., Rodighiero G., Pozzetti L., Bolzonella M., Daddi E., Mignoli M., Berta S., Dickinson M., Franceschini A., Halliday C., Renzini A., Rosati P., Zamorani G., 2008, AAp, 483, L39
- Chabrier (2003) Chabrier G., 2003, PASP, 115, 763
- Ciliegi et al. (2003) Ciliegi P., Zamorani G., Hasinger G., Lehmann I., Szokoly G., Wilson G., 2003, VizieR Online Data Catalog, 339, 80901
- Cimatti (2006) Cimatti A., 2006, Nuovo Cimento B Serie, 121, 1383
- Cimatti (2009) Cimatti A., 2009, in G. Giobbi, A. Tornambe, G. Raimondo, M. Limongi, L. A. Antonelli, N. Menci, & E. Brocato ed., American Institute of Physics Conference Series Vol. 1111 of American Institute of Physics Conference Series, The formation and evolution of early-type galaxies: solid results and open questions. pp 191–198
- Cimatti et al. (2008) Cimatti A., Cassata P., Pozzetti L., Kurk J., Mignoli M., Renzini A., Daddi E., Bolzonella M., Brusa M., Rodighiero G., Dickinson M., Franceschini A., Zamorani G., Berta S., Rosati P., Halliday C., 2008, AAp, 482, 21
- Cimatti et al. (2004) Cimatti A., Daddi E., Renzini A., Cassata P., Vanzella E., Pozzetti L., Cristiani S., Fontana A., Rodighiero G., Mignoli M., Zamorani G., 2004, Nature, 430, 184
- Cirasuolo et al. (2007) Cirasuolo M., McLure R. J., Dunlop J. S., 2007, Nuovo Cimento B Serie, 122, 1133
- Cole et al. (2001) Cole S., Norberg P., Baugh C. M., Frenk C. S., Bland-Hawthorn e., 2001, MNRAS, 326, 255
- Cowie et al. (1996) Cowie L. L., Songaila A., Hu E. M., Cohen J. G., 1996, AJ, 112, 839
- Daddi et al. (2004) Daddi E., Cimatti A., Renzini A., Fontana A., Mignoli M., Pozzetti L., Tozzi P., Zamorani G., 2004, ApJ, 617, 746
- Damen et al. (2010) Damen M., Labbe I., van Dokkum P. G., Franx M., Taylor E. N., Brandt W. N., Dickinson M., Gawiser E., Illingworth G. D., Kriek M., Marchesini D., Muzzin A., Papovich C., Rix H., 2010, ArXiv e-prints
- Dickinson et al. (2003) Dickinson M., Papovich C., Ferguson H. C., Budavári T., 2003, ApJ, 587, 25
- Driver et al. (2006) Driver S. P., Allen P. D., Graham A. W., Cameron E., Liske J., Ellis S. C., Cross N. J. G., De Propris R., Phillipps S., Couch W. J., 2006, MNRAS, 368, 414
- Faber et al. (2007) Faber S. M., Willmer C. N. A., Wolf C., Koo D. C., Weiner B. J., Newman J. A., Im M., Coil A. L., Conroy C., Cooper M. C., Davis M., Finkbeiner D. P. e. a., 2007, ApJ, 665, 265
- Fontana et al. (2006) Fontana A., Salimbeni S., Grazian A., Giallongo E., Pentericci L., Nonino M., Fontanot F., Menci N., Monaco P., Cristiani S., Vanzella e. a., 2006, A&A, 459, 745
- Fontana et al. (2009) Fontana A., Santini P., Grazian A., Pentericci L., Fiore F., Castellano M., Giallongo E., Menci N., Salimbeni S., Cristiani S., Nonino M., Vanzella E., 2009, A&A, 501, 15
- Fontanot et al. (2007) Fontanot F., Monaco P., Silva L., Grazian A., 2007, MNRAS, 382, 903
- Franceschini et al. (2006) Franceschini A., Rodighiero G., Cassata P., Berta S., Vaccari e. a., 2006, A&A, 453, 397
- Franx et al. (2003) Franx M., Labbé I., Rudnick G., van Dokkum P. G., Daddi E., Förster Schreiber N. M., Moorwood A., Rix H., Röttgering H., van de Wel A., van der Werf P., van Starkenburg L., 2003, ApJL, 587, L79
- Franx et al. (2008) Franx M., van Dokkum P. G., Schreiber N. M. F., Wuyts S., Labbé I., Toft S., 2008, ApJ, 688, 770
- Gallazzi et al. (2006) Gallazzi A., Charlot S., Brinchmann J., White S. D. M., 2006, MNRAS, 370, 1106
- Giallongo et al. (2005) Giallongo E., Salimbeni S., Menci N., Zamorani G., Fontana A., Dickinson M., Cristiani S., Pozzetti L., 2005, ApJ, 622, 116
- Ilbert et al. (2006) Ilbert O., Arnouts S., McCracken H. J., Bolzonella M., Bertin e. a., 2006, A&A, 457, 841
- Ilbert et al. (2009) Ilbert O., Capak P., Salvato M., Aussel H., McCracken e. a., 2009, ApJ, 690, 1236
- Ilbert et al. (2010) Ilbert O., Salvato M., Le Floc’h E., Aussel H., Capak P., McCracken e. a., 2010, ApJ, 709, 644
- Kitzbichler & White (2007) Kitzbichler M. G., White S. D. M., 2007, MNRAS, 376, 2
- Kochanek et al. (2001) Kochanek C. S., Pahre M. A., Falco E. E., Huchra J. P., Mader J., Jarrett T. H., Chester T., Cutri R., Schneider S. E., 2001, ApJ, 560, 566
- Kriek et al. (2010) Kriek M., Labbé I., Conroy C., Whitaker K. E., van Dokkum P. G., Brammer G. B., Franx M., Illingworth G. D., Marchesini D., Muzzin A., Quadri R. F., Rudnick G., 2010, ApJL, 722, L64
- Kriek et al. (2008) Kriek M., van Dokkum P. G., Franx M., Illingworth G. D., Marchesini D., Quadri R., Rudnick G., Taylor E. N., Förster Schreiber N. M., Gawiser E., Labbé I., Lira P., Wuyts S., 2008, ApJ, 677, 219
- Le Floc’h et al. (2009) Le Floc’h E., Aussel H., Ilbert O., Riguccini L., Frayer D. T., Salvato e. a., 2009, ApJ, 703, 222
- Lilly et al. (2009) Lilly S. J., Le Brun V., Maier C., Mainieri V., Mignoli M., Scodeggio M., Zamorani e., 2009, ApJS, 184, 218
- Lilly et al. (1996) Lilly S. J., Le Fevre O., Hammer F., Crampton D., 1996, ApJL, 460, L1+
- Lilly et al. (2007) Lilly S. J., Le Fèvre O., Renzini A., Zamorani G., Scodeggio e., 2007, ApJS, 172, 70
- Madau et al. (1996) Madau P., Ferguson H. C., Dickinson M. E., Giavalisco M., Steidel C. C., Fruchter A., 1996, MNRAS, 283, 1388
- Mancini et al. (2009) Mancini C., Matute I., Cimatti A., Daddi E., Dickinson M., Rodighiero G., Bolzonella M., Pozzetti L., 2009, AAP, 500, 705
- Maraston (2005) Maraston C., 2005, MNRAS, 362, 799
- Marchesini et al. (2009) Marchesini D., van Dokkum P. G., Förster Schreiber N. M., Franx M., Labbé I., Wuyts S., 2009, ApJ, 701, 1765
- Marchesini et al. (2010) Marchesini D., Whitaker K. E., Brammer G., van Dokkum P. G., Labbé I., Muzzin A., Quadri R. F., Kriek M., Lee K.-S., Rudnick G., Franx M., Illingworth G. D., Wake D., 2010, ApJ, 725, 1277
- McCarthy & GDDS (2004) McCarthy P. J., GDDS 2004, in American Astronomical Society Meeting Abstracts Vol. 36 of Bulletin of the American Astronomical Society, Star Formation Histories of Massive Galaxies from the Gemini Deep Deep Survey. pp #128.06–+
- McCracken et al. (2010) McCracken H. J., Capak P., Salvato M., Aussel H., Thompson D., Daddi e., 2010, ApJ, 708, 202
- Menci et al. (2006) Menci N., Fontana A., Giallongo E., Grazian A., Salimbeni S., 2006, ApJ, 647, 753
- Mobasher et al. (2004) Mobasher B., Dickinson M., Mobasher B., Ferguson H. C., Giavalisco M., Wiklind T., 2004, in American Astronomical Society Meeting Abstracts Vol. 37 of Bulletin of the American Astronomical Society, A Strong Candidate for a Star-forming Galaxy at z 7 in the Hubble Ultradeep Field. pp #178.08–+
- Nagamine et al. (2006) Nagamine K., Ostriker J. P., Fukugita M., Cen R., 2006, ApJ, 653, 881
- Nichol et al. (2007) Nichol R. C., Cannon R., Roseboom I., Wake D., 2007, in H. Böhringer, G. W. Pratt, A. Finoguenov, & P. Schuecker ed., Heating versus Cooling in Galaxies and Clusters of Galaxies 2dF SDSS LRG and QSO (2SLAQ) Survey: Evolution of the Most Massive Galaxies. pp 422–+
- Nicol et al. (2011) Nicol M.-H., Meisenheimer K., Wolf C., Tapken C., 2011, ApJ, 727, 51
- Pannella et al. (2006) Pannella M., Hopp U., Saglia R. P., Bender R., Drory N., Salvato M., Gabasch A., Feulner G., 2006, ApJL, 639, L1
- Pérez-González et al. (2008) Pérez-González P. G., Rieke G. H., Villar V., Barro G., Blaylock M., Egami E., Gallego J., Gil de Paz A., Pascual S., Zamorano J., Donley J. L., 2008, ApJ, 675, 234
- Polletta et al. (2007) Polletta M., Tajer M., Maraschi L., Trinchieri G., Lonsdale e. a., 2007, ApJ, 663, 81
- Pozzetti et al. (2009) Pozzetti L., Bolzonella M., Zucca E., Zamorani G., Lilly e. a., 2009, ArXiv e-prints
- Pozzetti et al. (2010) Pozzetti L., Bolzonella M., Zucca E., Zamorani G., Lilly e. a., 2010, A&A, 523, A13+
- Pozzetti et al. (1998) Pozzetti L., Madau P., Zamorani G., Ferguson H. C., Bruzual A. G., 1998, MNRAS, 298, 1133
- Prevot et al. (1984) Prevot M. L., Lequeux J., Prevot L., Maurice E., Rocca-Volmerange B., 1984, A&A, 132, 389
- Renzini (2006) Renzini A., 2006, ARA&A, 44, 141
- Rodighiero et al. (2007) Rodighiero G., Cimatti A., Franceschini A., Brusa M., Fritz J., Bolzonella M., 2007, A&A, 470, 21
- Sanders et al. (2007) Sanders D. B., Salvato M., Aussel H., Ilbert O., Scoville e. a., 2007, ApJS, 172, 86
- Schechter (1976) Schechter P., 1976, ApJ, 203, 297
- Schmidt (1968) Schmidt M., 1968, ApJ, 151, 393
- Scoville et al. (2007) Scoville N., Aussel H., Brusa M., Capak P., Carollo e. a., 2007, ApJS, 172, 1
- Somerville et al. (2004) Somerville R. S., Lee K., Ferguson H. C., Gardner J. P., Moustakas L. A., Giavalisco M., 2004, ApJL, 600, L171
- Sutherland & Saunders (1992) Sutherland W., Saunders W., 1992, MNRAS, 259, 413
- Taylor et al. (2009) Taylor E. N., Franx M., van Dokkum P. G., Bell E. F., Brammer G. B., Rudnick G., Wuyts S., Gawiser E., Lira P., Urry C. M., Rix H.-W., 2009, ApJ, 694, 1171
- van Dokkum et al. (2010) van Dokkum P. G., Whitaker K. E., Brammer G., Franx M., Kriek M., Labbé I., Marchesini D., Quadri R., Bezanson R., Illingworth G. D., Muzzin A., Rudnick G., Tal T., Wake D., 2010, ApJ, 709, 1018
- Willmer et al. (2006) Willmer C. N. A., Faber S. M., Koo D. C., Weiner B. J., Newman J. A., Coil A. L., Connolly A. J., Conroy C., Cooper M. C., Davis M., Finkbeiner D. P. e. a., 2006, ApJ, 647, 853
- Yan et al. (2006) Yan H., Dickinson M., Giavalisco M., Stern D., Eisenhardt P. R. M., Ferguson H. C., 2006, ApJ, 651, 24
- Yan (2000) Yan L., 2000, in HST Proposal A Search for Extremely Red Objects Using Archival WFPC2 Images. pp 8756–+
- Zucca et al. (1997) Zucca E., Zamorani G., Vettolani G., Cappi A., Merighi R., Mignoli e. a., 1997, A&A, 326, 477