A Ly blob and damped Ly absorber in the dark matter halo of the binary quasar Q 0151+048††thanks: Based on observations done with i) European Southern Observatory (ESO) utilizing 8.2m Very Large Telescope (VLT) X-shooter spectrograph on Cerro Paranal in the Atacama Desert, northern Chile. ii) 2.56m Nordic Optical Telescope (NOT), a scientific association between Denmark, Finland, Iceland, Norway and Sweden, operated at Observatorio del Roque de Los Muchachos on the island of La Palma, Spain.
Q 0151+048 is a physical quasar (QSO) pair at with a separation of 3.3 arcsec on the sky. In the spectrum of the brighter member of this pair, Q 0151+048A, a damped Ly absorber (DLA) is observed at a higher redshift. We have previously detected the host galaxies of both QSOs as well as a Ly blob whose emission surrounding Q 0151+048A extends over arcsec. We seek to constrain the geometry of the system and understand the possible relations between the DLA, the Ly blob and the two QSOs. We also aim at characterizing the former two objects in more detail. To study the nature of the Ly blob, we have performed low-resolution long-slit spectroscopy with the slit aligned with the extended emission. We have also observed the whole system using the medium-resolution VLT/X-shooter spectrograph and the slit aligned with the two QSOs. The systemic redshift of both QSOs is determined from rest-frame optical emission lines redshifted into the NIR. We employ line-profile fitting techniques, to measure metallicities and the velocity width of low-ionization metal absorption lines associated to the DLA, and photo-ionization modeling, to characterize the DLA further. We measure systemic redshifts of and from the and emission lines, respectively. In other words, the two QSOs have identical redshifts within . From the width of Balmer emission lines and the strength of the rest-frame optical continuum, we estimate the masses of the black holes of the two QSOs to be 109.33 M⊙ and 108.38 M⊙ for Q 0151+048A and Q 0151+048B, respectively. We then use the correlation between black hole mass and dark matter halo mass to infer the mass of the dark matter halos hosting the two QSOs: 1013.74 M⊙ and 1013.13 M⊙ for Q 0151+048A and Q 0151+048B, respectively. We observe a velocity gradient along the major axis of the Ly blob consistent with the rotation curve of a large disk galaxy, but it may also be caused by gas inflow or outflow. We detect residual continuum in the DLA trough which we interpret as emission from the host galaxy of Q 0151+048A. The derived column density of the DLA is . Metal column densities are also determined for a number of low-ionization species resulting in an overall metallicity of 0.01 Z⊙. We detect which allows us to make a physical model of the DLA cloud. From the systemic redshifts of the QSOs, we conclude that the Ly blob is associated with Q 0151+048A rather than with the DLA. The DLA must be located in front of both the Ly blob and Q 0151+048A at a distance larger than 30 kpc and has a velocity relative to the blob of km/s. The two quasars accrete at normal Eddington ratios. The DM halo of this double quasar will grow to the mass of our local super-cluster at . We point out that those objects therefore form an ideal laboratory to study the physical interactions in a pre-cursor of our local super-cluster.
Key Words.:
Cosmology: observations - Galaxies: halos - Galaxy: abundances - Cosmology: dark matter - Quasars: individual (Q 0151+048)1 Introduction
Searches for Ly emission in the high redshift Universe have in the last decade found many sources of a type called Ly “blobs” (Fynbo et al. 1999; Keel et al. 1999; Steidel et al. 2000; Francis et al. 2001; Matsuda et al. 2004; Palunas et al. 2004; Weidinger et al. 2004; Dey et al. 2005; Villar-Martín et al. 2005; Nilsson et al. 2006). Ly blobs must be considered the extreme end of the distribution of Ly emitting sources, in that they are very extended (sizes more than several times ten kpc across), and unusually bright in the Ly line ( erg s-1). They are interesting and promising cosmological probes, partly because they are some of the largest cohesive structures at high redshift and partly because they hold key insights into the energetics of their source. Among the Ly blobs, a number of sub-categories have emerged, sorting them based on the presumed main source of ionizing flux. Several blobs have been shown to be powered by vigorous star formation (Taniguchi et al. 2001; Ohyama et al. 2003; Mori et al. 2004; Matsuda et al. 2006)), others by cold gas falling onto a dark matter (DM) halo (Nilsson et al. 2006; Smith & Jarvis 2007).
In this group of extreme objects, the most extreme sub-sample in terms of sizes and fluxes are those powered by active galactic nuclei (AGN), QSOs and radio galaxies. Gigantic Ly haloes are routinely discovered around high redshift radio galaxies (see Miley & De Breuck (2008) for a review). Smaller blobs are also often powered by AGN activity; Geach et al. (2009) find that roughly % of narrow-band selected Ly blobs are powered by AGN. In especially rare cases, multiple component systems including a QSO, a DLA, and a Ly blob are found (Møller et al. 1998; Leibundgut & Robertson 1999; Hennawi et al. 2009). It is yet unclear how these systems interact, or even their actual spatial configurations.
One such system is the binary QSO Q 0151+048A & B (also called PHL1222), whose brightest member was first observed spectroscopically by Burbidge (1968) who measured its redshift to be (at that time the other member of the binary was not yet discovered). Williams & Weymann (1976) were the first to discuss the nature of the DLA in the spectrum of PHL1222 in some detail. They inferred a redshift of the absorber of more than 2000 km s-1 relative to the redshift of Q 0151+048A (hereafter qA). The DLA is hence a member of the class of DLAs (see Møller et al. 1998) which later became proximate DLAs (PDLAs) (Ellison et al. (2010); see also Weymann et al. (1977); Prochaska et al. (2008b)). Compared to normal intervening DLAs PDLAs tend to have evidence for a higher radiation field (presumably the proximate QSO) and on average slightly higher metallicities (Ellison et al. 2010).
The QSO redshift reported in the above work was measured from the UV emission lines from , and , which are now known to be systematically blueshifted relative to the systemic redshift (Tytler & Fan 1992). Williams & Weymann (1976) also inferred a minimum distance of 0.4 Mpc between the DLA and qA based on the absence of fine structure lines from and . Later Meylan et al. (1990) were the first to establish that PHL1222 has a fainter companion at nearly the same redshift. The pair was discussed in more detail in Møller et al. (1998) where Ly emission was also detected in the DLA trough. Fynbo et al. (1999, hereafter FMW99) found using narrow band imaging that there is very extended Ly emission close to the redshift of the DLA and in retrospect this appears to be one of the first detections of what is now known as Ly blobs.
In this study we present new spectroscopic observations of both members of the QSO pair. Our main objectives are i) to characterize the DLA absorber (in particular its metallicity and velocity profile), ii) to determine the systemic redshift of both members of the pair using rest frame optical emission lines, iii) further constrain the geometry of the system by looking for absorption in the spectrum of Q 0151+048B (qB) at the redshift of the DLA, and iv) to further study the nature of the Ly emission blob.
The outline of the paper is as follows: In 2 we describe our spectroscopic observations and data reduction. In 3 & 4 we analyze emission features (the Ly emitting gas and QSO emission lines) and absorption signatures of the DLA respectively and in §5 we discuss how these new data change our interpretation of the geometry and dynamical state of the system. In 6 we briefly summarize our conclusions. Throughout this paper, we assume a Hubble constant of H km s (Freedman et al. 2001) and a universe with flat cosmology , following the results presented in the initial WMAP data release (Spergel et al. 2003). At a redshift of 1.93 and with this cosmology, 1 arcsec corresponds to a proper length of 8.384 kpc. All wavelengths are corrected to vacuum heliocentric frame.
2 Observations and data reduction
2.1 The NOT/ALFOSC data
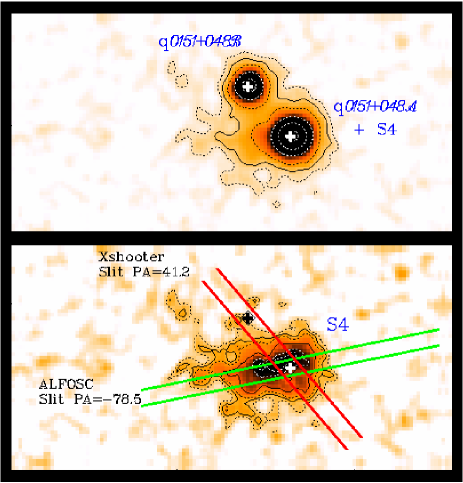
On three nights in September 1997 we used the NOT equipped with Andalucia Faint Object Spectrograph and Camera (ALFOSC) to obtain a spectrum of the elongated Ly emission line object discovered by FMW99 (see their Fig. 2) who named it S4. Our slit was centered on qA and aligned with the major axis of S4 at a position angle of deg (see Fig. 1). We used ALFOSC grism G6 and a slit of which provided a resolution of . We integrated for a total exposure time of 33000 sec at this slit position. A detailed log is provided in Table 1. The data were reduced using standard techniques for bias and flat-fielding and a final stack was obtained using optimal weights.
| Date | Object | Exp. | Instrument | slit | R | PA |
| (sec) | width | (deg) | ||||
| 2 Sep, 97 | A+S4 | 14000 | ALFOSC | 700 | ||
| 3 Sep, 97 | A+S4 | 15000 | ALFOSC | 700 | ||
| 4 Sep, 97 | A+S4 | 4000 | ALFOSC | 700 | ||
| 18 Nov, 08 | A+B | 3600 | XSH/UVB111UVB-arm range: 3000-5500 Å | 6200 | ||
| A+B | 3600 | XSH/VIS222VIS-arm range: 5500-10000 Å | 11000 | 41.2 | ||
| 29 Sept, 09 | A+B | 960 | XSH/UVB | 5100 | 41.2 | |
| A+B | 960 | XSH/VIS | 8800 | 41.2 | ||
| A+B | 480 | XSH/NIR | 5100 | 41.2 |
2.2 VLT/X-shooter data
On November 18th 2008, during the first instrument commissioning run, we returned to this field, this time using the X-shooter on the VLT which allowed us to observe both QSOs with higher spectral resolution and long wavelength coverage from ultraviolet (UV) to near-infrared (NIR). The ESO-VLT X-shooter is an Echelle spectrograph mounted at the VLT Cassegrain focus (D’Odorico et al. 2006). Here we used a slit PA of 41.2 deg which placed both QSOs on the slit (see Fig. 1) thereby allowing us to obtain a 3600 seconds exposure of both QSOs (Program ID: 60.A-9022(C)). During this early commissioning run only two of the three arms were operational and we obtained spectra in parallel with the UV-blue (UVB) and visual (VIS) arms of the spectrograph using slits of and respectively. The resulting resolutions are 6200 (UVB) and 11000 (VIS). Because the seeing was significantly larger than the slit widths the sky-line widths provide a good measure of the resolution.
On September 29, 2009, during a Science Verification run (Program ID: 60.A-9441(A)), we again integrated with the X-shooter slits on both QSOs. This time we could utilize all three arms (i.e. UVB, VIS, and NIR) and the log of observations is again provided in Table 1. Availability of the NIR arm during the September run allowed us to extend the wavelength coverage through to rest wavelength optical lines. We obtained 480 sec in the NIR arm with a resolution of . All X-shooter data are available from the ESO archive.
The X-shooter data were processed using a preliminary version of the X-shooter data reduction pipeline (Goldoni et al. 2006; Modigliani et al. 2010). The pipeline first corrected UVB and VIS raw frames for bias and NIR frames for dark current. After division by the flat field, the pipeline performed background subtraction, corrected cosmic ray hits using the method developed by van Dokkum (2001) and subtracted sky emission lines using the Kelson (2003) method. The individual orders were extracted and rectified in wavelength space. This was done by using the previously obtained wavelength solution from calibration frames. The individual orders were merged afterwards and in the overlapping regions the merging was weighted by the errors which were being propagated during the reduction process. From the final 2D merged spectrum one dimensional spectra for qA & qB were extracted.
We obtained a spectrum of the hot B-type main sequence star Hip020971 with the NIR arm on the same night. The spectrum was extracted using the same procedure and was subsequently used for atmospheric absorption correction. No flux calibration was applied to either of the spectra.
3 Results
3.1 The NOT/ALFOSC data
The purpose of the NOT spectrum was to study the dynamics of the Ly emitting gas (S4). The resolution of the spectrum is too low to provide any useful information about the DLA metallicity, so the primary interest is in the region around Ly emission. In Fig. 2 (left panel) we show this region of the 2D stacked, sky subtracted spectrum. We here use a negative representation where black is bright and orange is zero. In the centre the DLA absorption trough is a dominant feature, and the arrow points to a small but significant area of extended line emission. To examine the Ly emission closer to the QSO it is necessary first to remove the emission from the QSO, a technique referred to as Spectral-PSF (or SPSF) subtraction (Møller 2000; Møller et al. 2000).
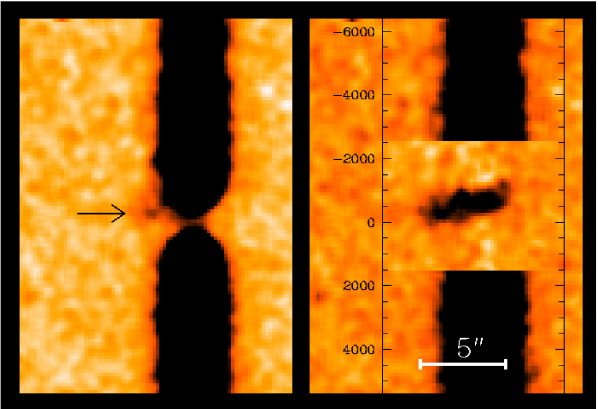

In the right panel of Fig. 2 we show the same part of the spectrum after SPSF subtraction around the extended Ly emission. We clearly detect extended Ly over a total region of about 5 arcsec (42 kpc proper), corresponding well to the extend of the emission seen in narrowband imaging (Fig. 1, lower panel). It is also clear that the emission is not symmetrically distributed around the QSO (also consistent with Fig. 1), that it is well separated (in redshift) from the DLA and, somewhat surprisingly, that the emission has a strong velocity gradient along the major axis which has a remarkable resemblance to a rotation curve. The velocity gradient as measured on the SPSF subtracted spectrum is shown in Fig. 3.
3.2 VLT/X-shooter data
3.2.1 Residual flux in the DLA trough
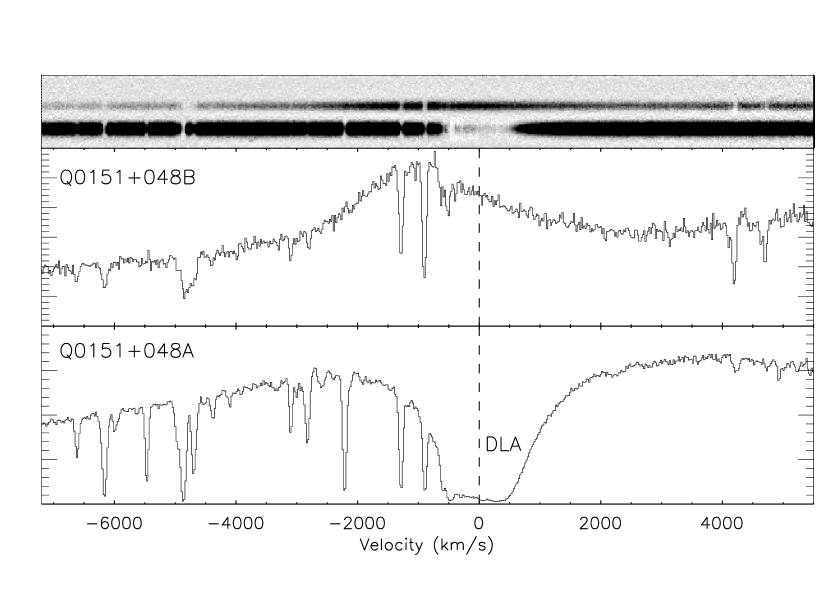
One of the most striking features of the X-shooter spectrum of qA is that the DLA absorption line does not go completely to zero. Ly emission in or close to DLA absorption lines has been seen in several cases. Møller & Warren (1993), Pettini et al. (1995), Djorgovski et al. (1996), Leibundgut & Robertson (1999), Møller et al. (2002), Møller et al. (2004) and Fynbo et al. (2010) all reported a narrow emission line slightly offset from the position of the background quasar and consistent with being Ly emission from the DLA host which absorb the QSO to zero flux at Ly. Cooke et al. (2010) report what they interpret as either a broad absorption line with emission at the centre or as two absorption lines separated by non-absorbed quasar continuum. Unfortunately they do not provide the detailed spatial information which would help the interpretation, but since a possible interpretation of the “feature” is that it is non-absorbed quasar continuum it must be centered on the position of the quasar and have the spatial profile of a point-source. This makes it unlikely that it is Ly emission as Ly emission usually is more extended than a point-source and in addition it would be an unlikely coincidence that the Ly emission by chance would be lined up exactly with the second image of the lens where the DLA covers only the first image.
Hennawi et al. (2009) also report an emission line in a damped absorption line. They do not provide any information about spatial offset, but the object has a large (5 arcsec) size along the slit. Hennawi et al. (2009) rule out that the emission is related to the DLA and instead interpret it as a Ly blob physically connected to the quasar. This object has two features in common with the DLA in qA. Both are PDLAs and both have Ly emission extending 5 arcsec. The extended Ly of qA is however significantly offset in redshift from the PDLA and does not enter into the absorption line. Nevertheless in both the 2D and the 1D X-shooter spectrum of qA (Fig. 4) it is clearly seen that there is a smooth continuum providing a non-zero “floor” in the Ly line. In this section we aim to determine the source of this residual flux in the damped absorption line.
There are two possible ways to explain this residual flux. Either the absorber is so small that it only partly covers the emitter (the central engine), or there are at least two different sources of emission and the DLA absorber is only covering one of those. In Fynbo et al. (2000) it was reported that qA is located inside a comparatively bright host galaxy with a () magnitude of and () of . The host was best fitted by a de Vaucouleurs profile, and in () it was found to be 3.0 magnitude fainter than qA while in () and () it was 3.9 and 4.0 magnitude fainter respectively. We now investigate if the residual flux in the DLA trough simply is the spectrum of the QSO host galaxy.
We first co-added the profile of all wavelength bins in the centre of the DLA line where it should be completely absorbed. We then did the same where the QSO continuum had recovered both on the blue side ( Å) and on the red side ( Å). The FWHM of the QSO profile along the slit on both the blue and the red side is 1.03 arcsec while the FWHM of the flux at the bottom of the DLA is 1.57 arcsec, i.e. significantly wider. Simple subtraction in squares gives an intrinsic FWHM of 1.2 arcsec for the object seen in the DLA line which immediately rules out that the residual could be caused by partial coverage of the QSO alone because in this case the profile should be the same as that of the QSO. The object that we see in the DLA trough is therefore a different object than the QSO, it is relatively large (1.2 arcsec FWHM) and could possibly be the host galaxy.
The spectrum was taken with a slit of and we therefore have slit losses of both the QSO and of the other object. We have modeled the psf of the QSO such that the psf-on-slit is identical to that observed. Using this we measure a slit loss of . Similarly we have modeled the profile of the object seen in the trough, and find slit losses of in this case. The measured counts per bin of the extended object is a factor 27 less than of the QSO continuum. Correcting for the different slit losses this becomes a factor 18 fainter, i.e. 3.1 magnitudes fainter. This corresponds well to the reported magnitude difference as found via imaging (Fynbo et al. 2000). From Fig. 4 upper panel (more clearly seen in Fig. 7) it is also seen that the two objects are centered on the same position.
Summing up all of the evidence, extended profile, centered on the QSO, similar brightness relative to qA, we conclude that the flux seen in the DLA trough is the signature of the object reported to be the host in (Fynbo et al. 2000). It remains to be determined whether the flux from the host is stellar emission or dust reflection. The gradient of the emission in the trough could suggest that it at least partly is quasar light reflected off dust in the host halo. Spectro-polarimetric data would be required to resolve this question.
| Object | ID | ||||||
| qA: | 3612.1710 | 1240.13 | 13.658 | 0.237 | 4.688 | ||
| 3694.1012 | 1262.59 | 3.9000 | 0.090 | 1.330 | |||
| 3814.8126 | 1304.35 | 11.400 | 0.113 | 3.900 | |||
| 3894.1912 | 1334.50 | 3.8000 | 0.087 | 1.300 | |||
| 4063.6774 | 1399.70 | 40.350 | 0.198 | 13.90 | |||
| 4504.6833 | 1549.06 | 62.700 | 0.266 | 21.56 | |||
| 6804.3376 | UV 344(2325.38) | 19.160 | 0.110 | 6.550 | Fe ii | ||
| 7109.3696 | UV 360(2433.436) | 10.730 | 0.140 | 3.670 | Fe ii | ||
| 8188.7607 | 2798.75 | 96.440 | 0.240 | 32.96 | |||
| 14244.000 | 4862.68 | 119.80 | 0.280 | 40.90 | |||
| 19231.400 | 6564.61 | 525.56 | 0.810 | 179.4 | |||
| qB: | 3557.3960 | 1215.67 | 243.70 | 0.923 | 83.300 | Ly | |
| 3628.3042 | 1240.14 | 8.2900 | 0.631 | 2.8300 | |||
| 3678.1892 | 1262.59 | 2.1300 | 0.409 | 0.7300 | |||
| 3810.1611 | 1304.35 | 2.3840 | 1.009 | 0.8190 | |||
| 4094.7356 | 1399.70 | 32.023 | 0.963 | 10.986 | |||
| 4528.4208 | 1549.06 | 60.699 | 1.039 | 20.752 | |||
| 8198.4067 | 2798.75 | 89.800 | 0.270 | 30.650 | |||
| 19225.300 | 6564.61 | 492.72 | 2.580 | 168.20 |
3.2.2 Emission line analysis of Q 0151+048A & B
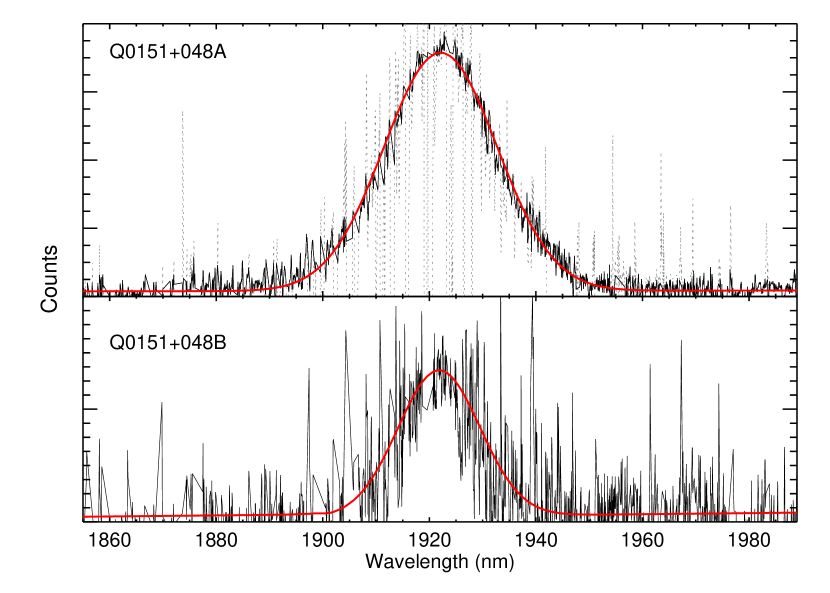
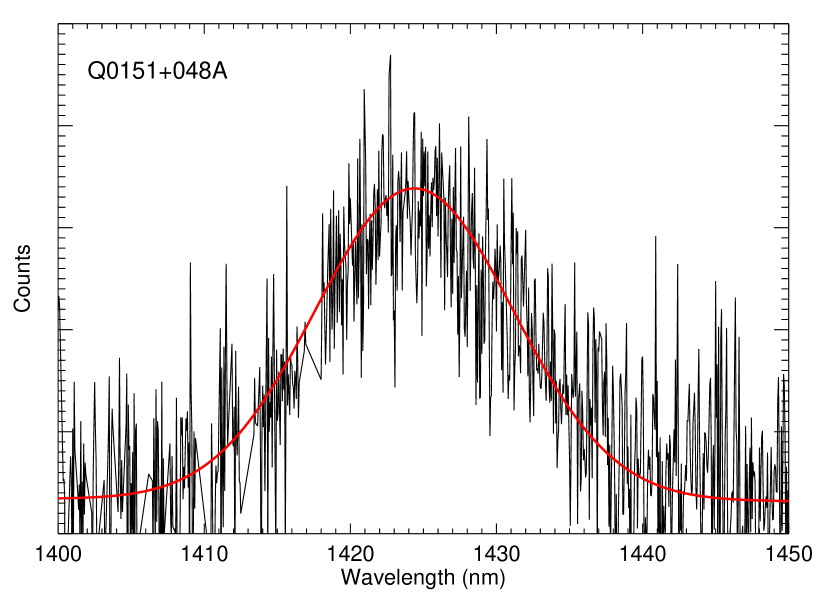
The original interpretation of the Ly emission from this system was severely complicated by the large apparent blueshift of qA relative to the DLA (1250 km s-1) as well as to the Ly emitter. Such shifts are common in QSOs spectra (see Grandi 1982; Wilkes 1986; Møller & Warren 1993; Laor et al. 1995; McIntosh et al. 1999; Vanden Berk et al. 2001; Richards et al. 2002), but even though there is a general pattern to the shifts it has not yet been possible to device a method to successfully correct for this. We therefore had serious doubts about the accuracy of QSO systemic redshifts determined from UV emission lines, and one of the two main drivers for the X-shooter spectroscopy was to obtain systemic redshifts based on rest-frame optical emission lines. This is possible because of the X-shooter NIR arm. In Fig. 5 and 6 we show the and emission lines respectively. For qB, the fainter of the two QSOs, only was detected. The blue part of the emission lines was affected by atmospheric absorption which corrected out well with the use of hot B-type main sequence stars.
In Table 2 we list observed and rest-frame parameters for the emission lines of the spectra of qA & qB. The continuum is well detected for both QSOs and the equivalent widths are measured by integrating the emission line between the end points and above the estimated continuum. For the and inferred we use the same peak (or mode) definition as in Møller et al. (1998). It is seen that the inferred redshifts of qA range from 1.9034 to 1.92939 corresponding to a relative velocity of 2700 km s-1 vindicating our doubts about the previous redshift determination.
The narrow and unblended emission line is presumed to trace the systemic (center of mass) redshift of the galaxy (Gaskell 1982; Vrtilek & Carleton 1985; McIntosh et al. 1999). Unfortunately the emission lines at our redshift are in a region of strong telluric absorption. The telluric absorption combined with the very narrow profile of makes it impossible to recover the lines via telluric correction. The line is in a part of the spectrum which is even stronger absorbed, but the width of the line is here helpful in recovering parts of the line. The line is intrinsically fainter than the but in a region of less telluric absorption and therefore easier to recover.
In addition to the telluric absorption there are many strong sky emission lines present causing large residuals after sky subtraction. With the high resolution of X-shooter and for the wide and lines this is not problematic as we simply masked out the affected intervals and used only the remaining sections (see Fig. 5). We subtracted continuum from the emission lines and then proceeded to fit a smooth profile to the central part of the lines using only the intervals not masked out. After the fit to the data we used the error spectrum to create 1,000 random realizations of errors, added those to the spectrum and repeated the process. In Table 2 we list the of this distribution as statistical errors on the redshift. For qA we compute the optimally combined redshift as the weighted mean of the two lines and obtain , for qB we only have and therefore simply adopt the redshift of that line as the systemic . Redshifts determined from those lines are known to have an offset of only a few tens of km s-1 from the true systemic redshift of the QSO (Vanden Berk et al. 2001).
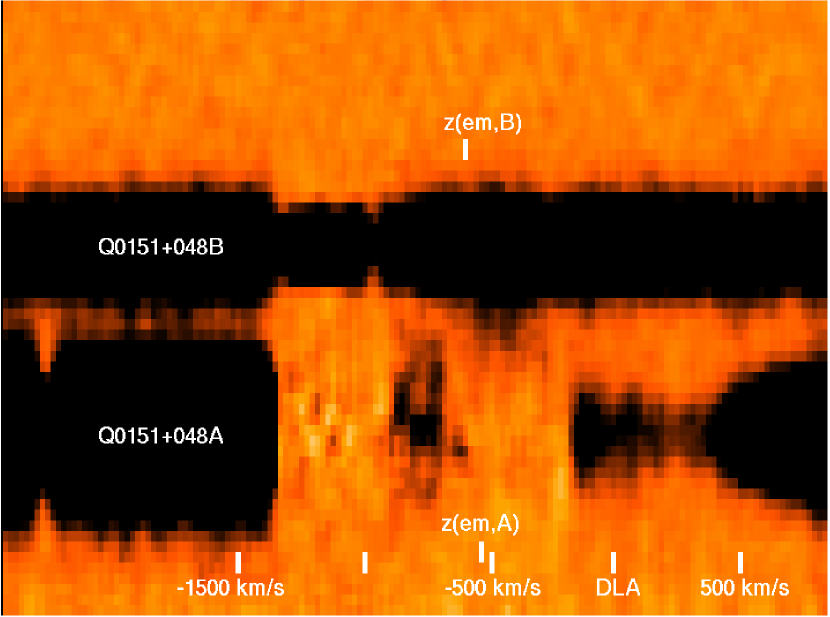
3.2.3 Extended emission in the X-shooter spectrum
In Fig. 1 it is seen that the X-shooter slit follows a line across the Ly emitter more closely aligned with it’s minor axis. We would still expect to see some extended emission, but not extending as far away as for the NOT spectrum. To confirm this expectation we therefore also performed SPSF subtraction on the X-shooter spectrum. The result is shown in Fig. 7, where we have marked the redshifts of both QSOs relative to that of the DLA. SPSF subtraction of qA was only performed in the range to km s-1 (relative to the DLA redshift). This procedure left the flux from the host galaxy inside the DLA trough and clearly shows that the damped line does not at any point go to zero flux. Also it is seen that the host is precisely lined up with the position of qA. The extended Ly is also here seen to be asymmetric and to stretch about half way towards qB, consistent with the NB imaging (Fig. 1). The emission is here offset 750 km s-1 from the DLA, it has a FWHM of 200 km s-1 and there is no obvious evidence for a rotation curve along this axis. The difference in velocity offset at the position of the quasar seen at the two different slit PAs is due to the integration of the velocity field over different parts of the blob. The velocity measured along the major axis is less affected by this and we obtain a weighted combined offset of km s-1.
There seems to be marginal evidence for a double-emission profile with a splitting of 140 km s-1 but the S/N of the data is too low to make any conclusive statements about this. Double-peaked emission line profiles from Ly were predicted by Harrington (1973) from a static, un-absorbing, opaque scattering medium. Verhamme et al. (2006) obtained the same result using a 3D Ly radiative transfer code with a Monte-Carlo fitting method, and subsequently used the code to fit Ly lines in a sample of high redshift Lyman-break galaxies (LBGs; Verhamme et al. 2008). In this publication, two LBGs had double emission line peaks and were best fitted with a dust-free, nearly static medium. Thus, if it can be confirmed that the emission line profile is indeed double-peaked then this could be indicating that the blob is static rather than infalling or the signature of an expanding wind.
| ID | log | |||||||
| km s-1 | ||||||||
| 3634.960 | … | … | … | (1238) | 1.93421 | … | ||
| 3646.650 | … | … | … | (1242) | 1.93421 | … | ||
| 3519.770 | 0.070 | 0.030 | … | (1199) | 1.93424 | … | ||
| 3820.900 | 0.681 | 0.029 | 0.232 | (1302) | 1.93426 | 20.12.1 | ||
| 3915.800 | 0.724 | 0.037 | 0.247 | (1334) | 1.93421 | 18.80.2 | ||
| 3919.150 | 0.050 | 0.015 | 0.017 | (1335.7) | 1.93414 | … | ||
| 4542.600 | 0.928 | 0.040 | 0.316 | (1548) | 1.93413 | 18.90.4 | ||
| 4550.155 | 0.813 | 0.035 | 0.277 | (1550) | 1.93413 | 18.90.4 | ||
| 3492.924 | 0.790 | 0.023 | … | (1190) | 1.93421 | …333The line is blended with a Ly forest line and was not included in the overall fit. | … | |
| 3501.357 | 0.362 | 0.014 | 0.123 | (1193) | 1.93421 | 18.60.4 | ||
| 3698.343 | 0.767 | 0.034 | 0.261 | (1260) | 1.93421 | 18.60.4 | ||
| 3827.300 | 0.265 | 0.030 | 0.100 | (1304) | 1.93421 | 18.60.4 | ||
| 4479.678 | 0.459 | 0.026 | 0.156 | (1526) | 1.93421 | 18.60.4 | ||
| 5305.090 | … | … | … | (1808) | 1.93421 | … | ||
| 3540.130 | 0.804 | 0.030 | 0.270 | (1206) | 1.93421 | 18.80.3 | ||
| 4089.480 | 0.640 | 0.065 | 0.218 | (1393) | 1.93415 | 19.20.7 | ||
| 4115.933 | 0.517 | 0.035 | 0.180 | (1402) | 1.93415 | 19.20.7 | ||
| 3359.492 | 0.103 | 0.024 | 0.035 | (1144) | 1.93421 | 18.80.3 | ||
| 4719.540 | 0.144 | 0.035 | 0.049 | (1608) | 1.93421 | 18.80.3 | ||
| 4727.600 | … | … | … | (1611) | 1.93421 | … | ||
| 6967.170 | 0.138 | 0.010 | 0.047 | (2374) | 1.93421 | 18.80.3 | ||
| 6991.530 | 0.883 | 0.010 | 0.301 | (2382) | 1.93421 | 18.80.3 | ||
| 7589.770 | 0.410 | 0.013 | 0.140 | (2586) | 1.93421 | 18.80.3 | ||
| 4902.464 | 0.321 | 0.041 | 0.110 | (1670) | 1.93423 | 18.80.2 | ||
| 5442.160 | 0.09 | 0.023 | 0.030 | (1854) | 1.93423 | |||
| 5465.850 | 0.060 | 0.030 | 0.020 | (1862) | 1.93423 | |||
| 8205.080 | 1.611 | 0.010 | 0.550 | (2796) | 1.93421 | 18.80.3 | ||
| 8226.140 | 1.380 | 0.011 | 0.470 | (2803) | 1.93421 | 18.80.3 | ||
| 8371.210 | 0.058 | 0.021 | 0.020 | (2852) | 1.93421 | … |
4 Absorption line analysis
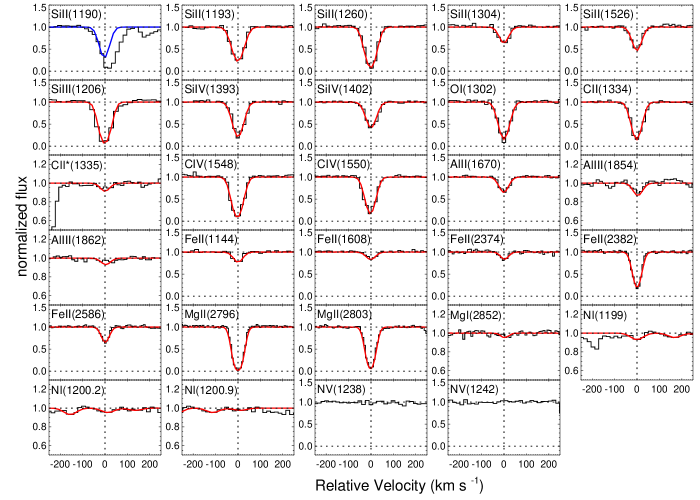
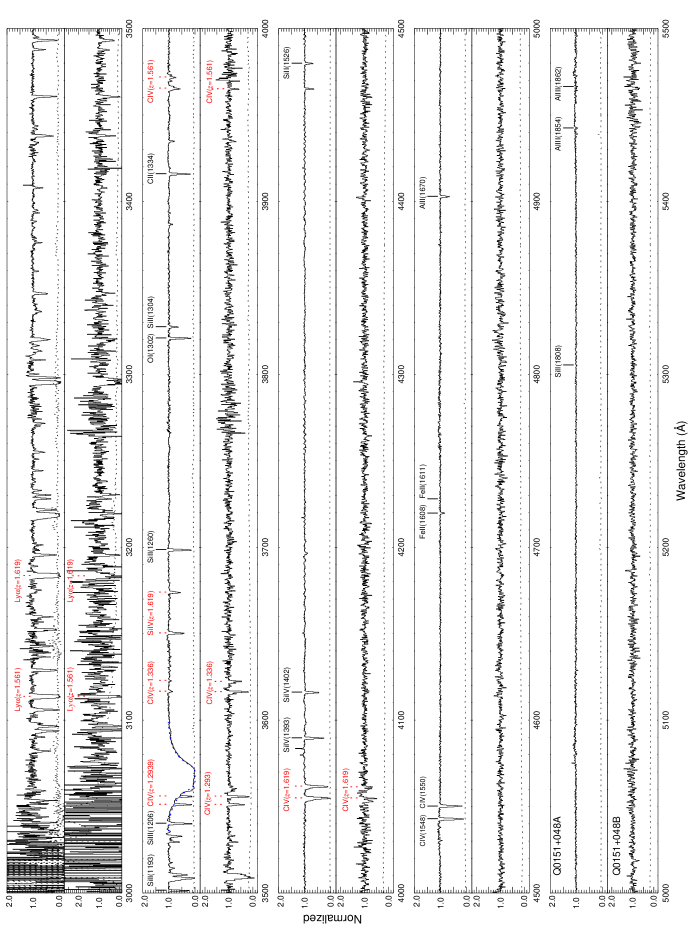
The X-shooter absorption line spectra are plotted in Fig. 11. The medium resolution of X-shooter allows us to perform absorption line profile fitting and determine column densities from lines that are not heavily saturated. Our second main driver for the X-shooter spectroscopy was therefore to derive ionic column densities and element abundances for the DLA system observed in the spectrum of qA.
Element abundances are important for our understanding of this system, first because it has been suggested that the DLA metallicity is related to the mass and luminosity of the DLA galaxy (Møller et al. 2004; Ledoux et al. 2006; Fynbo et al. 2008; Prochaska et al. 2008b) second because it can provide us with limits on the QSO/DLA distance (§4.2) which are needed in order to determine the arrangement of the QSO/DLA/Ly emitter system in 3D space rather than redshift space. In addition several systems at lower redshifts are also seen in the X-shooter spectra and for completeness we also identify those (§4.3).
4.1 Absorption lines of the DLA system
Møller et al. (1998) reported an column density of the DLA of log . In our higher quality data we determine a column of log at . The Voigt profile fit to the DLA is overplotted in blue on the normalized spectrum in Fig. 11. At the same redshift we also identify several metal lines in the spectrum of qA, of which none are seen in the spectrum of qB down to a 3 upper limit of 0.08 Å (see Fig. 11). We identify lines from , , , , , , , , , , and . Equivalent widths and corresponding 1 sigma errors of those lines are listed in Table 3.
We used the Voigt profile fitting FITLYMAN package in MIDAS (Fontana & Ballester 1995) and adopted the list of atomic data, laboratory wavelengths and oscillator strengths from Morton (2003). FITLYMAN finds the best global fit using a minimization algorithm which includes the spectral resolution and returns best fit parameters for redshift, column density and Doppler turbulent broadening as well as errors on each quantity. It may be used to fit single lines one at a time, or one may (optionally) choose to fit several lines with the same parameters (one may e.g. insist that all the chosen lines have the same redshift or turbulent broadening).
We employed FITLYMAN in two ways. First we chose to fit all lines with the same redshift and turbulent broadening. The resulting fits were mostly very good, but for a few atoms and ions (e.g. and ) the fits were slightly offset from the data. We therefore chose to fit each ionic species independently allowing them to have different redshifts and turbulent broadening. The resulting column densities did not change significantly from one procedure to the other so our results are not depending on this choice. The FITLYMAN output parameters are listed in Table 3 and the resulting fits (red) are shown overlaid on the data in Fig. 8. Note that the line is in the Lyman forest and clearly blended with an intervening line. That line was not used for the fit, but the predicted line is plotted for completeness.
While the signal-to-noise ratio of our X-shooter spectrum is excellent, its resolving power is not high enough to resolve the lines which at this resolution may have hidden velocity sub-structure. Accurate column densities can only be derived from weak lines while the column densities of stronger lines may be underestimated due to hidden saturation. For this reason, we consider our fit results for , and to be lower limits. For , , , , and , hidden saturation could be an issue in case additional components with values narrower than 3 km s-1 are present. The non-detection of sets an upper limit of on the column density of any component with a of 3 km s-1. Ellison et al. (2010) presented a spectrum of qA of high resolution ( km s-1 FWHM) with similar detection limits as the X-shooter spectrum. By way of comparison, we note that our column densities of , , , and are 0.09, 0.11, 0.10, 0.11 and 0.06 dex lower than those measured by Ellison et al. (2010) which we take as the error induced by the uncertainty on our derived value. This shows that narrow hidden components account for less than 0.1 dex of the total column densities of these ions.
For non-detected lines, we report in Table 3 column density upper limits. For those, we computed the column densities assuming them to be on the linear part of the curve-of-growth rather than from the Voigt-profile fitting.
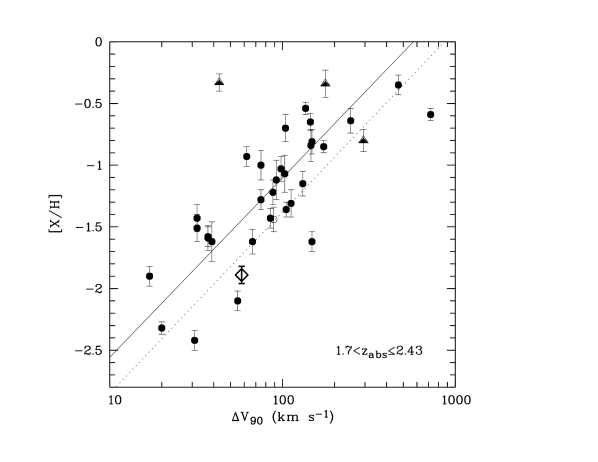
In the last column of Table 3, we adopt the solar abundances from Asplund et al. (2009) to derive metallicities relative to solar. We find a silicon abundance, which is commonly used to define DLA metallicities, of , suggesting a metal-poor system (see Fig. 9, Ledoux et al. 2006; Prochaska et al. 2008a). We determine a line velocity width of 64 km s-1 as defined in Ledoux et al. (2006) using which, after correction for the instrumental resolution of 27 km s-1, leads to 58 km s-1. In Fig. 9, we plot this together with the 35 DLAs in the redshift range 1.7 to 2.43 taken from Ledoux et al. (2006).
One can see that the point follows the general metallicity/velocity width relation at , but that it falls within the 10–15% lowest metallicities, and that it lies on the high V side of the bisector fit (in the widest 15%).
Collisions with electrons are the dominant excitation mechanism to populate the upper fine-structure energy level of the ground state (see also Williams & Weymann 1976). The line can therefore be used to set an upper limit on the particle density . Unfortunately, the line only provides a column density lower limit due to saturation, but assuming solar abundance ratio of Si/C we can use as a proxy and compute the column density. We find that: log , and from fig. 4 of (Silva & Viegas 2002), we determine a particle density of cm-3.
4.2 Photo-ionization model of the DLA
Based on the column densities reported above, we now make a simple photo-ionization model of the absorbing cloud. The main purpose of the model is to constrain the distance between qA and the DLA. For the model, we use Cloudy version 07.02 described by Ferland et al. (1998). The Cloudy calculations are based on the following assumptions. The cloud is assumed to be a plane-parallel slab of gas with total neutral hydrogen column density log , metallicity 1/100th of solar, solar relative abundance ratios, and a particle density in the neutral phase () of 25 cm-3. The radiation field is composed of the Cosmic Microwave Background at and, towards one side of the cloud, the radiation spectrum of a typical AGN with specific luminosity at the Lyman limit erg s-1 Hz-1. The latter value has been determined using the flux-calibrated spectrum obtained from NOT in August 2008 and a best-matched spectral slope of between rest-frame 850 and 1600 Å (see Telfer et al. 2002).
Using this model, we performed a series of photo-ionization equilibrium calculations for a range of QSO-DLA distances and computed ionic column densities. Keeping in mind that this is a simple model we can nevertheless apply our observational constraints to get an estimate of the distance.
From log , we find agreement for kpc while the upper limit log sets a hard lower limit on the distance of kpc. This model is therefore in best agreement with a distance of 30-40 kpc assuming no local source of ionization. The column densities of the higher ionization gas (, and ) are all lower limits but we note in passing that those limits are all consistent with the above distance estimate.
4.3 Intervening absorbers
The primary purpose of the X-shooter spectroscopy was to characterize the DLA and the QSO. In addition to the DLA four other absorption systems at redshifts 1.2939, 1.3360, 1.5613, and 1.6192 were identified in the spectra. All four doublets are seen in both spectra (as seen in Fig. 11) indicating that absorbers at those redshifts typically have sizes larger than 30 kpc and covering factors close to unity. This is consistent with previous studies (Rauch et al. 2001; Ellison et al. 2004). One of the absorbers () is also seen as absorber in the sightline towards qA, but not towards qB, which might indicate that absorbers extend to smaller distances than absorbers.
5 What is the Q 0151+048A&B/DLA/Ly-blob system?
This complex system has been the target of several studies because it brings together several types of objects which at this redshift are usually seen only separately. The mix of objects has made the interpretation difficult, yet at the same time the interaction between the objects allow us to extract information which is not normally accessible and can only be obtained for this unique system. Earlier interpretations were hampered by the lack of certain vital information but the new X-shooter data have now allowed us a more complete view of this system.
5.1 Geometry of the system
Fig. 7 summarizes what we know about the redshifts of the components. The issue with the redshifts of the QSOs has been resolved causing qA to be moved 740 km s-1 towards higher redshift. This means that qA is now offset only 100 km s-1 from the Ly emission (at the position of qA) in the NOT spectrum, and 200 km s-1 in the X-shooter spectrum. The difference is presumably arising from the different way the velocity field of the emitter has been averaged over the slit in the two observations. The velocity offset between the DLA and the Ly blob is much larger ( km s-1). All taken together the logical conclusion is that the blob is associated with qA and its host galaxy rather than with the DLA as it was previously thought. The end-to-end size of the blob along it’s major axis is about 5 arcseconds corresponding to 42 kpc, and 28 kpc along its minor axis while the projected distance from qA to qB is 27.7 kpc. Based on the ionization state of the gas we find that the DLA cloud is placed along our line of sight towards qA at a distance larger than kpc.
5.2 Dynamical state of the system
| qA | qB | ||
|---|---|---|---|
| FWHM H (km s-1) | … | ||
| FWHM (km s-1) | |||
| FWHM (km s-1) | |||
| ( erg s-1) | (5100 Å) | ||
| ( erg s-1) | (3000 Å) | ||
| ( erg s-1) | (1450 Å) | ||
| / | (H) | … | |
| / | () | ||
| / | () | ||
| / | |||
| log |
The systemic redshift difference between qA and qB is very small (60 km s-1 and consistent with zero to within less than 2) suggesting that their relative movement is in the plane of the sky. This would imply that their physical separation is the same as their projected separation. The Ly blob has a velocity gradient along its major axis and through qA. This may be caused by infalling gas which is being ionized where it falls into the ionizing cones of qA as it was described in the models by Weidinger et al. (2004, 2005) but it could also be the signature of a rotating disk. From Fig. 3, and considering the resolution of the data along the slit corresponding to a smoothing length of 13 kpc, we see that the current data are indeed consistent with the rotation curve of a large spiral galaxy in todays universe. A spectrum with better spatial resolution, and along the major axis of the blob, would be needed to discriminate between the two possibilities.
The DLA absorber is a separate object which is moving towards the Ly blob with a relative velocity of km s-1.
5.3 Black Hole masses, DM Halo masses and Eddington ratios
The mass of the DM halo of the QSO Q1205-30 at was determined from a model of the gas falling into its potential well and was found to be in the range log (Weidinger et al. 2004). As discussed in §5.2 it is not clear in our case if the dynamical signature of the gas is caused by infall or rotation so we shall use a different method to determine the DM halo mass.
First we derive Black hole (BH) masses following Vestergaard & Peterson (2006, formulae 5 & 7) and use the relation between BH mass, H and emission lines width and the continuum luminosity at 5100 Å and 1450 Å rest wavelength. We also estimated BH mass using the relation between and continuum luminosity at rest-frame 3000 Å (Vestergaard & Osmer 2009, formula 1). For the line widths we use the FWHM of the fitted gaussian for each emission line and we list those in Table 4. We corrected the FWHM of each line for spectral resolution as described in Peterson et al. (2004). For qB we do not have the H emission line width, therefore, we have no mass estimation from that line.
To obtain the continuum luminosity at 5100, 3000 and 1450 Å we use the -band magnitudes of the two QSOs from Warren et al. (2001) and the and -band magnitudes from Fynbo et al. (2000). We also checked for line contamination in these band and for this we used the composite spectrum from Vanden Berk et al. (2001). We subtracted emission line components from the spectrum and found the contamination to be 14, 15 and 7% in the , and bands respectively. After subtracting the contamination the resulting BH masses are listed in Table 4. It has recently been established that BH mass correlates well with the underlying total gravitational mass (presumably dominated by the dark matter) of the host halo (Bandara et al. 2009). We use this correlation to finally obtain the corresponding halo mass of each QSO by using their mean BH mass and those are also listed in Table 4.
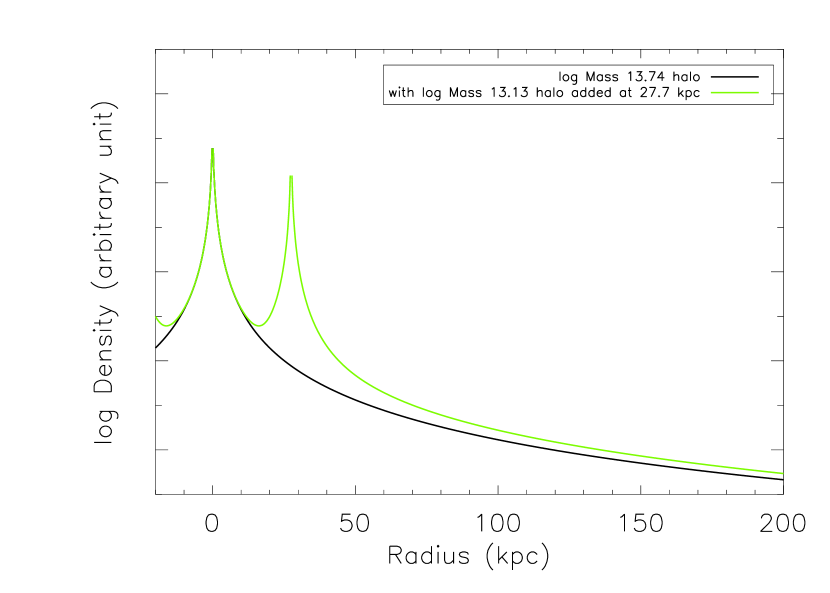
In Fig. 10 we plot the density profile of the two halos assuming that they have NFW profiles (Navarro et al. 1997) and that their projected distance (27.7 kpc) is also their real proper distance as argued in §5.2. It is seen that qB is inside the halo of qA, but that it is still clearly defined as a separate sub-halo. We used the prescription from Nemmen & Brotherton (2010) and Gavignaud et al. (2008) to determine bolometric luminosities and eddington ratios (provided in Table 4) respectively.
6 Discussion and Conclusions
In this paper we have presented spectra of the two QSOs Q 0151+048A and Q 0151+048B as well as of a Ly blob at the same position. We obtained spectra of the blob at two different position angles. QSO redshifts determined from H and H change the previously reported redshifts by 740 km s-1 in addition to the much smaller corrections previously suggested by Tytler & Fan (1992). Our first conclusion is that the corrections to QSO redshifts based on rest-frame UV lines can be much larger than previously thought and that other QSO absorption systems of this kind (i.e. with large inverted redshift offsets) presumably will turn out to find the same resolution.
The new redshift of qA means that the Ly blob is now more likely belonging to this QSO. We determine a Black Hole mass of qA of and a corresponding DM halo mass of . The Ly blob is sitting in the potential well of this halo. The blob has a size of 42 by 28 kpc, it has a clear signature of a strong velocity gradient along its major axis which is consistent with the rotation curve of a large disk galaxy in todays universe but may alternatively be caused by in- or out-flow. In the X-shooter spectrum along the minor axis which has higher spatial resolution there is no velocity gradient of the blob, but there is a hint that the Ly emission may be double peaked.
Interpolating in the merger tree simulations of Parkinson et al. (2008) we find that the halo of qA in the mean will end up in a halo with a mass of M⊙ at . We report bolometric accretion rates of both quasars and find that they accrete at 60% and 30% of their Eddington limits. This places both qA and qB consistently on the relation shown in fig. 4 of Gavignaud et al. (2008).
From the aspect of the two quasars they therefore appear to be very typical for quasars at that redshift, and their environment is apparently a proto-typical pre-cursor of what will become something very close to our local super-cluster at . What makes this system special is the accidental alignment of many different types of objects so close together. The physical interactions between the dual quasar, the Ly blob, the host galaxies and the PDLA absorber makes this a unique laboratory to study what seems to be what our local super-cluster looked like at .
The metallicity of the DLA inferred from the X-shooter medium resolution spectrum is , in the lowest 15% of DLAs at this redshift. This stands in contrast to the recent result by Ellison et al. (2010) who reported that PDLAs in general have higher metallicity than intervening DLAs.
Based on the ionization state of the gas we model the physical state of the DLA and find a best fit at a distance of 30-40 kpc from qA assuming that contribution of local star-formation can be ignored. Under the same assumption, and using a different method, Ellison et al. (2010) found that the distance must be larger than 160.5 kpc. In case there is local star formation close to the DLA our model would only provide a lower limit and would be consistent with the result of Ellison et al. (2010).
The DLA falls nicely on the relation of velocity-width vs metallicity Ledoux et al. (2006). Using the vs the -band magnitude relation derived in that paper we predict that the DLA should have an R-band brightness of about and a Ly flux of around erg s-1 cm-2. This object is therefore not observable in emission in our data, consistent with the interpretation of the Ly blob belonging to the host galaxy and not to the DLA.
Heckman et al. (1991) reported the detection of “fuzz” around radio loud quasars and argued that the fuzz had to be clumpy on small scales with a very small filling factor. Weidinger et al. (2004) reported similar fuzz around a radio quiet quasar and showed that its velocity profile and morphology implied that it was in a state of infall. That quasar also exhibit a strong absorber close to its emission redshift, a system which in current terminology may be named a proximate sub-DLA. The clumpiness on small scales and the small filling factor predicted by Heckman et al. (1991) matches the few known PDLA systems well (qA, Leibundgut & Robertson 1999, Weidinger et al. 2004, Hennawi et al. 2009) and like Hennawi et al. (2009) we consider it likely that PDLA Ly blobs in some ways are related to the fuzz around radio loud quasars. However, there are significant differences in terms of energy output, in the measured Ly line widths (which is much narrower for qA), in the mechanical interaction with the radio jet and in the fact that metal emission lines are detected in the fuzz around radio loud object. The case of qA is therefore more similar to that of Weidinger et al. (2004) and the negative velocity of the DLA is an indication that it is in a similar state of infall.
We detect emission in the trough of the DLA which we interpret as the signature of the quasar host galaxy. It is interesting to note that the hosts were not detected in any of the three above mentioned cases which are all at . This is consistent with recent reports that there is a rapid transition of Ly selected objects observed at a redshift of about 2.5 (Nilsson & Møller 2009, 2011).
We briefly report the detection of four intervening systems seen in both sightlines of which one system has absorption seen only in a single sighline. Also we see rich Lyman forests with near identical absorption signatures. This QSO pair is therefore well suited for a multi-sightline study of both Lyman forest absorbers and of intervening metal absorbers.
Acknowledgements.
The Dark Cosmology Centre is funded by the Danish National Research Foundation. We are thankful to the VLT X-shooter team. X-shooter is funded with contributions from ESO, Danish, Dutch, Italian and French partners. We are thankful to the anonymous referee for the constructive comments. We are thankful to Sara Ellison, Marianne Vestergaard and Alain Smette for helpful comments.References
- Asplund et al. (2009) Asplund, M., Grevesse, N., Sauval, A. J., & Scott, P. 2009, ARA&A, 47, 481
- Bandara et al. (2009) Bandara, K., Crampton, D., & Simard, L. 2009, ApJ, 704, 1135
- Burbidge (1968) Burbidge, E. M. 1968, ApJ, 154, L109
- Cooke et al. (2010) Cooke, R., Pettini, M., Steidel, C. C., et al. 2010, MNRAS, 409, 679
- Dey et al. (2005) Dey, A., Bian, C., Soifer, B. T., et al. 2005, ApJ, 629, 654
- Djorgovski et al. (1996) Djorgovski, S. G., Pahre, M. A., Bechtold, J., & Elston, R. 1996, Nature, 382, 234
- D’Odorico et al. (2006) D’Odorico, S., Dekker, H., Mazzoleni, R., et al. 2006, in Presented at the Society of Photo-Optical Instrumentation Engineers (SPIE) Conference, Vol. 6269, SPIE Conference Series
- Ellison et al. (2004) Ellison, S. L., Ibata, R., Pettini, M., et al. 2004, A&A, 414, 79
- Ellison et al. (2010) Ellison, S. L., Prochaska, J. X., Hennawi, J., et al. 2010, MNRAS, 814
- Ferland et al. (1998) Ferland, G. J., Korista, K. T., Verner, D. A., et al. 1998, PASP, 110, 761
- Fontana & Ballester (1995) Fontana, A. & Ballester, P. 1995, The Messenger, 80, 37
- Francis et al. (2001) Francis, P. J., Williger, G. M., Collins, N. R., et al. 2001, ApJ, 554, 1001
- Freedman et al. (2001) Freedman, W. L., Madore, B. F., Gibson, B. K., et al. 2001, ApJ, 553, 47
- Fynbo et al. (2010) Fynbo, J. P. U., Laursen, P., Ledoux, C., et al. 2010, MNRAS, 408, 2128
- Fynbo et al. (2008) Fynbo, J. P. U., Prochaska, J. X., Sommer-Larsen, J., Dessauges-Zavadsky, M., & Møller, P. 2008, ApJ, 683, 321
- Fynbo et al. (2000) Fynbo, J. U., Burud, I., & Møller, P. 2000, A&A, 358, 88
- Fynbo et al. (1999) Fynbo, J. U., Møller, P., & Warren, S. J. 1999, MNRAS, 305, 849
- Gaskell (1982) Gaskell, C. M. 1982, ApJ, 263, 79
- Gavignaud et al. (2008) Gavignaud, I., Wisotzki, L., Bongiorno, A., et al. 2008, A&A, 492, 637
- Geach et al. (2009) Geach, J. E., Alexander, D. M., Lehmer, B. D., et al. 2009, ApJ, 700, 1
- Goldoni et al. (2006) Goldoni, P., Royer, F., François, P., et al. 2006, in Presented at the Society of Photo-Optical Instrumentation Engineers (SPIE) Conference Series, Vol. 6269
- Grandi (1982) Grandi, S. A. 1982, ApJ, 255, 25
- Harrington (1973) Harrington, J. P. 1973, MNRAS, 162, 43
- Heckman et al. (1991) Heckman, T. M., Lehnert, M. D., van Breugel, W., & Miley, G. K. 1991, ApJ, 370, 78
- Hennawi et al. (2009) Hennawi, J. F., Prochaska, J. X., Kollmeier, J., & Zheng, Z. 2009, ApJ, 693, L49
- Keel et al. (1999) Keel, W. C., Cohen, S. H., Windhorst, R. A., & Waddington, I. 1999, AJ, 118, 2547
- Kelson (2003) Kelson, D. D. 2003, PASP, 115, 688
- Laor et al. (1995) Laor, A., Bahcall, J. N., Jannuzi, B. T., Schneider, D. P., & Green, R. F. 1995, ApJS, 99, 1
- Ledoux et al. (2006) Ledoux, C., Petitjean, P., Fynbo, J. P. U., Møller, P., & Srianand, R. 2006, A&A, 457, 71
- Leibundgut & Robertson (1999) Leibundgut, B. & Robertson, J. G. 1999, MNRAS, 303, 711
- Matsuda et al. (2004) Matsuda, Y., Yamada, T., Hayashino, T., et al. 2004, AJ, 128, 569
- Matsuda et al. (2006) Matsuda, Y., Yamada, T., Hayashino, T., Yamauchi, R., & Nakamura, Y. 2006, ApJ, 640, L123
- McIntosh et al. (1999) McIntosh, D. H., Rix, H., Rieke, M. J., & Foltz, C. B. 1999, ApJ, 517, L73
- Meylan et al. (1990) Meylan, G., Djorgovski, S., Weir, N., & Shaver, P. 1990, The Messenger, 59, 47
- Miley & De Breuck (2008) Miley, G. & De Breuck, C. 2008, A&A Rev., 15, 67
- Modigliani et al. (2010) Modigliani, A., Goldoni, P., Royer, F., et al. 2010, in Society of Photo-Optical Instrumentation Engineers (SPIE) Conference Series, Vol. 7737
- Møller (2000) Møller, P. 2000, The Messenger, 99, 31
- Møller et al. (2004) Møller, P., Fynbo, J. P. U., & Fall, S. M. 2004, A&A, 422, L33
- Møller & Warren (1993) Møller, P. & Warren, S. J. 1993, A&A, 270, 43
- Møller et al. (2002) Møller, P., Warren, S. J., Fall, S. M., Fynbo, J. U., & Jakobsen, P. 2002, ApJ, 574, 51
- Møller et al. (2000) Møller, P., Warren, S. J., Fall, S. M., Jakobsen, P., & Fynbo, J. U. 2000, The Messenger, 99, 33
- Møller et al. (1998) Møller, P., Warren, S. J., & Fynbo, J. U. 1998, A&A, 330, 19
- Mori et al. (2004) Mori, M., Umemura, M., & Ferrara, A. 2004, ApJ, 613, L97
- Morton (2003) Morton, D. C. 2003, ApJS, 149, 205
- Navarro et al. (1997) Navarro, J. F., Frenk, C. S., & White, S. D. M. 1997, ApJ, 490, 493
- Nemmen & Brotherton (2010) Nemmen, R. S. & Brotherton, M. S. 2010, MNRAS, 408, 1598
- Nilsson et al. (2006) Nilsson, K. K., Fynbo, J. P. U., Møller, P., Sommer-Larsen, J., & Ledoux, C. 2006, A&A, 452, L23
- Nilsson & Møller (2009) Nilsson, K. K. & Møller, P. 2009, A&A, 508, L21
- Nilsson & Møller (2011) Nilsson, K. K. & Møller, P. 2011, A&A, 527, L7
- Ohyama et al. (2003) Ohyama, Y., Taniguchi, Y., Kawabata, K. S., et al. 2003, ApJ, 591, L9
- Palunas et al. (2004) Palunas, P., Teplitz, H. I., Francis, P. J., Williger, G. M., & Woodgate, B. E. 2004, ApJ, 602, 545
- Parkinson et al. (2008) Parkinson, H., Cole, S., & Helly, J. 2008, MNRAS, 383, 557
- Peterson et al. (2004) Peterson, B. M., Ferrarese, L., Gilbert, K. M., et al. 2004, ApJ, 613, 682
- Pettini et al. (1995) Pettini, M., Hunstead, R. W., King, D. L., & Smith, L. J. 1995, in QSO Absorption Lines, ed. G. Meylan, 55
- Prochaska et al. (2008a) Prochaska, J. X., Chen, H., Wolfe, A. M., Dessauges-Zavadsky, M., & Bloom, J. S. 2008a, ApJ, 672, 59
- Prochaska et al. (2008b) Prochaska, J. X., Hennawi, J. F., & Herbert-Fort, S. 2008b, ApJ, 675, 1002
- Rauch et al. (2001) Rauch, M., Sargent, W. L. W., & Barlow, T. A. 2001, ApJ, 554, 823
- Richards et al. (2002) Richards, G. T., Vanden Berk, D. E., Reichard, T. A., et al. 2002, AJ, 124, 1
- Silva & Viegas (2002) Silva, A. I. & Viegas, S. M. 2002, MNRAS, 329, 135
- Smette et al. (1995) Smette, A., Robertson, J. G., Shaver, P. A., et al. 1995, A&AS, 113, 199
- Smette et al. (1992) Smette, A., Surdej, J., Shaver, P. A., et al. 1992, ApJ, 389, 39
- Smith & Jarvis (2007) Smith, D. J. B. & Jarvis, M. J. 2007, MNRAS, 378, L49
- Spergel et al. (2003) Spergel, D. N., Verde, L., Peiris, H. V., et al. 2003, ApJS, 148, 175
- Steidel et al. (2000) Steidel, C. C., Adelberger, K. L., Shapley, A. E., et al. 2000, ApJ, 532, 170
- Taniguchi et al. (2001) Taniguchi, Y., Shioya, Y., & Kakazu, Y. 2001, ApJ, 562, L15
- Telfer et al. (2002) Telfer, R. C., Zheng, W., Kriss, G. A., & Davidsen, A. F. 2002, ApJ, 565, 773
- Tytler & Fan (1992) Tytler, D. & Fan, X. 1992, ApJS, 79, 1
- van Dokkum (2001) van Dokkum, P. G. 2001, PASP, 113, 1420
- Vanden Berk et al. (2001) Vanden Berk, D. E., Richards, G. T., Bauer, A., et al. 2001, AJ, 122, 549
- Verhamme et al. (2008) Verhamme, A., Schaerer, D., Atek, H., & Tapken, C. 2008, A&A, 491, 89
- Verhamme et al. (2006) Verhamme, A., Schaerer, D., & Maselli, A. 2006, A&A, 460, 397
- Vestergaard & Osmer (2009) Vestergaard, M. & Osmer, P. S. 2009, ApJ, 699, 800
- Vestergaard & Peterson (2006) Vestergaard, M. & Peterson, B. M. 2006, ApJ, 641, 689
- Villar-Martín et al. (2005) Villar-Martín, M., Tadhunter, C., Morganti, R., & Holt, J. 2005, MNRAS, 359, L5
- Vrtilek & Carleton (1985) Vrtilek, J. M. & Carleton, N. P. 1985, ApJ, 294, 106
- Warren et al. (2001) Warren, S. J., Møller, P., Fall, S. M., & Jakobsen, P. 2001, MNRAS, 326, 759
- Weidinger et al. (2004) Weidinger, M., Møller, P., & Fynbo, J. P. U. 2004, Nature, 430, 999
- Weidinger et al. (2005) Weidinger, M., Møller, P., Fynbo, J. P. U., & Thomsen, B. 2005, A&A, 436, 825
- Weymann et al. (1977) Weymann, R. J., Williams, R. E., Beaver, E. A., & Miller, J. S. 1977, ApJ, 213, 619
- Wilkes (1986) Wilkes, B. J. 1986, MNRAS, 218, 331
- Williams & Weymann (1976) Williams, R. E. & Weymann, R. J. 1976, ApJ, 207, L143