Now at: ]Pacific Northwest National Laboratory, Richland, WA 99352 Now at: ]Pacific Northwest National Laboratory, Richland, WA 99352 CLEO Collaboration –

Analysis of the Decay 𝑫𝟎𝑲𝑺𝟎𝝅𝟎𝝅𝟎bold-→superscript𝑫0subscriptsuperscript𝑲0𝑺superscript𝝅0superscript𝝅0D^{0}\rightarrow K^{0}_{S}\pi^{0}\pi^{0}

N. Lowrey    S. Mehrabyan    M. Selen    J. Wiss University of Illinois, Urbana-Champaign, Illinois 61801, USA    J. Libby Indian Institute of Technology Madras, Chennai, Tamil Nadu 600036, India    M. Kornicer    R. E. Mitchell    M. R. Shepherd    C. M. Tarbert Indiana University, Bloomington, Indiana 47405, USA    D. Besson University of Kansas, Lawrence, Kansas 66045, USA    T. K. Pedlar    J. Xavier Luther College, Decorah, Iowa 52101, USA    D. Cronin-Hennessy    J. Hietala    P. Zweber University of Minnesota, Minneapolis, Minnesota 55455, USA    S. Dobbs    Z. Metreveli    K. K. Seth    A. Tomaradze    T. Xiao Northwestern University, Evanston, Illinois 60208, USA    S. Brisbane    L. Martin    A. Powell    P. Spradlin    G. Wilkinson University of Oxford, Oxford OX1 3RH, UK    H. Mendez University of Puerto Rico, Mayaguez, Puerto Rico 00681    J. Y. Ge    D. H. Miller    I. P. J. Shipsey    B. Xin Purdue University, West Lafayette, Indiana 47907, USA    G. S. Adams    D. Hu    B. Moziak    J. Napolitano Rensselaer Polytechnic Institute, Troy, New York 12180, USA    K. M. Ecklund Rice University, Houston, Texas 77005, USA    J. Insler    H. Muramatsu    C. S. Park    L. J. Pearson    E. H. Thorndike    F. Yang University of Rochester, Rochester, New York 14627, USA    S. Ricciardi STFC Rutherford Appleton Laboratory, Chilton, Didcot, Oxfordshire, OX11 0QX, UK    C. Thomas University of Oxford, Oxford OX1 3RH, UK STFC Rutherford Appleton Laboratory, Chilton, Didcot, Oxfordshire, OX11 0QX, UK    M. Artuso    S. Blusk    R. Mountain    T. Skwarnicki    S. Stone    J. C. Wang    L. M. Zhang Syracuse University, Syracuse, New York 13244, USA    G. Bonvicini    D. Cinabro    A. Lincoln    M. J. Smith    P. Zhou    J. Zhu Wayne State University, Detroit, Michigan 48202, USA    P. Naik    J. Rademacker University of Bristol, Bristol BS8 1TL, UK    D. M. Asner [    K. W. Edwards    K. Randrianarivony    G. Tatishvili [ Carleton University, Ottawa, Ontario, Canada K1S 5B6    R. A. Briere    H. Vogel Carnegie Mellon University, Pittsburgh, Pennsylvania 15213, USA    P. U. E. Onyisi    J. L. Rosner University of Chicago, Chicago, Illinois 60637, USA    J. P. Alexander    D. G. Cassel    S. Das    R. Ehrlich    L. Fields    L. Gibbons    S. W. Gray    D. L. Hartill    B. K. Heltsley    D. L. Kreinick    V. E. Kuznetsov    J. R. Patterson    D. Peterson    D. Riley    A. Ryd    A. J. Sadoff    X. Shi    W. M. Sun Cornell University, Ithaca, New York 14853, USA    J. Yelton University of Florida, Gainesville, Florida 32611, USA    P. Rubin George Mason University, Fairfax, Virginia 22030, USA
(June 15, 2011)
Abstract

We present the results of a Dalitz plot analysis of D0KS0π0π0superscript𝐷0subscriptsuperscript𝐾0𝑆superscript𝜋0superscript𝜋0D^{0}\rightarrow K^{0}_{S}\pi^{0}\pi^{0} using the CLEO-c data set of 818 pb-1 of e+esuperscript𝑒superscript𝑒e^{+}e^{-} collisions accumulated at s=3.77GeV𝑠3.77GeV\sqrt{s}=3.77~{}\mathrm{GeV}. This corresponds to three million D0D¯0D^{0}\overline{D}{}^{0} pairs from which we select 1,259 tagged candidates with a background of 7.5±0.9plus-or-minus7.50.97.5\pm 0.9 percent. Several models have been explored, all of which include the Ksuperscript𝐾K^{*}(892), K2subscriptsuperscript𝐾2K^{*}_{2}(1430), Ksuperscript𝐾K^{*}(1680), the f0subscript𝑓0f_{0}(980), and the σ𝜎\sigma(500). We find that the combined π0π0superscript𝜋0superscript𝜋0\pi^{0}\pi^{0} S-wave contribution to our preferred fit is (28.9±6.3±3.1)plus-or-minus28.96.33.1(28.9\pm 6.3\pm 3.1)% of the total decay rate while D0K¯(892)0π0D^{0}\rightarrow\overline{K}{}^{*}(892)^{0}\pi^{0} contributes (65.6±5.3±2.5)%percentplus-or-minus65.65.32.5(65.6\pm 5.3\pm 2.5)\%. Using three tag modes and correcting for quantum correlations we measure the D0KS0π0π0superscript𝐷0subscriptsuperscript𝐾0𝑆superscript𝜋0superscript𝜋0D^{0}\rightarrow K^{0}_{S}\pi^{0}\pi^{0} branching fraction to be (1.059±0.038±0.061)%percentplus-or-minus1.0590.0380.061(1.059\pm 0.038\pm 0.061)\%.

pacs:
13.25.Ft, 13.25.-k, 14.40.-n, 14.40.Lb
preprint: CLNS 10/2069preprint: CLEO 10-06

I INTRODUCTION

The substructure of D0KS0π+πsuperscript𝐷0superscriptsubscript𝐾𝑆0superscript𝜋superscript𝜋D^{0}\rightarrow K_{S}^{0}\pi^{+}\pi^{-} has been the object of intense recent study due to its relevance to CKM physics cleoGamma , but there is currently relatively little information on the substructure of D0KS0π0π0superscript𝐷0superscriptsubscript𝐾𝑆0superscript𝜋0superscript𝜋0D^{0}\rightarrow K_{S}^{0}\pi^{0}\pi^{0}. A 1993 CLEO II publication based on 206 events found the branching fraction of the decay chain D0K¯(892)(KS0π0)π0D^{0}\rightarrow\overline{K}{}^{*}(892)(\rightarrow K_{S}^{0}\pi^{0})\pi^{0} to be (6.71.5+1.8)×103subscriptsuperscript6.71.81.5superscript103(6.7^{+1.8}_{-1.5})\times 10^{-3} and the branching fraction of the non-resonant contribution to be (4.5±1.1)×103plus-or-minus4.51.1superscript103(4.5\pm 1.1)\times 10^{-3} Procario . The total D0KS0π0π0superscript𝐷0superscriptsubscript𝐾𝑆0superscript𝜋0superscript𝜋0D^{0}\rightarrow K_{S}^{0}\pi^{0}\pi^{0} branching fraction has recently been measured by the CLEO collaboration to be (8.34±0.45±0.42)×103plus-or-minus8.340.450.42superscript103(8.34\pm 0.45\pm 0.42)\times 10^{-3} in an analysis that used 281pb1281superscriptpb1\mathrm{281~{}pb^{-1}} of data at s=3.77𝑠3.77\sqrt{s}=3.77 GeV cleoDD .

The pursuit of a more comprehensive study of the substructure of D0KS0π0π0superscript𝐷0superscriptsubscript𝐾𝑆0superscript𝜋0superscript𝜋0D^{0}\rightarrow K_{S}^{0}\pi^{0}\pi^{0} is motivated in part by the fact that this mode should provide a cleaner way to investigate the ππ𝜋𝜋\pi\pi S-wave substructure observed in D0KS0π+πsuperscript𝐷0superscriptsubscript𝐾𝑆0superscript𝜋superscript𝜋D^{0}\rightarrow K_{S}^{0}\pi^{+}\pi^{-} Muramatsu ; babar ; belle . Analyses performed by both BaBar and Belle use eight ππ𝜋𝜋\pi\pi resonances, four of which are spin-zero (including two distinct σ𝜎\sigma resonances), to fit the D0KS0π+πsuperscript𝐷0superscriptsubscript𝐾𝑆0superscript𝜋superscript𝜋D^{0}\rightarrow K_{S}^{0}\pi^{+}\pi^{-} Dalitz plot, but the ππ𝜋𝜋\pi\pi S-wave components in these analyses are masked by the very sizeable P-wave contributions of the ρ𝜌\rho resonance. By studying KS0π0π0superscriptsubscript𝐾𝑆0superscript𝜋0superscript𝜋0K_{S}^{0}\pi^{0}\pi^{0} we eliminate final states involving ρ𝜌\rho mesons and expect any S-wave structure present in the decay to be more prominent.

II EXPERIMENTAL TECHNIQUE
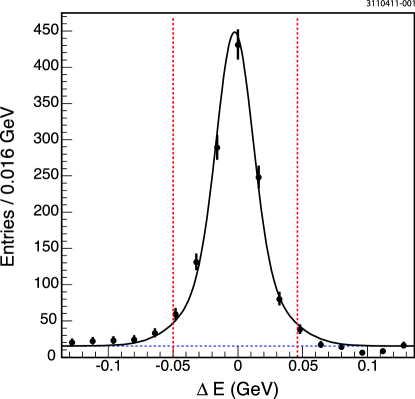
We have analyzed 818pb1818superscriptpb1\mathrm{818~{}pb^{-1}} of e+esuperscript𝑒superscript𝑒e^{+}e^{-} collisions produced with the Cornell Electron Storage Ring at the center-of-mass energy of the ψ(3770)𝜓3770\psi(3770) resonance, resulting in about three million D0D¯0D^{0}\overline{D}{}^{0} pairs produced in the CLEO-c detector. We consider candidates where the D0superscript𝐷0D^{0} is reconstructed as KS0π0π0superscriptsubscript𝐾𝑆0superscript𝜋0superscript𝜋0K_{S}^{0}\pi^{0}\pi^{0}, and the D¯0\overline{D}{}^{0} is reconstructed in the following four tag modes: D¯0K+π\overline{D}{}^{0}\rightarrow K^{+}\pi^{-}, D¯0K+ππ0\overline{D}{}^{0}\rightarrow K^{+}\pi^{-}\pi^{0}, D¯0K+ππ+π\overline{D}{}^{0}\rightarrow K^{+}\pi^{-}\pi^{+}\pi^{-}, and D¯0K+ππ+ππ0\overline{D}{}^{0}\rightarrow K^{+}\pi^{-}\pi^{+}\pi^{-}\pi^{0} (charge congugation is implied throughout this paper unless explicitly stated). Reconstructing any of these modes, whether it be signal or tag, involves placing requirements on the beam-constrained mass m(D)𝑚𝐷m(D) and the energy difference ΔEΔ𝐸\Delta E, defined as

m(D)𝑚𝐷\displaystyle m(D) =\displaystyle= Ebeam2/c4pD2/c2subscriptsuperscript𝐸2beamsuperscript𝑐4superscriptsubscript𝑝𝐷2superscript𝑐2\displaystyle\sqrt{E^{2}_{\mathrm{beam}}/c^{4}-p_{D}^{2}/c^{2}} (1)
ΔEΔ𝐸\displaystyle\Delta E =\displaystyle= EDEbeamsubscript𝐸𝐷subscript𝐸beam\displaystyle E_{D}-E_{\mathrm{beam}} (2)

where Ebeamsubscript𝐸beamE_{\mathrm{beam}} is one-half of the center-of-mass energy of the colliding beams, and EDsubscript𝐸𝐷E_{D} (pDsubscript𝑝𝐷p_{D}) is the total reconstructed energy (momentum) of the candidate. Both of these quantities rely on the fact that EDsubscript𝐸𝐷E_{D} would be the same as Ebeamsubscript𝐸beamE_{\mathrm{beam}} if the event were perfectly reconstructed, and are required to be within 2.5 (3.5) standard deviations of their nominal values for m(D)𝑚𝐷m(D) (ΔEΔ𝐸\Delta E). Figure 1 shows the ΔEΔ𝐸\Delta E distributions for tagged D0KS0π0π0superscript𝐷0superscriptsubscript𝐾𝑆0superscript𝜋0superscript𝜋0D^{0}\rightarrow K_{S}^{0}\pi^{0}\pi^{0} candidates that pass all other selection criteria.

Refer to caption
Figure 1: Signal-side ΔEΔ𝐸\Delta E distribution. The solid line shows the results of fitting with a double Gaussian to represent the signal plus a constant background (horizontal dashed line). The vertical dashed lines indicate the signal region.

We reconstruct neutral pions using photons with Eγ>30MeVsubscript𝐸𝛾30MeVE_{\gamma}>30~{}\mathrm{MeV} and mγγsubscript𝑚𝛾𝛾m_{\gamma\gamma} within 3 standard deviations (15 MeV/c2MeVsuperscript𝑐2\mathrm{MeV/}c^{2}) of the nominal π0superscript𝜋0\pi^{0} mass PDG . We reconstruct KS0π+πsuperscriptsubscript𝐾𝑆0superscript𝜋superscript𝜋K_{S}^{0}\rightarrow\pi^{+}\pi^{-} with mπ+πsubscript𝑚superscript𝜋superscript𝜋m_{\pi^{+}\pi^{-}} within 2.5 standard deviations (6 MeV/c2MeVsuperscript𝑐2\mathrm{MeV/}c^{2}) of the nominal KS0superscriptsubscript𝐾𝑆0K_{S}^{0} mass PDG and with the π+πsuperscript𝜋superscript𝜋\pi^{+}\pi^{-} vertex displaced from the interaction point by at least twice the error on their separation. When there are multiple D0KS0π0π0superscript𝐷0superscriptsubscript𝐾𝑆0superscript𝜋0superscript𝜋0D^{0}\rightarrow K_{S}^{0}\pi^{0}\pi^{0} candidates in a single event we select the one with the highest joint probability that both neutral pions are correctly identified.

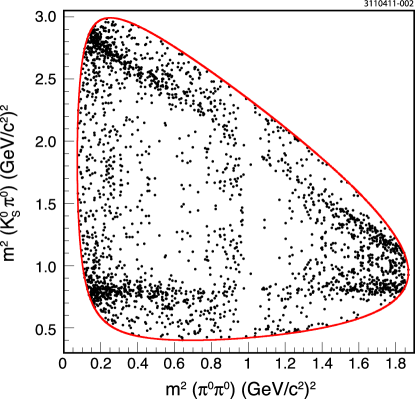
After all selection requirements are imposed on both signal and tag-side candidates we obtain a combined sample of 1,259 tagged D0KS0π0π0superscript𝐷0superscriptsubscript𝐾𝑆0superscript𝜋0superscript𝜋0D^{0}\rightarrow K_{S}^{0}\pi^{0}\pi^{0} events. A Dalitz plot of these candidates is shown in Fig. 2. Bose symmetry requires that the decay dynamics remain invariant when the two π0superscript𝜋0\pi^{0}’s are swapped, hence the Dalitz plot contains two entries per event, one for each possible KS0π0superscriptsubscript𝐾𝑆0superscript𝜋0K_{S}^{0}\pi^{0} combination. The horizontal band evident at around m2(KS0π0)=0.8GeV2/c4superscript𝑚2superscriptsubscript𝐾𝑆0superscript𝜋00.8superscriptGeV2superscript𝑐4m^{2}(K_{S}^{0}\pi^{0})=0.8~{}\mathrm{GeV^{2}/}c^{4} is due to D0K¯(892)π0D^{0}\rightarrow\overline{K}{}^{*}(892)\pi^{0} (K¯(892)KS0π0\overline{K}{}^{*}(892)\rightarrow K^{0}_{S}\pi^{0}), and the most striking vertical feature is an empty band at around m2(π0π0)=1GeV2/c4superscript𝑚2superscript𝜋0superscript𝜋01superscriptGeV2superscript𝑐4m^{2}(\pi^{0}\pi^{0})=1~{}\mathrm{GeV^{2}/}c^{4} where the KK¯𝐾¯𝐾K\overline{K} threshold opens, indicating the presence of destructive interference between the f0(980)subscript𝑓0980f_{0}(980) and some broad underlying ππ𝜋𝜋\pi\pi S-wave structure. A study of events both inside and outside the signal region indicated in Fig. 1 shows that (7.5±0.9)%percentplus-or-minus7.50.9(7.5\pm 0.9)\% of the events in this Dalitz plot are background.

Refer to caption
Figure 2: D0KS0π0π0superscript𝐷0superscriptsubscript𝐾𝑆0superscript𝜋0superscript𝜋0D^{0}\rightarrow K_{S}^{0}\pi^{0}\pi^{0} Dalitz plot showing two entries per candidate, one for each possible KS0π0superscriptsubscript𝐾𝑆0superscript𝜋0K_{S}^{0}\pi^{0} combination.

We determine the efficiency of our analysis as a function of Dalitz plot coordinate by using a GEANT-based Monte Carlo package to generate 1,000,000 simulated D0D¯0D^{0}\overline{D}{}^{0} pairs where one D𝐷D is forced to decay to a flavor-tagging mode in proportion to its branching fraction while the other D𝐷D decays to KS0π0π0superscriptsubscript𝐾𝑆0superscript𝜋0superscript𝜋0K_{S}^{0}\pi^{0}\pi^{0} uniformly across the Dalitz plot. We pass these events through the same analysis code and selection requirements as the data, and fit the Dalitz plot of the remaining 63,391 events to a cubic polynomial which has been explicitly symmetrized in the two m2(KS0π0)superscript𝑚2superscriptsubscript𝐾𝑆0superscript𝜋0m^{2}(K_{S}^{0}\pi^{0}) variables. We find that the efficiency is well modeled by this simple function and is uniform across the Dalitz plot.

To study backgrounds we use a Monte Carlo-generated sample of D0D¯0D^{0}\overline{D}{}^{0} events corresponding to twenty times the actual integrated luminosity in which the D𝐷D’s decay to all experimentally measured final states with appropriate branching fractions, removing all events that contain an actual D0KS0π0π0superscript𝐷0superscriptsubscript𝐾𝑆0superscript𝜋0superscript𝜋0D^{0}\rightarrow K_{S}^{0}\pi^{0}\pi^{0} decay and subjecting the remaining events to the same analysis requirements as the real data. The remaining background events vary smoothly across the Dalitz plot, preferring the corners of phase space where a π0superscript𝜋0\pi^{0} is produced at rest and is more easily faked. We find the background shape is well modeled by a symmetrized third-order polynomial combined with a small Breit-Wigner component to account for ω𝜔\omega decays from the background mode D0KS0ω(π0γ)superscript𝐷0annotatedsuperscriptsubscript𝐾𝑆0𝜔absentsuperscript𝜋0𝛾D^{0}\rightarrow K_{S}^{0}\omega(\rightarrow\pi^{0}\gamma) where the ω𝜔\omega decay combines with an unrelated calorimeter shower to yield a second π0superscript𝜋0\pi^{0} candidate.

III DALITZ PLOT ANALYSIS

The fitting method used to explore the efficiency and background shapes, as well as the structure of the D0KS0π0π0superscript𝐷0superscriptsubscript𝐾𝑆0superscript𝜋0superscript𝜋0D^{0}\rightarrow K_{S}^{0}\pi^{0}\pi^{0} signal, uses the same unbinned maximum likelihood technique described in Ref. Tim which minimizes the sum over N events:

=2n=1Nlog𝒫(xn,yn)2superscriptsubscript𝑛1𝑁𝒫subscript𝑥𝑛subscript𝑦𝑛\mathcal{L}=-2\sum_{n=1}^{N}\log{\cal P}(x_{n},y_{n}) (3)

where x𝑥x and y𝑦y are the two m2(KS0π0)superscript𝑚2superscriptsubscript𝐾𝑆0superscript𝜋0m^{2}(K_{S}^{0}\pi^{0}) Dalitz variables and 𝒫(x,y)𝒫𝑥𝑦{\cal P}(x,y) is the probability density function (p.d.f.) which depends on the event sample being fit:

𝒫(x,y)={𝒩εε(x,y)forefficiency;𝒩BB(x,y)forbackground;fsig𝒩S|(x,y)|2ε(x,y)+(1fsig)𝒩BB(x,y)forsignal.𝒫𝑥𝑦casessubscript𝒩𝜀𝜀𝑥𝑦forefficiencysubscript𝒩𝐵𝐵𝑥𝑦forbackgroundsubscript𝑓sigsubscript𝒩𝑆superscript𝑥𝑦2𝜀𝑥𝑦1subscript𝑓sigsubscript𝒩𝐵𝐵𝑥𝑦forsignal{\cal P}(x,y)=\left\{\begin{array}[]{ll}{\mathcal{N}}_{\varepsilon}\varepsilon(x,y)&{\rm for~{}efficiency;}\\ {\mathcal{N}}_{B}B(x,y)&{\rm for~{}background;}\\ f_{\rm{sig}}{\mathcal{N}}_{S}|{\mathcal{M}}(x,y)|^{2}\varepsilon(x,y)+(1-f_{\rm{sig}}){\mathcal{N}}_{B}B(x,y)&{\rm for~{}signal.}\end{array}\right. (4)

The signal p.d.f. is proportional to the matrix element squared, |(x,y)|2superscript𝑥𝑦2|{\mathcal{M}}(x,y)|^{2}, corrected by the measured efficiency ε(x,y)𝜀𝑥𝑦\varepsilon(x,y) and the signal fraction, fsig=(0.924±0.009)subscript𝑓sigplus-or-minus0.9240.009f_{\rm{sig}}=(0.924\pm 0.009), which is simply the complement of the background fraction discussed above, and is fixed in the fit. The efficiency, signal, and background contributions are normalized separately:

1𝒩ε1subscript𝒩𝜀\displaystyle{1\over{{\mathcal{N}}_{\varepsilon}}} =\displaystyle= ε(x,y)𝑑x𝑑y,𝜀𝑥𝑦differential-d𝑥differential-d𝑦\displaystyle\int\varepsilon(x,y)dxdy, (5)
1𝒩S1subscript𝒩𝑆\displaystyle{1\over{{\mathcal{N}}_{S}}} =\displaystyle= |(x,y)|2ε(x,y)𝑑x𝑑y,superscript𝑥𝑦2𝜀𝑥𝑦differential-d𝑥differential-d𝑦\displaystyle\int|{\mathcal{M}}(x,y)|^{2}\varepsilon(x,y)dxdy, (6)
1𝒩B1subscript𝒩𝐵\displaystyle{1\over{{\mathcal{N}}_{B}}} =\displaystyle= B(x,y)𝑑x𝑑y,𝐵𝑥𝑦differential-d𝑥differential-d𝑦\displaystyle\int B(x,y)dxdy, (7)

providing the overall normalization 𝒫(x,y)𝑑x𝑑y=1𝒫𝑥𝑦differential-d𝑥differential-d𝑦1\int{\cal P}(x,y)dxdy=1.

Several models for fitting the data have been explored, and three of these are described here. All include the K(892)superscript𝐾892K^{*}(892), K2(1430)superscriptsubscript𝐾21430K_{2}^{*}(1430), and K(1680)superscript𝐾1680K^{*}(1680) as intermediate KS0π0superscriptsubscript𝐾𝑆0superscript𝜋0K_{S}^{0}\pi^{0} resonances and an f2(1270)subscript𝑓21270f_{2}(1270) intermediate π0π0superscript𝜋0superscript𝜋0\pi^{0}\pi^{0} resonance. To model the S-wave contribution to π0π0superscript𝜋0superscript𝜋0\pi^{0}\pi^{0} we add an f0(980)subscript𝑓0980f_{0}(980), described with a Flatté parameterization flatte , to a ππ𝜋𝜋\pi\pi complex pole around the mass of the σ(500)𝜎500\sigma(500), and we include one of the following three variations: f0(1370)subscript𝑓01370f_{0}(1370) (Model 1), f0(1500)subscript𝑓01500f_{0}(1500) (Model 2), and both f0(1370)subscript𝑓01370f_{0}(1370) and f0(1500)subscript𝑓01500f_{0}(1500) (Model 3). Each includes a non-interfering KS0π0π0superscriptsubscript𝐾𝑆0superscript𝜋0superscript𝜋0K_{S}^{0}\rightarrow\pi^{0}\pi^{0} contribution to account for D0KS0KS0superscript𝐷0superscriptsubscript𝐾𝑆0superscriptsubscript𝐾𝑆0D^{0}\rightarrow K_{S}^{0}K_{S}^{0}. A fourth model, in which the broadest S-wave features were replaced by a simple non-resonant component, was rejected since the fit fraction of the non-resonant component exceeded 808080%. Table 1 summarizes the parameters used for the intermediate resonances and the functions used to represent them.

Table 1: Details of the resonances included in the Dalitz plot fit.
Resonance Model Mass (MeV/c2MeVsuperscript𝑐2\mathrm{MeV/}c^{2}) Width (MeV/c2MeVsuperscript𝑐2\mathrm{MeV/}c^{2})
ππ𝜋𝜋\pi\pi pole Complex Pole 470i220470𝑖220470-i220
K(892)superscript𝐾892K^{*}(892) Breit-Wigner 896 50.3
f0(980)subscript𝑓0980f_{0}(980) Flatté111gππ=406MeV/c2subscript𝑔𝜋𝜋406MeVsuperscript𝑐2g_{\pi\pi}=406~{}\mathrm{MeV/}c^{2}, gKK/gππ=2subscript𝑔𝐾𝐾subscript𝑔𝜋𝜋2g_{KK}/g_{\pi\pi}=2 965
f2(1270)subscript𝑓21270f_{2}(1270) Breit-Wigner 1275.1 185.0
f0(1370)subscript𝑓01370f_{0}(1370) Breit-Wigner 1350 265
K2(1430)superscriptsubscript𝐾21430K_{2}^{*}(1430) Breit-Wigner 1432.4 109
f0(1500)subscript𝑓01500f_{0}(1500) Breit-Wigner 1505 109
K(1680)superscript𝐾1680K^{*}(1680) Breit-Wigner 1717 322

Table 2 summarizes the Dalitz plot fit results for the three models described above. In all cases we choose the amplitude (phase) of the K(892)superscript𝐾892K^{*}(892) to be 1 (0) respectively, which effectively defines the complex coordinate system for the other resonances included in the fit. The χ2superscript𝜒2\chi^{2} values shown are calculated post-fit by dividing the Dalitz plot into discrete bins and comparing the data with the average p.d.f. in each bin. The fit fraction (FF) for each component is calculated by integrating its contribution across the Dalitz plot and dividing by the integral of the coherent sum of all components:

FFi=𝒟𝒫|ai|2𝒟𝒫|jajeiϕj|2,𝐹subscript𝐹𝑖subscript𝒟𝒫superscriptsubscript𝑎𝑖2subscript𝒟𝒫superscriptsubscript𝑗subscript𝑎𝑗superscript𝑒𝑖subscriptitalic-ϕ𝑗2FF_{i}={{\int_{\cal DP}|a_{i}|^{2}}\over{\int_{\cal DP}|\sum_{j}a_{j}e^{i\phi_{j}}|^{2}}}, (8)

where ajsubscript𝑎𝑗a_{j} (ϕjsubscriptitalic-ϕ𝑗\phi_{j}) are the amplitude (phase) of the j𝑗j-th component. The total fit fraction for a given model is the sum of the fit fractions for the individual components of that model, and a total fit fraction greater than unity indicates the presence of destructive interference on the Dalitz plot.

While the quality of the fit projections of the three models are comparable, we choose Model 1 as our preferred fit since it has both a reasonable χ2superscript𝜒2\chi^{2} (unlike Model 2) and a total fit fraction close to unity (unlike Model 3). Figures 4 and 4 show the projections of both data and p.d.f. for Model 1. In both figures the data are represented by the points with error bars, the total fit by the thick solid line, the background contribution by the thin solid line, the ππ𝜋𝜋\pi\pi S-wave contribution by the dashed line, and the K(892)superscript𝐾892K^{*}(892) contribution by the broken solid line.

Refer to caption
Figure 3: m2(Kπ)superscript𝑚2𝐾𝜋m^{2}(K\pi) projections for Model 1. The data are represented by the points with error bars and the total fit by the thick solid line. The other fit components are discussed in the text.
Refer to caption
Figure 4: m2(ππ)superscript𝑚2𝜋𝜋m^{2}(\pi\pi) projection for Model 1. The data are represented by the points with error bars and the total fit by the thick solid line. The other fit components are discussed in the text.
Table 2: Fit fraction (%), amplitude, and phase () fit results for Models 1 through 3. The errors are statistical only.
Model 1 Model 2 Model 3
χ2/Ndofsuperscript𝜒2subscript𝑁𝑑𝑜𝑓\chi^{2}/N_{dof} 19.9/719.9719.9/7 44.7/744.7744.7/7 14.9/514.9514.9/5
Total FF 122±plus-or-minus\pm 8 120±plus-or-minus\pm 11 252±plus-or-minus\pm 33
FF 2.7±plus-or-minus\pm 1.4 3.7±plus-or-minus\pm 1.8 4.5±plus-or-minus\pm 2.2
ππ𝜋𝜋\pi\pi pole a𝑎a 0.67±plus-or-minus\pm 0.16 0.91±plus-or-minus\pm 0.20 0.99±plus-or-minus\pm 0.23
ϕitalic-ϕ\phi 140±plus-or-minus\pm 17 119±plus-or-minus\pm 22 39±plus-or-minus\pm 17
FF 10.5±plus-or-minus\pm 2.1 12.1±plus-or-minus\pm 2.4 18.4±plus-or-minus\pm 4.3
f0(980)subscript𝑓0980f_{0}(980) a𝑎a 1.71±plus-or-minus\pm 0.17 2.13±plus-or-minus\pm 0.20 2.59±plus-or-minus\pm 0.24
ϕitalic-ϕ\phi 35.2±plus-or-minus\pm 9.9 65±plus-or-minus\pm 11 44.8±plus-or-minus\pm 7.9
FF 25.7±plus-or-minus\pm 5.1 (n/a) 81±plus-or-minus\pm 24
f0(1370)subscript𝑓01370f_{0}(1370) a𝑎a 5.72±plus-or-minus\pm 0.58 (n/a) 11.6±plus-or-minus\pm 1.5
ϕitalic-ϕ\phi 340.3±plus-or-minus\pm 6.6 (n/a) 15.8±plus-or-minus\pm 8.6
FF (n/a) 22.3±plus-or-minus\pm 6.0 73±plus-or-minus\pm 20
f0(1500)subscript𝑓01500f_{0}(1500) a𝑎a (n/a) 11.7±plus-or-minus\pm 1.5 20.9±plus-or-minus\pm 4.0
ϕitalic-ϕ\phi (n/a) 16±plus-or-minus\pm 12 281.4±plus-or-minus\pm 8.0
FF 2.48±plus-or-minus\pm 0.91 12.9±plus-or-minus\pm 3.3 6.8±plus-or-minus\pm 2.5
f2(1270)subscript𝑓21270f_{2}(1270) a𝑎a 1.57±plus-or-minus\pm 0.28 4.16±plus-or-minus\pm 0.54 2.98±plus-or-minus\pm 0.53
ϕitalic-ϕ\phi 282±plus-or-minus\pm 18 2.2±plus-or-minus\pm 6.5 340.9±plus-or-minus\pm 8.9
FF 65.6±plus-or-minus\pm 5.3 48.6±plus-or-minus\pm 5.9 50.2±plus-or-minus\pm 7.8
K(892)superscript𝐾892K^{*}(892) a𝑎a 1 (fixed) 1 (fixed) 1 (fixed)
ϕitalic-ϕ\phi 0 (fixed) 0 (fixed) 0 (fixed)
FF 0.49±plus-or-minus\pm 0.45 1.9±plus-or-minus\pm 1.2 1.45±plus-or-minus\pm 0.82
K2(1430)superscriptsubscript𝐾21430K_{2}^{*}(1430) a𝑎a 0.43±plus-or-minus\pm 0.18 0.98±plus-or-minus\pm 0.29 0.85±plus-or-minus\pm 0.24
ϕitalic-ϕ\phi 141±plus-or-minus\pm 28 191±plus-or-minus\pm 16 159±plus-or-minus\pm 15
FF 11.2±plus-or-minus\pm 2.7 15.2±plus-or-minus\pm 4.3 13.5±plus-or-minus\pm 3.5
K(1680)superscript𝐾1680K^{*}(1680) a𝑎a 5.65±plus-or-minus\pm 0.77 7.6±plus-or-minus\pm 1.2 7.07±plus-or-minus\pm 0.82
ϕitalic-ϕ\phi 55±plus-or-minus\pm 11 45±plus-or-minus\pm 12 18.7±plus-or-minus\pm 8.9
FF 3.46±plus-or-minus\pm 0.92 3.30±plus-or-minus\pm 0.96 2.48±plus-or-minus\pm 0.95
KS0superscriptsubscript𝐾𝑆0K_{S}^{0} a𝑎a 0.281±plus-or-minus\pm 0.037 0.318±plus-or-minus\pm 0.044 0.272±plus-or-minus\pm 0.050
ϕitalic-ϕ\phi contributes incoherently

The results in Table 2 show a large model dependence of the fit fractions and phases of both the f0(980)subscript𝑓0980f_{0}(980) and the ππ𝜋𝜋\pi\pi pole while the overall fit projections remain largely unchanged. We interpret this as an indication that, while the overall shape and phase evolution of the ππ𝜋𝜋\pi\pi S-wave component of our fits are reasonable, the details of the underlying physics model used to describe this S-wave component are not well determined. To test the hypothesis that the combined structure of the S-wave components is meaningful while the specific details of these models are not, we combine all of the individual spin-zero π0π0superscript𝜋0superscript𝜋0\pi^{0}\pi^{0} components into a single ππ𝜋𝜋\pi\pi “S-wave object” and calculate the fit fraction of this object as a whole:

FFSwave=𝒟𝒫|Swaveakeiϕk|2𝒟𝒫|allajeiϕj|2,𝐹subscript𝐹𝑆𝑤𝑎𝑣𝑒subscript𝒟𝒫superscriptsubscript𝑆𝑤𝑎𝑣𝑒subscript𝑎𝑘superscript𝑒𝑖subscriptitalic-ϕ𝑘2subscript𝒟𝒫superscriptsubscript𝑎𝑙𝑙subscript𝑎𝑗superscript𝑒𝑖subscriptitalic-ϕ𝑗2FF_{S-wave}={{\int_{\cal DP}|\sum_{S-wave}a_{k}e^{i\phi_{k}}|^{2}}\over{\int_{\cal DP}|\sum_{all}a_{j}e^{i\phi_{j}}|^{2}}}, (9)

The results summarized in Table 3 show that the ππ𝜋𝜋\pi\pi S-wave fit fraction is now consistent among models, as are the total fit fractions which are now near 100%.

Table 3: Dalitz plot fit fractions (%) with a coherent ππ𝜋𝜋\pi\pi S-wave object.
Model 1 Model 2 Model 3
ππ𝜋𝜋\pi\pi S-wave 28.9±plus-or-minus\pm 6.3 19.5±plus-or-minus\pm 5.7 30±plus-or-minus\pm 12
K(892)superscript𝐾892K^{*}(892) 65.6±plus-or-minus\pm 5.3 48.6±plus-or-minus\pm 5.9 50.2±plus-or-minus\pm 7.8
K2(1430)superscriptsubscript𝐾21430K_{2}^{*}(1430) 0.49±plus-or-minus\pm 0.45 1.9±plus-or-minus\pm 1.2 1.45±plus-or-minus\pm 0.82
K(1680)superscript𝐾1680K^{*}(1680) 11.2±plus-or-minus\pm 2.7 15.2±plus-or-minus\pm 4.3 13.5±plus-or-minus\pm 3.5
f2(1270)subscript𝑓21270f_{2}(1270) 2.48±plus-or-minus\pm 0.91 12.9±plus-or-minus\pm 3.3 6.8±plus-or-minus\pm 2.5
KS0superscriptsubscript𝐾𝑆0K_{S}^{0} 3.46±plus-or-minus\pm 0.92 3.30±plus-or-minus\pm 0.96 2.48±plus-or-minus\pm 0.95
Total 112.1±plus-or-minus\pm 8.8 101±plus-or-minus\pm 10 105±plus-or-minus\pm 15

The fact that the underlying physics is not well represented by a simple combination of resonances is not surprising given the results of other analysis efforts where “σ𝜎\sigma” like objects have turned out to be the result of dynamical effects that require a more sophisticated modeling approach focus . In spite of this shortcoming, our simple model does capture the striking overall feature that there is significant destructive interference at m2(π0π0)superscript𝑚2superscript𝜋0superscript𝜋0m^{2}(\pi^{0}\pi^{0}) around 1 GeV2/c4superscriptGeV2superscript𝑐4\mathrm{GeV^{2}/}c^{4}, and that the overall π0π0superscript𝜋0superscript𝜋0\pi^{0}\pi^{0} S-wave component accounts for about a quarter of all D0KS0π0π0superscript𝐷0superscriptsubscript𝐾𝑆0superscript𝜋0superscript𝜋0D^{0}\rightarrow K_{S}^{0}\pi^{0}\pi^{0} decays. These results are consistent with the studies of D0KS0π+πsuperscript𝐷0superscriptsubscript𝐾𝑆0superscript𝜋superscript𝜋D^{0}\rightarrow K_{S}^{0}\pi^{+}\pi^{-} from BaBar and Belle in which the total ππ𝜋𝜋\pi\pi S-wave plus non-resonant fit fractions were found to be 27.227.227.2% and 26.126.126.1% respectively babar ; belle .

To test the stability of our results as selection requirements are varied, we tightened (loosened) these requirements by half a standard deviation resulting in 1,099 (1,361) candidates in the Dalitz plot. In each case the signal fraction fsigsubscript𝑓sigf_{\rm{sig}}, efficiency shape ε(x,y)𝜀𝑥𝑦\varepsilon(x,y), and background shape B(x,y)𝐵𝑥𝑦B(x,y) were remeasured and fixed in the fit to the Dalitz plot, which used Model 1 as described above. Sensitivity to uncertainties in identifying and reconstructing π0superscript𝜋0\pi^{0}s was studied by tightening the nominal pull mass requirement to ±2.5plus-or-minus2.5\pm 2.5 standard deviations, resulting in 1,150 events in the Dalitz plot, and by eliminating all π0superscript𝜋0\pi^{0}s having one or more photons in the endcap calorimeter (cosθ>0.81𝜃0.81\cos\theta>0.81), resulting in 1,023 events in the Dalitz plot. In the same way, sensitivity to the signal fraction was studied by varying fsigsubscript𝑓sigf_{\rm{sig}} by ±3plus-or-minus3\pm 3 standard deviations from its nominal value; sensitivity to the shape of the efficiency function was studied by replacing the fitted efficiency shape parameters with those corresponding to a uniform efficiency ε(x,y)=1𝜀𝑥𝑦1\varepsilon(x,y)=1; and sensitivity to uncertainty in the shape of the background was studied by replacing the nominal background shape, determined using Monte Carlo-generated data, with a background shape determined by analyzing single tagged D0KS0π0π0superscript𝐷0superscriptsubscript𝐾𝑆0superscript𝜋0superscript𝜋0D^{0}\rightarrow K_{S}^{0}\pi^{0}\pi^{0} data selected from a sideband region in the ΔEΔ𝐸\Delta E vs. m(D)𝑚𝐷m(D) plane.

In all cases described above, the parameters derived from fitting the resulting Dalitz plot with Model 1 were within 1 standard deviation of the parameters found in the preferred fit. For each parameter we choose the maximum variation from the preferred fit value to represent the systematic uncertainty in that parameter. The resulting systematic errors for the fit fractions from Dalitz plot Model 1 are given in 4.

Table 4: Dalitz plot fit results for Model 1. The first error is statistical and the second represents variations on analysis requirements.
Component Fit Fraction (%)
ππ𝜋𝜋\pi\pi S-wave 28.9±plus-or-minus~{}\pm~{} 6. 3 ±plus-or-minus~{}\pm~{} 3. 1
K(892)superscript𝐾892K^{*}(892) 65.6±plus-or-minus~{}\pm~{} 5. 3 ±plus-or-minus~{}\pm~{} 2. 5
K2(1430)superscriptsubscript𝐾21430K_{2}^{*}(1430) 0.49±plus-or-minus~{}\pm~{} 0. 45 ±plus-or-minus~{}\pm~{} 0. 23
K(1680)superscript𝐾1680K^{*}(1680) 11.2±plus-or-minus~{}\pm~{} 2. 7 ±plus-or-minus~{}\pm~{} 2. 5
f2(1270)subscript𝑓21270f_{2}(1270) 2.48±plus-or-minus~{}\pm~{} 0. 91 ±plus-or-minus~{}\pm~{} 0. 78
KS0superscriptsubscript𝐾𝑆0K_{S}^{0} 3.46±plus-or-minus~{}\pm~{} 0. 92 ±plus-or-minus~{}\pm~{} 0. 66

IV BRANCHING FRACTION ANALYSIS

The extraction of the D0KS0π0π0superscript𝐷0superscriptsubscript𝐾𝑆0superscript𝜋0superscript𝜋0D^{0}\rightarrow K_{S}^{0}\pi^{0}\pi^{0} branching fraction is a straightforward extension of the Dalitz analysis described above; we need only to quantify the yields and efficiencies for observing the signal D0KS0π0π0superscript𝐷0superscriptsubscript𝐾𝑆0superscript𝜋0superscript𝜋0D^{0}\rightarrow K_{S}^{0}\pi^{0}\pi^{0} events as a function of the tag mode. More specifically, to extract the D0KS0π0π0superscript𝐷0superscriptsubscript𝐾𝑆0superscript𝜋0superscript𝜋0D^{0}\rightarrow K_{S}^{0}\pi^{0}\pi^{0} branching fraction using double-tagged events where one D𝐷D decays to KS0π0π0superscriptsubscript𝐾𝑆0superscript𝜋0superscript𝜋0K_{S}^{0}\pi^{0}\pi^{0} and the other D𝐷D decays to tag mode τ𝜏\tau, we need to evaluate

(D0KS0π0π0)τ=NDTτ/(εDTτατ)2ND0D¯0τ,\mathcal{B}(D^{0}\rightarrow K_{S}^{0}\pi^{0}\pi^{0})_{\tau}=\frac{N^{\tau}_{DT}/(\varepsilon^{\tau}_{DT}\alpha_{\tau})}{2N_{D^{0}\overline{D}{}^{0}}\mathcal{B}_{\tau}}, (10)

where εDTτsubscriptsuperscript𝜀𝜏𝐷𝑇\varepsilon^{\tau}_{DT} is the efficiency for the detector and analysis to select an event where the D0superscript𝐷0D^{0} decays to KS0π0π0superscriptsubscript𝐾𝑆0superscript𝜋0superscript𝜋0K_{S}^{0}\pi^{0}\pi^{0} and the D¯0\overline{D}{}^{0} decays to tag mode τ𝜏\tau, NDTτsubscriptsuperscript𝑁𝜏𝐷𝑇N^{\tau}_{DT} is the measured yield of these events, ND0D¯0N_{D^{0}\overline{D}{}^{0}} is the number of D0D¯0D^{0}\overline{D}{}^{0} pairs produced, τsubscript𝜏\mathcal{B}_{\tau} is the branching fraction of the tag mode, ατsubscript𝛼𝜏\alpha_{\tau} is a small correction to account for the quantum correlation between the two sides of the event, and the factor of 2 accounts for the fact that we include charge-conjugate decays.

The yield of D0KS0π0π0superscript𝐷0superscriptsubscript𝐾𝑆0superscript𝜋0superscript𝜋0D^{0}\rightarrow K_{S}^{0}\pi^{0}\pi^{0} signal events for each tag mode, NDTτsubscriptsuperscript𝑁𝜏𝐷𝑇N^{\tau}_{DT}, is determined by fitting the ΔEΔ𝐸\Delta E distribution for the tagged events to a double Gaussian signal plus a flat background as illustrated in Fig. 1. The yields for all tag modes are summarized in Table 5.

The efficiency for detecting a D0superscript𝐷0D^{0} decaying to KS0π0π0superscriptsubscript𝐾𝑆0superscript𝜋0superscript𝜋0K_{S}^{0}\pi^{0}\pi^{0} when the D¯0\overline{D}{}^{0} decayed to tag mode τ𝜏\tau was determined by generating a large sample of simulated D0D¯0D^{0}\overline{D}{}^{0} events for each case and measuring the fraction of these events that pass the event selection requirements. The numbers are summarized in Table 5, and include an additional factor of επ0corr=0.94±0.02subscriptsuperscript𝜀𝑐𝑜𝑟𝑟superscript𝜋0plus-or-minus0.940.02\varepsilon^{corr}_{\pi^{0}}=0.94\pm 0.02 for each π0superscript𝜋0\pi^{0} to correct for a known systematic difference between data and Monte Carlo.

The factor 2ND0D¯0τ2N_{D^{0}\overline{D}{}^{0}}\mathcal{B}_{\tau} in the denominator of Eq. 10 is number of the D𝐷D’s that decayed to tag mode τ𝜏\tau in the CLEO-c detector. This is determined from the efficiency-corrected single-tag yields obtained by a recently published CLEO-c analysis that used the same data sample and tag modes to study semileptonic charm decays tag_yields . The numbers are summarized in Table 5.

The correction factor ατsubscript𝛼𝜏\alpha_{\tau} is needed because the signal-side D𝐷D decays to a CP𝐶𝑃CP-even eigenstate and the tag-side D𝐷D decays to a flavor eigenstate of mixed CP𝐶𝑃CP, allowing interference between favored and suppressed decay paths to modify the observed decay rate at the five percent level. The formalism is discussed in Refs. cleoDD and qcTwo where ατsubscript𝛼𝜏\alpha_{\tau} is defined as

ατ=1+2rcosδτ+RWSτ+y1+RWSτ+ΔQCτsubscript𝛼𝜏12𝑟subscript𝛿𝜏superscriptsubscript𝑅𝑊𝑆𝜏𝑦1superscriptsubscript𝑅𝑊𝑆𝜏superscriptsubscriptΔ𝑄𝐶𝜏\alpha_{\tau}=1+2r\cos\delta_{\tau}+R_{WS}^{\tau}+y\equiv 1+R_{WS}^{\tau}+\Delta_{QC}^{\tau} (11)

and δτsubscript𝛿𝜏\delta_{\tau} is the strong phase difference between the amplitudes of D0superscript𝐷0D^{0} and D¯0\overline{D}{}^{0} decaying to tag mode τ𝜏\tau, RWSτsuperscriptsubscript𝑅𝑊𝑆𝜏R_{WS}^{\tau} is the relative rate of D¯0\overline{D}{}^{0} and D0superscript𝐷0D^{0} decaying to tag mode τ𝜏\tau, and y𝑦y is the standard D0D¯0D^{0}\overline{D}{}^{0} mixing parameter while the values of RWSτsuperscriptsubscript𝑅𝑊𝑆𝜏R_{WS}^{\tau} and ΔQCτsuperscriptsubscriptΔ𝑄𝐶𝜏\Delta_{QC}^{\tau} for the D0K+πsuperscript𝐷0superscript𝐾superscript𝜋D^{0}\rightarrow K^{+}\pi^{-} tag mode are obtained from the Particle Data Group PDG , and the values for the D0K+ππ0superscript𝐷0superscript𝐾superscript𝜋superscript𝜋0D^{0}\rightarrow K^{+}\pi^{-}\pi^{0} and D0K+ππ+πsuperscript𝐷0superscript𝐾superscript𝜋superscript𝜋superscript𝜋D^{0}\rightarrow K^{+}\pi^{-}\pi^{+}\pi^{-} tag modes are obtained from Ref. qcTwo . Since RWSτsuperscriptsubscript𝑅𝑊𝑆𝜏R_{WS}^{\tau} and ΔQCτsuperscriptsubscriptΔ𝑄𝐶𝜏\Delta_{QC}^{\tau} are not known for D0K+ππ+ππ0superscript𝐷0superscript𝐾superscript𝜋superscript𝜋superscript𝜋superscript𝜋0D^{0}\rightarrow K^{+}\pi^{-}\pi^{+}\pi^{-}\pi^{0}, this tag mode is not used to extract the D0KS0π0π0superscript𝐷0superscriptsubscript𝐾𝑆0superscript𝜋0superscript𝜋0D^{0}\rightarrow K_{S}^{0}\pi^{0}\pi^{0} branching fraction. The overall correction factor ατsubscript𝛼𝜏\alpha_{\tau} for each tag mode is reported in Table 5. We calculate the D0KS0π0π0superscript𝐷0superscriptsubscript𝐾𝑆0superscript𝜋0superscript𝜋0D^{0}\rightarrow K_{S}^{0}\pi^{0}\pi^{0} branching fraction for each tag mode and show the results in Table 6.

To study the systematic uncertainty associated with these measurements we varied the way both the signal and background are parameterized when extracting signal yields, in all cases performing the same procedure on both data and Monte Carlo. Other analysis variations were also explored, including the tightening and loosening of reconstruction requirements as described in the previous section. These variations were combined in quadrature with the uncertainties in α𝛼\alpha, επ0corrsuperscriptsubscript𝜀superscript𝜋0𝑐𝑜𝑟𝑟\varepsilon_{\pi^{0}}^{corr}, NST/εSTsubscript𝑁𝑆𝑇subscript𝜀𝑆𝑇N_{ST}/\varepsilon_{ST}, tracking, KS0superscriptsubscript𝐾𝑆0K_{S}^{0} efficiency, and the statistical uncertainty in measuring εDTsubscript𝜀𝐷𝑇\varepsilon_{DT}, to give the total systematic uncertainty for each tag mode. Table 6 lists the results from our branching ratio calculations and gives our final result by performing a weighted average across the three modes.

Table 5: The yields, efficiency, and quantum correction for each tag mode.
Tag Mode NDTτsubscriptsuperscript𝑁𝜏𝐷𝑇N^{\tau}_{DT} εDTτsubscriptsuperscript𝜀𝜏𝐷𝑇\varepsilon^{\tau}_{DT} (%) 2ND0D¯0τ2N_{D^{0}\overline{D}{}^{0}}\mathcal{B}_{\tau} ατsubscript𝛼𝜏\alpha_{\tau}
K+πsuperscript𝐾superscript𝜋K^{+}\pi^{-} 247±plus-or-minus\pm 17 9.29±plus-or-minus\pm 0.41 229050±plus-or-minus\pm 600 1.130±plus-or-minus\pm 0.041
K+ππ0superscript𝐾superscript𝜋superscript𝜋0K^{+}\pi^{-}\pi^{0} 500±plus-or-minus\pm 25 5.30±plus-or-minus\pm 0.26 809700±plus-or-minus\pm 1700 1.099±plus-or-minus\pm 0.027
K+ππ+πsuperscript𝐾superscript𝜋superscript𝜋superscript𝜋K^{+}\pi^{-}\pi^{+}\pi^{-} 358±plus-or-minus\pm 28 6.04±plus-or-minus\pm 0.30 449500±plus-or-minus\pm 1100 1.080±plus-or-minus\pm 0.028
Table 6: Summary of (D0KS0π0π0)superscript𝐷0superscriptsubscript𝐾𝑆0superscript𝜋0superscript𝜋0\mathcal{B}(D^{0}\rightarrow K_{S}^{0}\pi^{0}\pi^{0}) measurements.
Tag Mode (D0KS0π0π0)superscript𝐷0superscriptsubscript𝐾𝑆0superscript𝜋0superscript𝜋0\mathcal{B}(D^{0}\rightarrow K_{S}^{0}\pi^{0}\pi^{0}) (%)
K+π0superscript𝐾superscript𝜋0K^{+}\pi^{0} 1.030±0.069±0.094plus-or-minus1.0300.0690.0941.030\pm 0.069\pm 0.094
K+ππ0superscript𝐾superscript𝜋superscript𝜋0K^{+}\pi^{-}\pi^{0} 1.061±0.054±0.110plus-or-minus1.0610.0540.1101.061\pm 0.054\pm 0.110
K+ππ+πsuperscript𝐾superscript𝜋superscript𝜋superscript𝜋K^{+}\pi^{-}\pi^{+}\pi^{-} 1.099±0.084±0.115plus-or-minus1.0990.0840.1151.099\pm 0.084\pm 0.115
Average 1.059±0.038±0.061plus-or-minus1.0590.0380.0611.059\pm 0.038\pm 0.061

V CONCLUSION

We have performed a Dalitz plot analysis of the decay mode D0KS0π0π0superscript𝐷0superscriptsubscript𝐾𝑆0superscript𝜋0superscript𝜋0D^{0}\rightarrow K_{S}^{0}\pi^{0}\pi^{0} using the full CLEO-c data set and have measured the total branching fraction of this mode to be (1.059±0.038±0.061)%percentplus-or-minus1.0590.0380.061(1.059\pm 0.038\pm 0.061)\%. We find that the combined π0π0superscript𝜋0superscript𝜋0\pi^{0}\pi^{0} S-wave contribution to our preferred fit is (28.9±6.3±3.1)plus-or-minus28.96.33.1(28.9\pm 6.3\pm 3.1)% of the total decay rate while D0K¯(892)0π0D^{0}\rightarrow\overline{K}{}^{*}(892)^{0}\pi^{0} contributes (65.6±5.3±2.5)%percentplus-or-minus65.65.32.5(65.6\pm 5.3\pm 2.5)\%.

Acknowledgements.
We gratefully acknowledge the effort of the CESR staff in providing us with excellent luminosity and running conditions. D. Cronin-Hennessy thanks the A.P. Sloan Foundation. This work was supported by the National Science Foundation, the U.S. Department of Energy, the Natural Sciences and Engineering Research Council of Canada, and the U.K. Science and Technology Facilities Council.

References

  • (1) See, for example, R. Briere et al. (CLEO Collaboration), Phys. Rev. D 80, 032002 (2009), and J. Libby et al. (CLEO Collaboration), Phys. Rev. D 82, 112006 (2010).
  • (2) M. Procario et al. (CLEO Collaboration), Phys. Rev. D 48, 4007 (1993).
  • (3) D. Asner et al. (CLEO Collaboration), Phys. Rev. D 78, 012001 (2008).
  • (4) H. Muramatsu et al. (CLEO Collaboration), Phys.Rev.Lett. 89, 251802 (2002) and Erratum 90, 059901 (2003)
  • (5) B. Aubert et al. (Babar Collaboration), Phys. Rev. Lett. 95, 121802 (2005).
  • (6) A. Poluektov et al. (Belle Collaboration), Phys. Rev. D 73, 112009 (2006).
  • (7) C. Amsler et al., Phys. Lett. B 667, 1 (2008) and 2009 partial update for the 2010 edition.
  • (8) S. Kopp et al. (CLEO Collaboration), Phys. Rev. D 63, 092001 (2001).
  • (9) S.M. Flatté, Phys. Lett. B 63, 224 (1976).
  • (10) G.  Bonvicini et al. (CLEO Collaboration), Phys. Rev. D 76, 012001 (2007).
  • (11) A. Link et al. (FOCUS Collaboration), Phys. Lett. B 653, 1 (2007).
  • (12) D. Besson et al. (CLEO Collaboration), Phys. Rev. D 80, 032005 (2009).
  • (13) N. Lowrey et al. (CLEO Collaboration), Phys. Rev. D 80, 031105(R) (2009).