Phase diagram of Rydberg atoms with repulsive van der Waals interaction
Abstract
We report a quantum Monte Carlo calculation of the phase diagram of bosons interacting with a repulsive inverse sixth power pair potential, a model for assemblies of Rydberg atoms in the local van der Waals blockade regime. The model can be parametrized in terms of just two parameters, the reduced density and temperature. Solidification happens to the fcc phase. At zero temperature the transition density is found with the diffusion Monte Carlo method at density , where is the strength of the interaction. The solidification curve at non-zero temperature is studied with the path integral Monte Carlo approach and is compared with transitions in corresponding harmonic and classical crystals. Relaxation mechanisms are considered in relation to present experiments.
pacs:
32.80.Ee, 64.70.-p, 67.85.-dI Introduction
Rydberg atoms have one electron excited to a high energy level. Such atoms exhibit strong and highly tunable interactions which may have an extraordinarily long range. Optically excited from suspended clouds of cold atoms, Rydberg atoms interact both between themselves and with the surrounding unexcited atoms, resulting in a rich behavior of the Rydberg systems.
Due to the strong interactions, a Rydberg atom shifts the levels of nearby atoms sufficiently to prevent their subsequent excitation. A large number of studies deal with a local blockade regime. In such a regime a Rydberg atom blocks excitations in its vicinity, and the atomic clouds may be injected with well over Rydberg excitations before the existing excitations block any further ones Heidemann et al. (2007); Tong et al. (2004); Singer et al. (2004). Unfortunately, the arrangement of the excited atoms in such experiments is not directly accessible and has been a subject of intense investigation. Understanding the ordering of Rydberg atoms may be important for interpretation of the experimental results, for example for the antiblockade effect predicted in Ates et al. (2007). It was also suggested that a spatially ordered state may allow for a better control over quantum states in such experiments Pohl et al. (2010). Finally, there is an exciting possibility of observing phase transitions in these versatile systems, especially to states with long-range ordering Weimer et al. (2008); Löw et al. (2009).
Quantum many-body treatments attempting modeling of realistic Rydberg systems have been developed in the past Tong et al. (2004); Robicheaux and Hernández (2005); Ates et al. (2007); Stanojevic and Côté (2010); Pohl et al. (2010); Younge et al. (2009), and were successful in reproducing a number of important experimental features Tong et al. (2004); Younge et al. (2009); Löw et al. (2009); Amthor et al. (2010); Schempp et al. (2010). Due to complexity, it is often difficult to consider long-range order with such calculations. Nonetheless, strong short-range spatial correlations between Rydberg atoms were obtained in the calculations of Refs. Robicheaux and Hernández (2005); Amthor et al. (2010); Stanojevic and Côté (2010), as the atoms avoid each other due to the blockade. Successful observation of the antiblockade effect was also a demonstration of a creation of the strong short-range correlations Amthor et al. (2010). Possibility of long-range ordering (crystallization) of Rydberg atoms was recently predicted for systems coupled to specially selected chirped laser pulses Pohl et al. (2010); van Bijnen et al. (2011). Ordering was also considered, and crystalline phase found, in theoretical calculations of both one and two-dimensional optical lattices Schachenmayer et al. (2010); Weimer and Büchler (2010); Ji et al. (2011); Sela et al. (2011). Remarkable non-commensurate crystalline phases in optical lattices emerged in Ref. Weimer and Büchler (2010).
Given the complex nature of the interactions in the Rydberg systems, it is important to know how much of the behavior of large assemblies of Rydberg atoms stems directly from the pair potential of the interaction between the atoms. For this reason we aim to study ordering in the simplest model of the Rydberg systems. Because of the large number of Rydberg-excited atoms in the experiments, we consider the thermodynamic limit. While the results are established in the thermodynamic equilibrium, many present experiments with Rydberg atoms are too short to reach equilibrium. Thus comparison in such cases must be made cautiously.
II Model and methods
The dominant interactions in the Rydberg systems are usually the Förster-resonant dipole-dipole interactions between the excited atoms. It was shown by Walker and Saffman Walker and Saffman (2005, 2008) that, given a pair of Rydberg atoms in the same state, the interaction will not have zeros as a result of the hyperfine structure or alignment of the atoms only if the resonant coupling is from the to states. Furthermore, interactions in the channels depend only weakly on the hyperfine structure of the states, resulting in a nearly isotropic interaction, to within . This perhaps in part motivates the use of the Rydberg states in current experiments Heidemann et al. (2007, 2008); Löw et al. (2009); Schempp et al. (2010). Neglecting the hyperfine structure, the interaction for this resonance is isotropic and its matrix element is given in terms of the Förster defect as Walker and Saffman (2005)
which changes from to van der Waals’ (with ) for distances much larger than the crossover . In the case of a strong local blockade, the blockade radius is often larger than the crossover distance. In such a case, the excited atoms are more likely to be found at distances where the interaction is already of the van der Waals type.
The above arguments motivate the repulsive van der Waals model for the Rydberg atoms in the local blockade regime. We disregard any energy transfer or interactions with the underlying gas of the ground-state atoms, and particles are treated as spinless bosons in three-dimensional space with the many-body Hamiltonian
Defining the reduced units of length and energy as
| (1) |
allows us to describe the properties of this model universally in terms of just two parameters, the dimensionless density and temperature . The units are selected to satisfy . The mass in Eq. (1) is the mass of the atom.
It is important to establish the applicability of the bulk phase diagram to finite systems. For a cloud of size and number density , the tail potential energy per particle can be estimated as . In order for the phase transition to occur at the same parameters in the limited system as in a bulk one, it is sufficient that the missing potential energy is much smaller than the kinetic energy. In the case , this reduces to . When , kinetic energy is estimated as and thus .
III Results for the phase diagram of the repulsive van der Waals gas
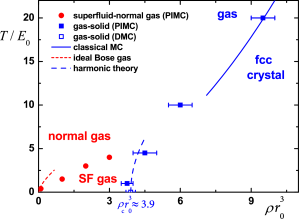
The phase diagram of the model includes a solid at high densities and, at lower densities, a gas phase that Bose-condenses at sufficiently low temperatures. To locate these phase regions, we employed a number of methods, each suitable in a certain area of the phase diagram. At zero temperature, the model was treated with diffusion Monte Carlo (DMC), a projector method which provides an exact ground-state energy for bosonic systems. DMC has been used successfully in the past to calculate the equations of state and locate quantum phase transitions for a variety of systems. Transitions at non-zero temperature were studied with path integral Monte Carlo (PIMC), a first principles method which allows one to compute the averages of quantum operators by summing over the quantum partition function of the system. Both DMC and PIMC methods allow one to treat systems with several hundred particles under periodic boundary conditions, with thermodynamic limits obtained by a suitable extrapolation. Additionally, classical limits were established with classical Monte Carlo calculations. In two regimes the location of phase transitions could be expressed in a semi-analytical form. In the first case, the transition between superfluid and normal gas was expressed in terms of the scattering length of the potential by means of a known relationship. In the second, the solid-to-gas transition was located at low temperatures with the harmonic theory. The results are summarized in the phase diagram shown in Fig. 1.
At sufficiently high density, the atoms are expected to form a crystalline solid. Summing the potential energy of the perfect lattice structures, we conclude that the preferred symmetry is fcc. While other structures may be excluded on the energetic grounds, the energy of the hcp structure is very close to that of the fcc. The difference between the perfect crystal energies, , is small enough to be comparable to or even swamped by the temperature effects in present experiments (for example, in Refs. Tong et al. (2004); Heidemann et al. (2008); Schempp et al. (2010)). The hcp phase is anticipated to be metastable with respect to the transition to the fcc phase. Zero-point motion and temperature effects are expected to keep the fcc symmetry preferred to hcp. In the following, the solid phase is always implied to have the fcc structure.
Investigation on the zero-temperature line was done with the DMC method Hammond et al. (1994); Boronat and Casulleras (1994). For importance sampling in the gas phase we used a Jastrow form , , for a periodic box of size . The second power in arises from the cusp condition of the scattering problem with the repulsive potential and is also compatible with the presence of long-wavelength phonons Reatto and Chester (1967). The parameter was variationally optimized beforehand. The Nosanow–Jastrow wave function was used for importance sampling in the solid phase Nosanow (1964); Cazorla and Boronat (2008). It consists of the product of the above Jastrow term and a site-localizing Nosanow term , where and denote correspondingly the coordinates of the atoms and lattice sites, and is the second optimized parameter. The breaking of exchange symmetry between particles in the solid affects the energy only negligibly Cazorla et al. (2009). Within the statistical errors of the DMC, results for the energies of the fcc and hcp lattices are indistinguishable and both are lower than the energies derived using bcc configuration.
While the phase transitions are conventionally reported as a function of pressure rather than density, density of the Rydberg atoms is more accessible and controllable experimentally. We therefore choose to express the transition locations in terms of density, even for the first-order solidification transition (in this case one needs to specify the coexistence region). We find that the equations of state for the fcc solid and gas phases cross at the transition density
| (2) |
expressed in the reduced units with the help of Eq. (1). The coexistence region of the solid and gas phase at zero temperature, determined using the double-tangent Maxwell construction, is narrow and is in fact smaller than the above error for the transition density (which arises mostly from the extrapolation to the thermodynamic limit; calculations were performed with up to 256 particles).
The transition line between solid and gas phases at small temperatures can be determined with the harmonic theory Ashcroft and Mermin (1976), assuming the Lindemann ratio remains unchanged on the transition line. The value of the Lindemann parameter at melting may be extracted from the DMC calculations of the transition density at zero temperature. The resulting low-temperature dependence of the gas-to-solid transition density is given by
| (3) |
where is the transition density at zero temperature, Eq. (2), and the constant is determined numerically from the dispersion curves of the solid and depends on the interactions and geometry of the fcc lattice.
A quantum solid melts at lower temperatures than the classical one due to the zero-point motion of the atoms. The classical transition was located in the canonical ensemble by Metropolis sampling of the Boltzmann factor. As the potential energy is exactly proportional to the square of the density, the transition temperature for the classical system also scales exactly as . We find that
| (4) |
As expected, such scaling removes the Planck constant from the classical transition temperature, which in fact simplifies to .
To fully account for quantum effects, the gas-to-solid transition at was also located with PIMC calculations. We used decomposition of the action operator that is accurate beyond the fourth order Chin (2004). For details of the method and implementation, see Ref. Sakkos et al. (2009). The transition was located by observing melting or solidification while working in the canonical ensemble, beginning with configurations of atoms placed on a randomly distorted lattice. Used in this way, the calculations determine a range in which the transition density is located. PIMC results confirm the validity of the harmonic approximation at low temperatures. At higher temperatures the transition density follows the classical melting curve (4).
The above results establish the solidification transition of the repulsive van der Waals model. Additionally, the dynamic nature of the Rydberg gas raises a possibility for the spatial ordering to be induced kinetically, as the combination of decay and strong blockade will favor supplanting excitations to be equidistant from their immediate neighbors. We modelled such a process and observed that replacement of decaying excitations in the local blockade regime indeed creates a short-distance order, but not a true long-distance crystalline ordering. These finding are consistent with much more elaborate dynamic models of Refs. Robicheaux and Hernández (2005); Amthor et al. (2010); Stanojevic and Côté (2010).
At low temperature, the gas phase of the model is expected to form a Bose–Einstein condensate (BEC). Transition between the BEC and normal gas phases at low densities lies slightly above the ideal Bose gas condensation temperature,
| (5) |
due to the repulsive interaction between particles Pilati et al. (2008). The correction is governed by the scattering length of the potential , which can be found to be equal to . The transition temperature is then given by , where is a positive constant of the order of unity (for details, see Ref. Pilati et al. (2008) and references therein). In the present case this expression is only valid at very low densities (one needs to satisfy at least to make the description in terms of the zero-momentum scattering length meaningful), where the magnitude of the correction is not significant.
At higher densities the BEC-to-normal gas transition is no longer universal and depends on the form of the potential. We determined the location of this second-order transition with the PIMC method by calculating the superfluid transition from the winding number estimator Pollock and Ceperley (1987). The PIMC calculations show that, at higher densities, the interactions deplete the condensate and the transition temperature is lower than for the ideal Bose gas. Combining the PIMC results, the region in which the triple point is located was determined as and , which we consider sufficiently narrow for practical considerations.
IV Comparison with experimental conditions
Because the interaction constant enters the reduced units [Eq. (1)], the effective temperature and density can be varied over many orders of magnitude. Most of the present experiments are deeply in the “classical” region of the phase diagram (Fig. 1). As an example, we consider the conditions of the experiments presented in Ref. Heidemann et al. (2008). For the excitation with 170 ns laser pulses, the system parameters at are and , which in fact correspond to the gas phase of the equilibrium phase diagram. For 320 ns excitation pulses and , and , well below the gas-to-solid transition. Therefore, the achievable temperature and density are already in the range suitable for investigating the equilibrium phase diagram. Increasing the excitation number increases the interaction constant and moves the system deeper into the classical regime where the gas and solid phases are separated by the simple condition of Eq. (4). The quantum regime of the phase diagram may be accessed by decreasing the excitation numbers or increasing the Förster defect .
Whether Rydberg atoms in actual experiments will reach or even approach an equilibrium phase depends on their lifetime, the experiment duration and availability of relaxation mechanisms. Because of the short lifetimes of the Rydberg states, most current experiments are performed on such short timescales as to make the thermal motion negligible. It is therefore said that the experiments are performed with Rydberg excitations of a frozen gas. If the experiments are extended closer to the currently achievable lifetimes of the Rydberg states, which can be as large as 100 s van Ditzhuijzen et al. (2008); Löw et al. (2009), some degree of thermal equilibration will already be achieved. Besides the thermal motion there are, however, at least two other kinds of motion that may need to be considered. The first one is the motion of the excited atoms due to the strong forces between them. The characteristic timescale associated with such a motion is the time that it takes for a Rydberg atom to travel the mean distance between Rydberg atoms. Given the mean distance and the imbalance force of the order of , this time is given by
| (6) |
For a small fixed number of Rydberg excitations time (6) decreases rapidly with the excitation number as ; as the local blockade is reached, , and instead grows as . For example, Rydberg systems created by the pulses from gas in the experiment of Ref. Heidemann et al. (2008) have . For the setup of Ref. Löw et al. (2009), while the clouds could be successfully studied for as long as . Collisional ionization and heating could potentially hamper such relaxation Amthor et al. (2007).
V Discussion and conclusions
As an example, consider the possibility of exploring the supersolidity in Rydberg systems. Ground state atoms dressed in Rydberg states exhibit weak van der Waals interactions at large distances, as described in Henkel et al. (2010). Supersolidity of such atoms was already investigated Cinti et al. (2010); Henkel et al. (2010). Consider instead a scenario in which the gas is additionally allowed to have a lattice of Rydberg excitations. Such a lattice would in turn impose weak but long-range spatial correlations onto the ground-state atoms. At the same time, the ground-state atoms may be placed in the BEC regime Heidemann et al. (2008). However, it may be impossible to identify which of the atoms was excited within a certain proximity, as was demonstrated, for example, by the superatom analysis of the experimental results in Refs. Heidemann et al. (2007); Tong et al. (2004). (However, motion will lead to dephasing of this state Honer et al. (2011).) If the atoms are indeed prepared in such a mixed state, combining the ground and excited states as , , then both the lattice-forming and the BEC components are indistinguishable and may be said to be formed by the same atoms. Therefore, such a system would consist of particles which would simultaneously break translational symmetry and possess off-diagonal long-range order, an epitomic realization of supersolid. While our model does not include the light field, the conditions for the phases of both excited- and ground-state atoms may be immediately extracted from Fig. 1, just with different reduced units for the two species.
In conclusion, it is possible to parametrize a model with isotropic van der Waals interactions into a universal phase diagram. We have characterized the phase diagram of Rydberg atoms by considering a model of bosons with repulsive van der Waals interaction, and determined solidification and Bose–Einstein condensation conditions. Relaxation mechanisms other than thermal motion should be considered if one considers Rydberg systems on time scales of several tenth of microseconds. Finally, it is worth mentioning that interactions between Rydberg excitations open a possibility of new supersolid scenarios.
Acknowledgements.
We acknowledge partial financial support by DGI (Spain) under Grant No. FIS2008-04403 and Generalitat de Catalunya under Grant No. 2009-SGR1003. G.E.A. acknowledges support from the Spanish MEC through the Ramon y Cajal fellowship program.References
- Heidemann et al. (2007) R. Heidemann et al., Phys. Rev. Lett. 99, 163601 (2007).
- Tong et al. (2004) D. Tong et al., Phys. Rev. Lett. 93, 063001 (2004).
- Singer et al. (2004) K. Singer, M. Reetz-Lamour, T. Amthor, L. G. Marcassa, and M. Weidemüller, Phys. Rev. Lett. 93, 163001 (2004).
- Ates et al. (2007) C. Ates, T. Pohl, T. Pattard, and J. M. Rost, Phys. Rev. A 76, 013413 (2007).
- Pohl et al. (2010) T. Pohl, E. Demler, and M. D. Lukin, Phys. Rev. Lett. 104, 043002 (2010).
- Weimer et al. (2008) H. Weimer, R. Löw, T. Pfau, and H. P. Büchler, Phys. Rev. Lett. 101, 250601 (2008).
- Löw et al. (2009) R. Löw et al., Phys. Rev. A 80, 033422 (2009).
- Robicheaux and Hernández (2005) F. Robicheaux and J. V. Hernández, Phys. Rev. A 72, 063403 (2005).
- Stanojevic and Côté (2010) J. Stanojevic and R. Côté, Phys. Rev. A 81, 053406 (2010).
- Younge et al. (2009) K. C. Younge, A. Reinhard, T. Pohl, P. R. Berman, and G. Raithel, Phys. Rev. A 79, 043420 (2009).
- Amthor et al. (2010) T. Amthor, C. Giese, C. S. Hofmann, and M. Weidemüller, Phys. Rev. Lett. 104, 013001 (2010).
- Schempp et al. (2010) H. Schempp et al., Phys. Rev. Lett. 104, 173602 (2010).
- van Bijnen et al. (2011) R. M. W. van Bijnen, S. Smit, K. A. H. van Leeuwen, E. J. D. Vredenbregt, and S. J. J. M. F. Kokkelmans, J. Phys. B 44, 184008 (2011).
- Schachenmayer et al. (2010) J. Schachenmayer, I. Lesanovsky, A. Micheli, and A. J. Daley, New J. Phys. 12, 103044 (2010).
- Weimer and Büchler (2010) H. Weimer and H. P. Büchler, Phys. Rev. Lett. 105, 230403 (2010).
- Ji et al. (2011) S. Ji, C. Ates, and I. Lesanovsky, Phys. Rev. Lett. 107, 060406 (2011).
- Sela et al. (2011) E. Sela, M. Punk, and M. Garst, Phys. Rev. B 84, 085434 (2011).
- Walker and Saffman (2005) T. G. Walker and M. Saffman, J. Phys. B 38, S309 (2005).
- Walker and Saffman (2008) T. G. Walker and M. Saffman, Phys. Rev. A 77, 032723 (2008).
- Heidemann et al. (2008) R. Heidemann, U. Raitzsch, V. Bendkowsky, B. Butscher, R. Löw, and T. Pfau, Phys. Rev. Lett. 100, 033601 (2008).
- Hammond et al. (1994) B. L. Hammond, W. Lester Jr., and P. J. Reynolds, Monte Carlo methods in Ab Initio quantum chemistry (World Scientific, Singapore, 1994).
- Boronat and Casulleras (1994) J. Boronat and J. Casulleras, Phys. Rev. B 49, 8920 (1994).
- Reatto and Chester (1967) L. Reatto and G. V. Chester, Phys. Rev. 155, 88 (1967).
- Nosanow (1964) L. H. Nosanow, Phys. Rev. Lett. 13, 270 (1964).
- Cazorla and Boronat (2008) C. Cazorla and J. Boronat, J. Phys.: Cond. Matt. 20, 015223 (2008).
- Cazorla et al. (2009) C. Cazorla, G. E. Astrakharchik, J. Casulleras, and J. Boronat, New J. Phys. 11, 013047 (2009).
- Ashcroft and Mermin (1976) N. W. Ashcroft and D. N. Mermin, Solid State Physics (Thomson Learning, Toronto, 1976).
- Chin (2004) S. A. Chin, Phys. Rev. E 69, 046118 (2004).
- Sakkos et al. (2009) K. Sakkos, J. Casulleras, and J. Boronat, J. Chem. Phys. 130, 204109 (2009).
- Pilati et al. (2008) S. Pilati, S. Giorgini, and N. Prokof’ev, Phys. Rev. Lett. 100, 140405 (2008).
- Pollock and Ceperley (1987) E. L. Pollock and D. M. Ceperley, Phys. Rev. B 36, 8343 (1987).
- van Ditzhuijzen et al. (2008) C. S. E. van Ditzhuijzen, A. F. Koenderink, J. V. Hernández, F. Robicheaux, L. D. Noordam, and H. B. v. L. van den Heuvell, Phys. Rev. Lett. 100, 243201 (2008).
- Amthor et al. (2007) T. Amthor, M. Reetz-Lamour, C. Giese, and M. Weidemüller, Phys. Rev. A 76, 054702 (2007).
- Henkel et al. (2010) N. Henkel, R. Nath, and T. Pohl, Phys. Rev. Lett. 104, 195302 (2010).
- Cinti et al. (2010) F. Cinti, P. Jain, M. Boninsegni, A. Micheli, P. Zoller, and G. Pupillo, Phys. Rev. Lett. 105, 135301 (2010).
- Honer et al. (2011) J. Honer, R. Löw, H. Weimer, T. Pfau, and H. P. Büchler, Phys. Rev. Lett. 107, 093601 (2011).