Stochastic Processes, Slaves and Supersymmetry
Abstract
We extend the work of Tǎnase-Nicola and Kurchan on the structure of diffusion processes and the associated supersymmetry algebra by examining the responses of a simple statistical system to external disturbances of various kinds. We consider both the stochastic differential equations (SDEs) for the process and the associated diffusion equation. The influence of the disturbances can be understood by augmenting the original SDE with an equation for slave variables. The evolution of the slave variables describes the behaviour of line elements carried along in the stochastic flow. These line elements together with the associated surface and volume elements constructed from them provide the basis of the supersymmetry properties of the theory. For ease of visualisation, and in order to emphasise a helpful electromagnetic analogy, we work in three dimensions. The results are all generalisable to higher dimensions and can be specialised to one and two dimensions. The electromagnetic analogy is a useful starting point for calculating asymptotic results at low temperature that can be compared with direct numerical evaluations. We also examine the problems that arise in a direct numerical simulation of the stochastic equation together with the slave equations. We pay special attention to the dependence of the slave variable statistics on temperature. We identify in specific models the critical temperature below which the slave variable distribution ceases to have a variance and consider the effect on estimates of susceptibilities.
DAMTP-2011-42
1 Introduction
Stochastic processes have applications in many areas of physics. They are a natural way of describing the effect of thermal interactions on dynamical systems subject to force fields of various kinds. These force fields could be, for example, the inter-atomic potentials represented by an energy landscape appropriate to a molecular model [1]. In another type of application, stochastic processes provide a method for achieving a desired probability distribution for the system. This method is the basis for the theory of stochastic quantisation in quantum field theory. It has been exploited in the numerical simulation of quantum field theories [2, 3, 4].
One way of investigating the structure of a dynamical system is to subject it to external disturbances. This can be accommodated in the stochastic dynamics by inducing small changes in the motion of the particle either by changing its initial position or by altering the force field guiding the particle throughout its motion. If these external influences are infinitesimal the result, for a given sample from the noise ensemble, is an infinitesimal shift in the path of the particle. It can be regarded as an infinitesimal line element carried by the particle along the path of the original motion. Because the equation describing the evolution of this line element is derived from the original stochastic equation and turns out not to contain the noise term we refer to it as a slave equation and to the infinitesimal line element as a slave variable.
The response of the mean position of the system to external influences, that is its susceptibility, can be calculated once the statistical properties of the slave variables are known. Some aspects of slave variable statistics in a one dimensional case have been investigated in [5]. In higher dimensions there exists also the possibility of examining the evolution and statistical properties of infinitesimal area and volume elements that can be constructed from the the line elements. The evolution of area and volume elements plays a significant role in turbulent fluid flow and in magnetohydrodynamics [6, 7, 8, 9, 10, 11, 12]. In the models studied in this paper these higher dimensional area and volume elements can be thought of as the images of area and volume elements in the parameter space of the external fields. Their statistical properties thus give rise to higher dimensional susceptibilities. These generalised susceptibilities can be readily computed in numerical simulations and their evaluation can help to elucidate the topography of the landscape function. In addition we will find that the hierarchy of generalised susceptibilities fits naturally into the supersymmetric structure underlying the stochastic dynamical system. In turn the supersymmetric analysis makes possible the calculation of these quantities.
A comprehensive review of material that is relevant particularly to one-dimensional systems and the supersymmetry approach we adopt here is contained in reference [13]. Witten [14] has explained the relationship between supersymmetric quantum mechanics and the topology of manifolds. Making use of the idea that diffusion processes can be regarded as quantum mechanics in imaginary time, Tǎnase-Nicola and Kurchan [15, 16] have developed these ideas emphasising the diffusion point of view and using it to construct practical simulation techniques for picking out the saddle point structure of the landscape function.
In this paper we extend the work of Tǎnase-Nicola and Kurchan [15, 16] and show it can be developed to compute significant physical observables. We do this in part by developing an electromagnetic analogy based in the Principle of Minimum Dissipation. This allows us to understand the structure of the physical states of the system in a way that is particularly revealing in the low temperature limit. It can also be the basis of an optimised approximation scheme at higher temperatures though we do not pursue this idea here.
The structure of the paper is as follows. In section 2 we describe the basic stochastic model that we study. In section 3 we derive the slave equations, first for an infinitesimal change in the initial position of the particle and second for a weak external field. We show how they can be encoded in the supersymmetric formalism by introducing an appropriate supersymmetric Hamiltonian. Section 4 contains a brief exposition of the numerical method we use for simulating the stochastic differential and slave equations. In section 5 we give, for completeness and to establish notation, a brief account of the state space on which the Hamiltonian acts and an outline of the structure of its eigenstates. In section 6, we develop an electromagnetic analogy that helps us to understand the structure of the eigenstates of the supersymmetric Hamiltonian and their time evolution under various circumstances. The analogy is developed in section 7 where we show that the evolution of the eigenstates obeys a Principle of Minimum Dissipation.
In section 8, the low temperature limit in which it is possible to compute low lying eigenvalues of the supersymmetric Hamiltonian and associated decay exponents is discussed. The application of the supersymmetric theory to the case of an external electric field together with a derivation of the associated Einstein Relation is set out in section 9. Explicit examples of the calculations, in one and two dimensions, are exhibited in sections 10 and 11, where we compare the results of various numerical techniques. Finally we we discuss the results and their potential significance in section 12.
2 Basic Stochastic Model
In this paper we consider a particle with three degrees of freedom, , that obeys the stochastic differential equation of the form
| (1) |
where is a stochastic process for which
| (2) |
for some correlator . The angle brackets denote averaging over the noise ensemble. Aspects of our discussion are independent of the precise nature of the noise . Ultimately however we will be interested in the case of white noise. From now on therefore we will assume that
| (3) |
We will refer to as the temperature of the system. It is implicit in our assumptions that the ensemble of white noise processes is rotationally invariant in the particle configuration space. While this is not the most general case it is sufficient for illustrating our approach.
The drift term in eq(1) is assumed, as indicated above, to be derived from an energy landscape function . That is . Higher derivatives of will also be indicated with suffixes, thus , and so on. It is convenient and not really restrictive to assume that rises like a power of as . As a consequence the particle will remain confined to an essentially finite region in -space throughout its motion. If we assume that at time the particle is at the point then at later time , for a given element of the noise ensemble, the motion of the particle will be that solution, , of eq(1) that satisfies . The probability distribution for the position is
| (4) |
It is standard theory that satisfies
| (5) |
where . Our assumption about the form of implies that as where
| (6) |
The static solution is unique and has the form
| (7) |
where
| (8) |
Here for compactness we use . Clearly
| (9) |
It is also convenient to introduce
| (10) |
We have
| (11) |
Eq(5) incorporates the operator where
| (12) |
It is convenient to construct an associated hermitian operator where
| (13) |
The two operators and have the same eigenvalues but the latter has the additional property that its left and right eigenfunctions are identical. We note that
| (14) |
and finally that eq(11) implies that
| (15) |
3 Slave Equations
For a number of reasons both mathematical and physical it interesting to examine the effect on the motion of the particle of small external changes. In this paper we consider two types of change, namely, a change of initial conditions where , and the application of an external field where the drift velocity is modified by making the replacement . The functions are a basis set for the external influences in which we are interested. A significant case is one where . This is equivalent to the replacement. The choice describes the action of an electric field on the motion of the particle. We will be interested also in situations in which is not the gradient of a scalar field. An external magnetic field falls into this category.
We assume that all the effects are weak so it is sufficient to consider a limit in which for a given noise function the induced change, , is such that or .
3.1 Variation of Initial Position
The effect of an infinitesimal variation of the initial position of the particle can be computed from the behaviour of the quantities where
| (16) |
The differentiation is performed for a fixed sample of the noise. These variables satisfy the equation
| (17) |
We refer to the as slave variables and to eq(17) as a slave equation. The slaves depend on the noise only through the original position variables but the latter are not influenced by the evolution of the slaves. These variables were introduced by Graham [17] who first elucidated their relationship with the underlying supersymmetric structure of the theory. He identified the relationship of the associated decay exponent with a supersymmetric eigenvalue problem.
Because it is a useful introduction to the properties of slave variables we will briefly review in our notation some of his results. The first step is to introduce the joint probability distribution where
| (18) |
It is standard theory, given eq(1) and eq(17), that
| (19) |
We introduce the quantities , where
| (20) |
At time
| (21) |
Here is the volume element in -space. From eq(19) we can show that
| (22) |
Following Graham [17], we introduce a set, , of anticommuting variables, one for each of the variables , together with their hermitian conjugates, , and a fermionic ground state . The new fermionic variables satisfy the (Clifford) algebra
| (23) |
and
| (24) |
The fermionic ground state satisfies
| (25) |
and is normalised so that .
We now augment the operator by defining where
| (26) |
and define the state so that
| (27) |
It is easily checked that
| (28) |
We now introduce where
| (29) |
and define the state
| (30) |
Eq(22) can now be put in the form
| (31) |
The formal solution to this equation is
| (32) |
It follows that the long time behaviour of and hence that of and finally of is dominated by the lowest eigenvalue, , of in the one fermion sector of the state space. Typically we expect that at large times
| (33) |
Therefore the decay exponent , that governs the large time statistical evolution of line elements is given by
| (34) |
This is the essence of Graham’s results [17] . We will examine later the supersymmetric structure of .
The above approach can be extended to area elements. We consider the infinitesimal area element at which has the form . At a later time it has evolved into the element
| (35) |
That is
| (36) |
where
| (37) |
Clearly
| (38) |
where
| (39) |
We define and so that
| (40) |
From eq(19) we can show that
| (41) |
We define
| (42) |
Eq(41) is equivalent to the result
| (43) |
It follows that the behaviour of at large times, and hence that of and , is dominated by the lowest eigenvalue of in the two-fermion sector. This is again one of Graham’s results [17].
Clearly the argument can be generalised to higher dimensional volume elements. We will not exhibit the argument in detail. The important point is that the time evolution of a state, , at any fermionic level is governed by the equation
| (44) |
Decay exponents for differential volume elements of any dimension can be calculated through the eigenvalues of the supersymmetric Hamiltonian.
3.2 External Fields
The effect of an external field can be induced by replacing eq(1) with
| (45) |
Of particular interest is the electric case where . We can think of the set as a set of electric potential functions. If we make the further specialisation
| (46) |
the resulting field is an uniform electric field . The magnetic case is one in which and is not the derivative of a function . We will consider the magnetic case in detail later. The following derivation covers both cases.
If we solve eq(45) for a particular sample of the noise process with a given initial condition, , say, then at a later time, , the value of will depend on the value of and we can regard the solution at this time as providing a map from -space to -space. Therefore curves and surfaces in -space will have images in -space that are also curves and surfaces. We can examine the differential version of this map by introducing appropriate slave variables given by
| (47) |
we have then
| (48) |
By differentiation eq(45) with respect to we can obtain an equation for the evolution of namely
| (49) |
Of course we have set after differentiation. The initial condition for the slave is since we assume that is independent of .
Eq(48) implies that
| (50) |
that is
| (51) |
Thus can be understood as a set of susceptibilities of the system at time with respect to the various contributions to the external field in the weak field limit .
Eq(1) and eq(49) imply that the joint probability distribution, , given by
| (52) |
satisfies
| (53) |
An important distinction between this case and the previous one is that we expect the joint probability distribution to approach a static form at large time. That is as , where
| (54) |
We shall be mainly interested in this asymptotic static situation from now on. Following the pattern established in subsection 3.1 we define, for this new case, and so that
| (55) |
Hence
| (56) |
We can interpret as the contribution to the susceptibility from the particles in the neighbourhood of the point . From eq(54) we can deduce that
| (57) |
Invoking the fermionic variables introduced above and setting
| (58) |
we find that eq(57) can be expressed in the form
| (59) |
3.2.1 Area Elements
The discussion can be extended to area elements. At time the solutions of eq(45) map the -space area element into the -space area element thus
| (60) |
where
| (61) |
We can think of at large as a generalised area susceptibility. The relationship of this susceptibility for the supersymmetric structure can be understood by defining and so that
| (62) |
where
| (63) |
Hence
| (64) |
From eq(54) we can show that
| (65) |
If we now define
| (66) |
then eq(65) can be put in the form
| (67) |
From eq(67) we can calculate the area susceptibility in terms of the eigenstates of at the second fermionic level. The procedure can be generalised to deal with volume elements (of any dimension). Higher order susceptibilities of this kind fit naturally into the supersymmetric approach to the diffusion model. However, while we feel that they are an interesting area for study, in contrast to the standard susceptibility to the action of an external field, their observability is unclear.
4 Simulation
We will test some of the theoretical predictions of the stochastic model by simulation. The first order algorithm corresponding to eq(1) with correlator given by eq(3) is a process in which for a time step , where
| (68) |
Here is a Gaussian random variable with correlator
| (69) |
The errors in the simulated probability distributions are . In order to control errors more easily we use a second order algorithm with an intermediate step where
| (70) |
The final step is
| (71) |
where and are Gaussian random variables of the same type as above. This procedure, which is a stochastic second order Runge-Kutta technique can be extended to include the slave equation in an obvious way. The resulting probability distributions have errors that are .
5 Supersymmetric Formulation
Apart from the straightforward case in which is a quadratic function, the equations for and are intrinsically non-linear. It is a remarkable and significant fact that associated with such non-linear processes is an underlying linear algebraic structure [14, 15, 16, 18, 17, 19, 20]. The supersymmetric formulation of the theory is a powerful way of organising this linear algebraic structure. Although well known, see in particular [15, 16], in the interests of completeness and to establish some notation we give an account of it here.
The supersymmetric structure is made evident by the construction of the operators
| (72) |
and
| (73) |
They satisfy
| (74) |
The combinations and are hermitian and satisfy
| (75) |
We also have
| (76) |
where
| (77) |
and is given by eq(26).
5.1 The Kernel of
From eq(26) we see that is in the kernel of . Eq(76) then tells us that is in the kernel of and that of also. In fact any eigenstate in the kernel of is annihilated by both and and hence by both and .
The operator counts the number of -excitations in a state. It commutes with and can be used to classify the eigenstates of H. In particular the basis states in the kernel of can be chosen so that they are each associated with an eigenvalue of , that in our three-dimensional model can take one of the values 0, 1, 2, or 3. If there is only one basis state in the kernel of then it can be taken to be and
| (78) |
In fact because our model involves only a simple flat euclidean space, the kernel of is one dimensional and spanned by [14].
5.2 Eigensubspace structure of
We also see that if is an eigenstate of with eigenvalue then so is the orthogonal state (or equivalently ). That is, the eigenstates of that are not in its kernel come in pairs with equal eigenvalues. There is no corresponding constraint on the eigenstates lying within the kernel.
On any subspace with and , that does not intersect the kernel of we have the projection operators
| (79) |
and
| (80) |
They satisfy
| (81) |
and other appropriate relations. It follows that, in general, is a direct sum of two orthogonal subspaces that satisfy
| (82) |
Therefore the basis states of can be chosen so that they lie in either or . In an obvious notation we have
| (83) |
It is then obvious from the discussion that we could choose phases so that
| (84) |
with and
| (85) |
and .
It follows then that any state in of the form lies in . It is also true that any state that lies in can be put in the form where lies in . The state is not unique but the ambiguity can be removed by requiring that lies in . That is, by imposing the condition . Similarly a state that lies in can be put in the form for some state that lies in and that satisfies .
The above analysis has to be modified for the extreme subspaces and . The subspace is a direct sum of and the one dimensional subspace containing . The subspace is identical with .
6 Electromagnetic Analogy
An investigation of the eigenstates and eigenvalues of the supersymmetric Hamiltonian is equivalent to studying the evolution equation, eq(44) at each fermionic level. It is helpful, then, to think in terms of an analogy with electromagnetic systems. The analogy makes it natural to introduce the Principle of Minimum Dissipation that we establish in section 7. In turn this will help us to establish in a natural way the structure of the eigenstates of the supersymmetric Hamiltonian and in particular, in the low temperature limit as elucidated by Tǎnase-Nicola and Kurchan [15]
6.1 Zero Fermion Level
Consider, for example, a state in the zero fermion sector. It has the form
| (86) |
In the context of our proposed electromagnetic analogy, it is convenient to associate with it a charge density distribution where
| (87) |
(Of course and may also have a dependence on that we leave implicit).
The image of in the one fermion sector is . It follows immediately that and therefore that . Evaluating explicitly we find
| (88) |
We continue the electromagnetic analogy by associating with an electric current density where
| (89) |
The justification for these identifications is that, if we assume that satisfies eq(44), we find that
| (90) |
which is indeed the law of conservation of charge. We can complete the analogy by identifying as the voltage distribution and as the electric field acting on the charge. The static probability density distribution plays a dual role. It is the capacity per unit volume and also determines the local conductivity, which is .
The eigenvalue equation for the supersymmetric Hamiltonian in the zero fermion sector can be re-expressed in the analogy by making the replacements , and , where the superfix indicates that the quantity is evaluated at and is the eigenvalue of the supersymmetric Hamiltonian. We have then a new form for the eigenvalue equation from eq(90)
| (91) |
We obtain in the standard way the integral version of eq(90) namely
| (92) |
where is an arbitrary region of space and is its bounding surface.
The norm of the state also has a natural interpretation. If we define so that
| (93) |
then we find
| (94) |
That is, the norm of has can be interpreted as the electrostatic energy of the state.
6.2 One Fermion Level
A parallel analysis can be carried out at fermionic level one. A state has the form
| (95) |
and is annihilated by . That is
| (96) |
It follows that
| (97) |
That is, the state is associated with a conserved vector field, , where
| (98) |
If we adopt eq(44) as the equation of motion, then we have
| (99) |
We can interpret this equation in terms of an electromagnetic analogy in the following way. We identify as the magnetic field and as the magnetic induction field. Eq(98) then implies that and hence that plays the role of (position dependent) magnetic permeability. We introduce an electric current and an electric field . We link them through a space dependent version of Ohm’s Law,
| (100) |
where the space dependent conductivity is given by
| (101) |
Eq(97) is easily restated as
| (102) |
Eq(99) is reproduced by combining Faraday’s law of induction
| (103) |
with Ohm’s law and Ampre’s law
| (104) |
That is we have
| (105) |
By setting etc. where is an eigenvalue of the supersymmetric Hamiltonian at the one fermion level, we obtain the eigenvalue equation in the form
| (106) |
It is interesting that allowing for the position dependent magnetic susceptibility represented by this equation has a form analogous to the London Equation for a superconducting medium [21, 22].
We can obtain an integral version of eq(103) in the form
| (107) |
where is an arbitrary surface and is its bounding loop with the conventional right-handed orientation. We also have the integral version of eq(104) namely
| (108) |
Again, from the norm of the state, we can identify an energy given by
| (109) |
In the context of the electromagnetic analogy this a very natural result.
6.3 Two and Three Fermion Level
For completeness we discuss briefly the two and three fermion sectors.
The evolution of the states in the subspace can be obtained by the application of to the states in that we have just discussed.
The evolution of the states in can most easily be investigated by applying to the corresponding states in . These states, because we are in three dimensions, have the form
| (110) |
The supersymmetric equation of motion then implies
| (111) |
This is very close to the original diffusion equation for but with the replacement [13]. However since is not a normalisable wavefunction, there is no stationary solution corresponding to a zero eigenvalue of the Hamiltonian .
7 Principle of Minimum Dissipation
We derive here the Principle of Minimum Dissipation in the context of the electromagnetic analogy. We will be able to make use of the principle to derive the spatial structure of wavefunctions with low lying eigenvalues in the large limit.
7.1 Zero Fermion Sector
Eq(90) implies that the energy dissipation rate is
| (112) |
The last step is achieved by integrating by parts. The result is clearly consistent with the idea of an electric current being driven by by a potential gradient. It follows that
| (113) |
It is a well known principle that, for a given set of sources, the true current distribution minimises the energy dissipation as calculated from eq(113). We can verify this in the present context by noting that if we modify so that
| (114) |
where is an arbitrary antisymmetric tensor field then is unchanged and therefore retains the same (time-dependent) source distribution as the original current distribution. However the new dissipation rate calculated from eq(113) is
| (115) |
The cross term vanishes after integration by parts. Clearly the minimum of occurs when vanishes and acquires its physical value. This outcome can be described by saying that for given sources the true current follows the path of least resistance. Under appropriate circumstances we can use the principle to identify (or guess) the true current distribution given the source distribution. For example we will be interested later in circumstances in which is very large. In this limiting regime the hills and valleys of are highly magnified in the rise and fall of the local resistivity, . Indeed certain regions where is large become effectively insulators. We are therefore in a good position to identify the complementary regions in which the current can flow easily and in which in which remains substantial. The structure of these regions depends on the detailed shape of but in the models we consider they will be filaments along lines of steepest descent. The calculation becomes essentially one in electric circuit theory where the ideas of minimal dissipation are very familiar.
Of course approximation schemes based on the principle of minimal dissipation could be formulated to deal with circumstances in which the temperature is well above the low temperature limit. We do not pursue such calculations in this paper.
7.2 One Fermion Sector
Equivalent results can be obtained at the one fermion level. From eq(105) we can verify that the dissipation is given by
| (116) |
We can modify by making the replacement where is a scalar field. This leaves the law of induction unchanged. The dissipation however is changed to
| (117) |
It is clear that the minimum occurs when vanishes and acquires its true value. We can see from this principle that for a given set of sources the electric field will be greatest where is greatest and least where it is least. In the low temperature limit these variations are exaggerated and this allows us to separate the space into regions of essentially zero electric field and complementary regions, confined to thin sheets in our model, where is large.
Of course these results can be generalised to any fermionic level but we shall not present them explicitly. They will help us in understanding the structure of the eigenstates of the supersymmetric Hamiltonian and their associated current distributions.
8 High- Limit and Low Lying Eigenvalues
Witten [14] emphasised the importance of the limit of high in analysing the structure of stationary points of . Tǎnase-Nicola and Kurchan [15, 16] interpreted the limit in the context of diffusion processes and developed computational algorithms for exploring the neighbourhoods of stationary points. The model they considered was one in which is a Morse function and therefore has stationary points with non-degenerate quadratic structure. We discuss the model here and show how we can develop the electromagnetic analogy to compute decay exponents in the high -limit.
8.1 Zero Fermion Level
We will investigate a model in which is a Morse function with a set of minima at the (sufficiently well separated) points where . The minima have a quadratic structure with the result that in the neighbourhood of the minimum at we have
| (118) |
where and . Clearly
| (119) |
where are the eigenvalues of and are the corresponding eigenvectors. We are interested in a situation in which is very large (low temperature). In these circumstances is significantly non-zero only in the neighbourhoods of the minima. We have
| (120) |
This approximation is adequate for computing the limiting expectation values of appropriately smooth and slowly varying functions of . However we note parenthetically that there are circumstances in which we may wish to compute the next-to-leading corrections and that this can be achieved by including terms in the eigenfunction approximation that involve third derivatives of . The effect can be accounted for by shifting the mean of from by an amount that is .
The partition function, in this approximation, can be expressed in the form
| (121) |
where
| (122) |
If we define so that
| (123) |
then we can interpret as the probability of the particle being in the neighbourhood of the th minimum. The stationary probability distribution is approximately
| (124) |
where is the probability distribution appropriate to the th minimum. Similarly the null state of can be expressed as
| (125) |
where .
In fact we can use the states as an essentially orthonormal basis for the low eigenvalue subspace of . The eigenstates of in this subspace have the form
| (126) |
where is slowly varying as a function of and . Because of the effective orthonormality of the eigenfunctions and of the basis set the matrix with elements is orthogonal, that is
| (127) |
and
| (128) |
We can extend the basis for the subspace in two ways. First we can add excited states associated with the quadratic structure at each minimum. These states are, like the corresponding ground states , peaked about each minimum. They are of course orthogonal to these ground states. The associated eigenvalues are proportional to . Second we note that, in the limit of large , all stationary points, including saddles and maxima, yield minima of the potential in the Hamiltonian . We can include then the ground states and higher states associated with the quadratic structure of each of the stationary points. These states, in the high- limit, are all orthogonal to one another and to the states associated with the minima of discussed above. Again all of the states have eigenvalues that are proportional to . Of course we must cut off the eigenvalue expansions before the corresponding eigenvalues rise to the point where we expect serious mixing between the true eigenstates of . However if the quantities we wish to evaluate are dominated by the lower lying of these large eigenvalue states this mixing will not be significant.
We can account for the lowest of these eigenstates that are peaked at saddles rather than minima by extending the range of to label all stationary points and defining the corresponding states to be
| (129) |
where
| (130) |
and
| (131) |
being the eigenvalues (not all positive) of and the corresponding eigenvectors. This form for these eigenstates implies that it is not very convenient to express them in the ”typical” form of eq(86). Of course the higher excitations based on the quadratic structure associated with in eq(131) are also available as eigenstates.
8.2 Fermionic Levels
An analysis of low lying states at the first fermionic level can be carried out along the same lines. As pointed out by Witten [14] and further discussed by Tǎnase-Nicola and Kurchan [15], the relevant wavefunctions are those concentrated at the stationary points of for which has one negative eigenvalue, that is at saddle points with a Morse index of unity. Indeed they contain as factors the saddle wavefunctions discussed in subsection 8.1. The term in the supersymmetric Hamiltonian appropriate to this saddle, guarantees that the lowest lying state has zero eigenvalue in this approximation. Wavefunctions associated with excitations at these saddles have eigenvalues proportional to , The other wavefunctions based on the original minima and on saddles with a Morse index of two or higher are also available as eigenfunctions but have lowest eigenvalues proportional to . We will not repeat the analysis in detail but mention two points.
First, since the low lying eigenstates in can be raised by the application of to provide the low lying eigenstates in there must be at least saddle points of with unit Morse index. If there are more than such saddles then the excess is accounted for by the corresponding number of low lying eigenstates in . By again applying to these states we create a number of low lying eigenstates in which then in turn provide a lower bound on the number of saddles of with a Morse index of 2. The argument can be carried on until we run out of higher saddles or maxima. This argument is the basis on which one can derive the Morse inequalities from supersymmetry [14, 15].
Second the action of on the approximate form for the low lying eigenstates of, say, produces zero because the eigenvalue of each of these states is zero in this approximation. It follows that the approximation is inadequate for dealing with the subtle structure of the eigenstates that allows to move the peaks in the wavefunctions in at the minima of to the peaks of the wavefunctions in at the saddles of .
8.3 Current Flow at Large Times
As emphasised by Tǎnase-Nicola and Kurchan [15, 16] the way to understand the link between fermionic levels is to study the currents associated with the states in . Any initial probability distribution can be expressed as a superposition of eigenfunctions of (see eq(12)). After a sufficient length of time the influence of contributions from eigenfunctions associated with high lying eigenvalues will have died away and the system will acquire a probability distribution that lies in the subspace spanned by the set . As time progresses the occupation of the various minima will settle down to the equilibrium values. The equilibriating process is the flow between minima of the currents mentioned above [15, 16]. For our purposes then the system starts in a state where
| (132) |
where . This corresponds to the probability distribution
| (133) |
We assume that is, in the neighbourhoods of each of the minima, a relatively smooth function after the initial fast partial relaxation. Now by exploiting our electromagnetic analogy we can identify a charge, , associated with the minimum at ,
| (134) |
and we can identify as the voltage at , then we see that is the capacitance at that minimum. Now
| (135) |
where is the total current flowing from to . Because of the linearity of the diffusion process we have
| (136) |
where is the resistance between the two minima. As a result the time dependence of the equations for the voltages becomes
| (137) |
We can then find the low lying eigenvalues of by looking for the solutions of this equation that have the form where are constants that obey the homogeneous equations
| (138) |
Of course , where the values of that make these equations soluble, are the low-lying eigenvalues of .
The problem then reduces to calculating the resistances. Recall that the principle of minimum energy dissipation tells us that the actual current distribution is along paths of least resistance. The local resistivity is and is least in the neighbourhoods of paths of steepest descent (where these exist) passing between minima and over saddles (Morse index 1). When is very large any departure from these neighbourhoods penalises the flow of current in terms of energy dissipation very severely.
Consider a typical pair of minima connected across a saddle at . Eq(90) tells us that away from the sources of current at the minima the current distribution is divergenceless. This confirms that the total current flowing parallel to the curve of steepest descent is constant along the curve. Near a point on the curve of steepest descent with unit tangent vector the current distribution is . By definition
| (139) |
This tells us that near the curve of steepest descent and hence that is constant across the profile of the current. The total current is where
| (140) |
are a set of two Cartesian coordinates orthogonal to the curve at and is the transverse area element.
Now
| (141) |
for points near . Here is the matrix determining the locally quadratic cross-section of the ”wire” conducting the current in the neighbourhood of the curve of steepest descent from the saddle. We can define a cross-section value for the wire, through the equation
| (142) |
That is
| (143) |
where and are the positive eigenvalues of the matrix and hence also of . It follows then that
| (144) |
or
| (145) |
where is distance along the curve of steepest descent. On integrating along the curve of steepest descent between the minima we see that the resistance to the flow of current is
| (146) |
where the integration covers the path between the minima. However in the limit of large the integral is dominated by the contribution from near the saddle at the point where the integrand is largest. We have then in this limit
| (147) |
where is the negative eigenvalue of the matrix with components . In the same way we can calculate the resistance between any two minima of .
Later we will require the above result specialised to one and two dimensions. The one-dimensional result is obtained by setting and we have
| (148) |
The two-dimensional result is obtained by setting the one-dimensional cross-section to
| (149) |
where is the single positive eigenvalue of . We have
| (150) |
8.4 One-Fermion Level
The behaviour of the system at the one-fermion level parallels that at the zero-fermion level. As discussed in subsection(6.2) the wave functions in are characterised by a field distribution and an associated field satisfying . That part of an initial field distribution represented by eigenfunctions with high lying eigenvalues will decay rapidly as will the corresponding contributions to the energy . The remaining contributions from the eigenstates with low lying eigenvalues will survive for much longer and will be associated with field distributions that permit the energy to be as low as possible in the circumstances. In the zero-fermion sector this argument implied that the density retreated to the neighbourhoods of the minima of . In the one-fermion sector, because the field has zero divergence, it cannot be concentrated only in the disjoint neighbourhoods of the minima of but must instead be distributed along the filaments surrounding the paths of steepest descent joining these minima across saddles with Morse index one. In other words lies in the same channels as the currents we discussed in the zero-fermion sector. Since is a conserved field the actual distribution must be a superposition of loops of field. This is the same picture as elucidated in [15, 16] except that in our electromagnetic analogy we replace the conserved current with the magnetic induction field. The number of independent loops is of course equal to the number of saddles with Morse index two.
For simplicity consider a situation with only one saddle of Morse index two and one associated loop . We define a magnetic loop integral, , by
| (151) |
where the integration is round the loop . As argued above, in the limit of large , and for times sufficiently large, the field distribution will closely follow the loop of curves of steepest descent as will therefore the field in the neighbourhood of the loop. If we integrate, as in the resistance calculation in the above discussion of the zero-fermion sector, over the cross-section of the loop current then we find that the total magnetic flux, , which is constant round the loop, is related to the magnetic field at the loop by
| (152) |
where is the unit tangent vector at on the loop. That is, along the loop,
| (153) |
and therefore on integrating round the loop we have
| (154) |
where is identical to the total resistance round the loop evaluated as the sum of the resistances of the various segments evaluated previously.
To complete the dynamics we apply eq(107) by choosing the surface to be a disc-like element crossing the channel of steepest descent in which the magnetic flux field is concentrated. This implies that
| (155) |
Note that this is true for any loop encircling the the steepest descent curve. The result is therefore independent of the position at which the loop cuts the surface of steepest descent emerging from the saddle with Morse index 2. It is also independent of the angle at which it crosses the surface. That this is possible is due to the fact that is significant only in the neighbourhood of the surface of steepest descent, being smooth in this neighbourhood. Independence of the angle of incidence requires that and are orthogonal to the surface of steepest descent. On evaluating the right side of eq(155), in the limit of high , we find
| (156) |
where is the thickness of the steepest descent surface defined so that
| (157) |
where is the normal to the surface of steepest descent at . If we make explicit the quadratic structure of the transverse dependence of then
| (158) |
and
| (159) |
where is the second derivative of in the direction of .
On the surface of steepest descent we have from eq(155)
| (160) |
Integrating both sides of this equation over the surface of steepest descent we obtain
| (161) |
In the limit of large the integral on the right is dominated by , the saddle with Morse index 2. We have
| (162) |
Here and are the eigenvalues of the matrix of second derivatives of along the surface at the saddle point.
Combining eq(162) and eq(154) we find
| (163) |
From this equation we can read off the decay exponent . It is
| (164) |
This result can be generalised to deal with situations involving more than one saddle with Morse index two and hence more than one loop.
The result can be specialised to the two-dimensional case by setting the thickness to unity with the result
| (165) |
9 External Electric Field
We can apply our understanding of the supersymmetry structure to the case of an external electric field and the calculation of the associated susceptibilities. In particular we derive the appropriate form of the Einstein relation between the susceptibility matrix and the fluctuation correlation matrix.
From subsection 3.2 we see that we are dealing with a field of the form . It follows that
| (166) |
From eq(59) and the fact that commutes with the Hamiltonian we find
| (167) |
Now and has no zero eigenvalues in this subspace it follows that
| (168) |
and therefore that .
We have also
| (169) |
Combining this result with eq(59) and eq(168) we find that
| (170) |
It follows that
| (171) |
for some coefficients . Taking a scalar product with we obtain the result
| (172) |
We have then
| (173) |
Multiplying by and taking the scalar product with we find
| (174) |
where
| (175) |
The left side of eq(174) can be put in the form
| (176) |
The right side of this equation can be expressed as
| (177) |
Combining eq(174) and eq(177) we obtain
| (178) |
This is our general form for the Einstein relation. In this form it can be generalised to arbitrary, possibly compact, manifolds.
If we specialise to the case for which we obtain the more standard result, relevant to a uniform external field,
| (179) |
The argument given here is a generalisation of the corresponding argument for a one-dimensional system presented in [5].
9.1 Computation of Susceptibility
We are particularly interested in the susceptibility of the system in a uniform external field. Note that there is no distinction here between the labels and . To compute this susceptibility we evaluate the conditional susceptibility in terms of the eigenstates of that lie in .
Eq(168) implies that
| (180) |
for some . If we set then
| (181) |
Although is unchanged by the addition of a constant to , in fact and hence are rendered unique by the requirement that is orthogonal to . Eq(173) implies that
| (182) |
That is
| (183) |
Again denote the eigenstates of in with eigenvalues , by . We have then
| (184) |
where
| (185) |
From eq(183) we have
| (186) |
where is the dipole moment associated with the state and is given by
| (187) |
We have then
| (188) |
From we can compute . We have
| (189) |
where is a current associated with and is given by
| (190) |
The eigenvalue equation for is equivalent to the result
| (191) |
This can be re-expressed in the form
| (192) |
where the introduction of the term with is arbitrary but convenient. We have then
| (193) |
where
| (194) |
On integrating both sides of eq(193) the total divergence drops out and we obtain
| (195) |
The result is, as it should be, symmetrical in and even though this symmetry is not required for itself. Note that the summation over can be extended to include the null contribution from the state .
9.2 Derivation of Susceptibility at High
In eq(195) the summation can be split into two parts. The first part which we denote also by , has restricted to the low lying eigenstates of including the ground state . If we denote this contribution by then eq(195) tells us that
| (196) |
If we exploit the orthogonality of the matrix with elements we have
| (197) |
and ultimately
| (198) |
The second part of the summation is over high lying eigenstates of . We can describe this summation by making the replacement where runs over the set of minima and runs over the high lying states of the quadratic approximation to the -th minimum. In order to compute the local dipole moment at the minimum we can restrict the summation over taking into account only those states account for the lowest set of such states for which the corresponding is linear in . It is then reasonable to assume that the mixing between the neighbourhoods of different minima experienced by yet higher lying states can be ignored.
There is a subtlety relating to the normalisation of the states. We have assumed that
| (199) |
For states concentrated in the neighbourhood of the -th minimum this means that
| (200) |
If instead we denote these localised states by with the normalisation
| (201) |
then we must reconcile the two normalisations by making the replacement in eq(187) . Denoting then the second contribution to the right side of eq(195) we have
| (202) |
Finally we can make the replacement in this equation without changing the result. It follows then that
| (203) |
The result is
| (204) |
and is consistent with the Einstein relation if we identify the variance matrix as where
| (205) |
It should be noted however that the terms are . In order for the asymptotic expansion to be consistent we should include all effects of this order. These are accounted for by reinterpreting as the mean position of a particle that is in the neighbourhood of the minimum rather than the position of the minimum itself. The two positions differ by terms that are . This difference comes about from an approximation to the ground state wave function that goes beyond the quadratic approximation to and includes third order derivatives of in its Taylor expansion. We will encounter examples of this in section 10 and section 11 . With this adjustment the result is indeed intuitively plausible and in this form it can be derived directly from the partition function in the high- limit.
9.3 Area Susceptibility
Evaluating a higher order susceptibility such as the area susceptibility is a more complicated task which we do not pursue here in detail. However, it is of interest to investigate the possibility of a generalisation of the Einstein relation that holds for the linear susceptibility. We follow a line of reasoning for the area susceptibility that is as close as possible to that for the original Einstein relation. The result however is not as useful for reasons we explain. The starting point for the analysis is eq(67) . We continue to work with the electric field case so we have from the right side of eq(67),
where we have used the fact that . It then follows that
| (207) |
Since commutes with the Hamiltonian we see from eq(67) that
| (208) |
and hence that
| (209) |
Eq(67) can now be expressed in the form
| (210) |
That is
| (211) |
where . We have
| (212) |
Eq(212) is sufficient to determine in terms of and . We take the scalar product of each side of eq(211) with
It is simple to see that the left side can be put in the form
| (213) |
where is the area susceptibility tensor. However when we complete the manipulation by forming the appropriate scalar product with the right side of eq(67) we obtain after some tedious algebra two contributions. The first is
and the second is
These expressions are not particularly helpful. We have presented them however in order to underline the point that in this case there is no expression for the area susceptibility that parallels the Einstein relation for the linear susceptibility and involves only the distribution . Instead the two terms above require a knowledge of the complete joint equilibrium distribution . This reduces the usefulness of the relation and means that the only way to approach the numerical evaluation of the area susceptibility is through the full simulation of the slave equations. We show some results later for a specific case in section 11 .
10 One-Dimensional Examples
There are also some general issues that can be addressed particularly easily in one dimension. In a previous paper [5] we examined the the case of a double minimum profile and emphasised the power-law probability distribution acquired by the slave variable at large values. The origin of this phenomenon lies in the existence of regions on -space for which [5, 8, 11, 12].
Such a power-law distribution raises the possibility that even though the mean of exists its variance may diverge together with moments higher than the second. Since we are interested in comparing numerical results with asymptotic calculations at small this phenomenon, which becomes increasingly severe in this limit, affects how we assess the outcome of our simulation calculation. We therefore develop a criterion for predicting the appearance of a diverging variance, in the one dimensional context.
In the limit of large time the resulting static distribution satisfies
| (214) |
The support for lies in with the boundary condition . If we define as
| (215) |
then we know that is convergent for where for is divergent. Since is convergent we know that .
From eq(214) we find
| (216) |
If we set then eq(216) becomes
| (217) |
where
| (218) |
For we can solve for in terms of provided does not have a zero eigenvalue. This will remain true for . The critical value is determined by the condition that has a zero eigenvalue when . There are straightforward numerical techniques such as Sturm sequencing for computing the eigenvalues of . By varying through an appropriate range we can determine the value of that yields a zero eigenvalue. If this critical value is less than two then we are in a situation where the variance of the distribution for is divergent.
We can see directly how a power law distribution for induces a critical value for . Define the probability distribution function so that
| (219) |
Our claim is that for large
| (220) |
for some constant and exponent . If we set
| (221) |
then, assuming the above asymptotic behaviour for we see that
| (222) |
It follows that the critical value at which diverges is . We can use this result to compute and compare with the results of our simulation.
10.1 Double Minimum Profile
The Double Minimum Profile occurs in a model for which
| (223) |
Clearly has minima at the points and . We label them and respectively. A maximum of lies at the origin. We note that , and , . In fact for . It follows that we expect the slave variable to exhibit a power-law probability distribution at large values of .
10.1.1 Critical Moment for Double Minimum
For this model the Hamiltonian in eq(218) becomes
| (224) |
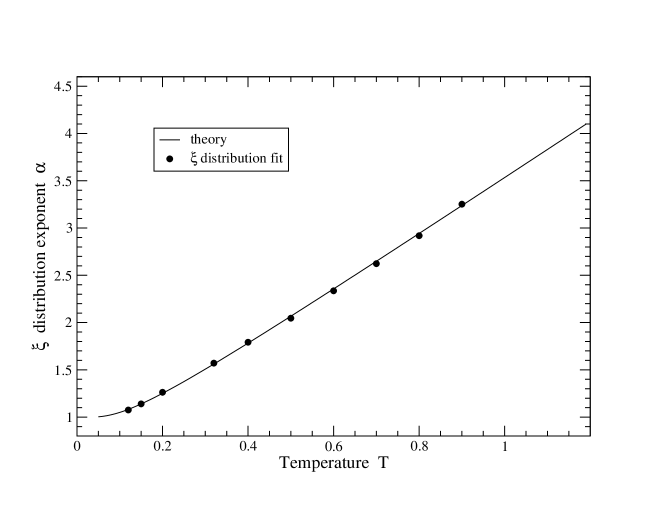
In Fig 1 we show results for the parameter choice . Using a Sturm sequencing technique we determine the values of for which acquires a zero eigenvalue for a range of temperature . For sufficiently large the critical value is greater than 2, thus permitting the variance of to exist. However as the temperature is lowered there is then a critical value below which is less than 2, and and for those values of the variance of diverges. In the present model .
10.1.2 Simulation for Double Minimum
The stochastic differential equations for our choice of parameters become
| (225) |
where , and
| (226) |
Using the numerical integration techniques outlined in section 4, we can obtain from a sample of particles a measurement of as a function of . The case allows us to extract and , the susceptibility, by fitting the asymptotic form in eq(222) to the results of the simulation over an appropriate range of .
The variance of can be evaluated by means of a direct numerical evaluation of the integral
| (227) |
Then using the Einstein relation, , we obtain an evaluation of the the susceptibility. In Fig 2 we show that our simulation results compare well with this evaluation, even down to temperatures well below .
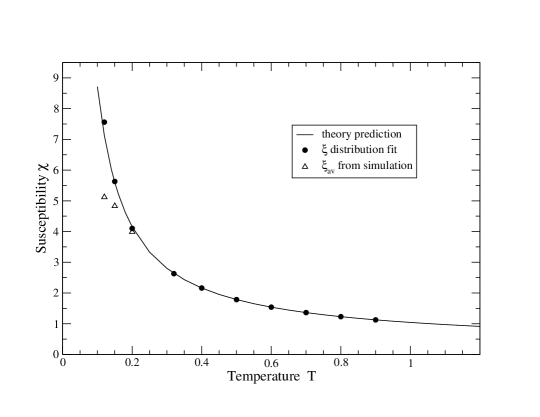
Of course we could extract directly from the simulation data. The results coincide with those obtained by the more elaborate fitting procedure outlined above for sufficiently high values of the temperature. However for a straight average estimate yields results, indicated in Fig 2 by open triangles, that are too low. The elucidation of this inconsistency lies in the manner in which the power law tail of the -distribution is achieved, namely by the appearance of a sequence of large spikes in the evolution of the variable as a function of time in the simulation [5]. These spikes, which are essential for establishing the power law tail of the -distribution, are increasingly prominent and increasingly sparse as the temperature, , is lowered. Achieving an accurate representation of the spikes from the numerical integration of the stochastic differential equations is increasingly difficult as is reduced below requiring as it does, a longer and longer equilibriation time in order to establish the tail of the -distribution. The result is that the distribution is underestimated at large yielding a value for the susceptibility, that is too low. Our results show however that using the fitting procedure described above, it is possible to obtain an estimate of , over a range appropriately restricted at small and large , that is sufficiently accurate to permit the extraction of a good estimate of .

From eq(227) we find immediately the high limit of the susceptibility to be
| (228) |
This coincides with the specialisation of eq(205) to one dimension.
For our choice of parameters
| (229) |
In Fig 3 we show the ratio of the numerical evaluation of to the above asymptotic form as a function of temperature for . It correctly approaches unity at with zero slope. The correction to the asymptotic form is small for . As indicated above it is difficult to perform the stochastic simulation at these low values.
10.1.3 Decay Rate for Double Minimum
We can calculate the low estimate for the decay rate of an asymmetrical initial -distribution using the electromagnetic analogy explained above. This requires a calculation of the resistance between the minima. From eq(148) we find for our model
| (230) |
where the partition function is given by
| (231) |
When is very large we can compute from the dominant contributions coming from the neighbourhoods of the two minima. Both contributions are equal so
| (232) |
We have also
| (233) |
where and
| (234) |
We note that and that
| (235) |
Applying the electrical analogy we see that the voltages at the two minima satisfy the equations
| (236) |
and
| (237) |
where R is given by eq(230) .
| (238) |
It follows that the rate of decay of the voltage difference is proportional to where
| (239) |
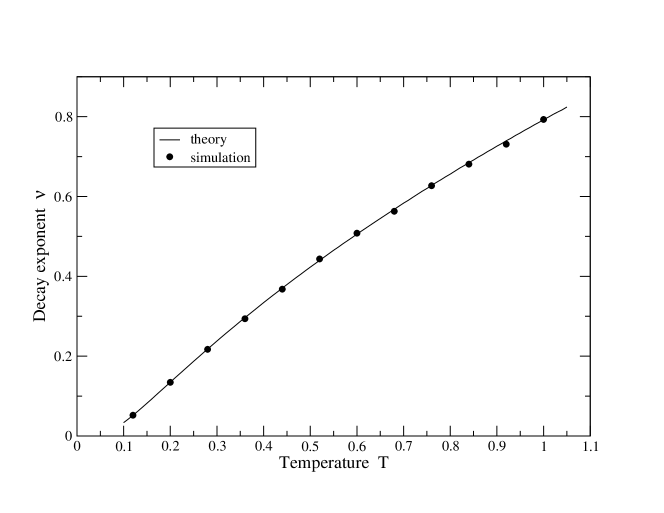
The eigenvalue of the supersymmetric Hamiltonian is of course .
In Fig 4 we show the results of the simulation (for the case ). They compare well with the direct evaluation obtained from the Sturm sequencing evaluation of the lowest non-zero eigenvalue of . For this choice of parameters the asymptotic result becomes
| (240) |
For the temperature range this formula yields results very close to the simulation and numerical evaluation shown in Fig 4.
10.2 Three Minimum Profile
As a matter of interest we work through the theoretical calculations for a more complicated example for which has three minima and two maxima. We choose
| (241) |
The minima are at the points , and the maxima are at . We have the results and , together with .
If we label the minima at by 1 and 2, and the minimum at by 0 then we easily find in the high limit
| (242) |
and
| (243) |
Hence
| (244) |
and therefore and .
The resistance between the origin and each of the other two minima is where
| (245) |
If the voltages at the minima are , and then the electrical analogy tells us that
| (246) |
| (247) |
and
| (248) |
It follows that equations for the eigencombinations are
| (249) |
and
| (250) |
The two decay exponents are then
| (251) |
and
| (252) |
The susceptibility can be computed from eq(205) to be
| (253) |
11 Two-Dimensional Example
We can illustrate some of the results of general theory by means of two-dimensional models.
11.1 Blind Saddle
In [15] Tǎnase-Nicola and Kurchan introduce a simple model that they refer to as a blind saddle. It is constructed as a two-dimensional tilted Mexican hat for which
| (254) |
In this case, for sufficiently small , has one minimum near and , one saddle with Morse index one near and together with a maximum, Morse index two, near the origin. All lines of steepest descent leaving the saddle arrive at the the single minimum. The uniqueness of the minimum means that there is no opportunity to construct states with low non-zero eigenvalues for in the high limit. The interest of the model then, is that in the limit of large there are no eigenstates in with exponentially small eigenvalues. The lowest eigenstates in are all of . However in there is such a low-lying eigenstate which we associate with a magnetic flux loop passing round the circuit created by the lines of steepest descent joining the saddle to the minimum.
To detect this low lying state we must first create it. Subsequently we let it die away and measure the exponential decay of an appropriate observable, namely . This yields the value of the decay exponent.
To create the state we integrate the stochastic differential equation, eq(1) together with the associated slave equation, eq(49) in which is chosen to have a magnetic character. That is
| (255) |
Using the fact that commutes with , we see from eq(59) that the form of in the limit of large time, also has the property that
| (256) |
This guarantees that and therefore corresponds to a state with a loop of flux as described in subsection 8.4 . We can solve eq(59) for by introducing an eigenfunction basis, , for .
| (257) |
If now we continue the simulation by integrating the associated slave equation with set to zero, the subsequent time development of is given by
| (258) |
where th time is measured from the new starting point. Consider the matrix element
| (259) |
It follows that
| (260) |
The long time behaviour of this expectation value is governed by the most slowly varying exponential. By measuring this expectation value in the simulation we can obtain the decay exponent. At this point a limitation of the method is encountered. A careful analysis, not presented here, shows that the scalar product , where the coefficient depends on the form of . The explicit dependence on the eigenvalue removes the potentially enhancing denominator on the right in eq(260) and for reasonable choices of the coefficient is sharply reduced at low temperature. This results in the decoupling of the contribution from the lowest eigenstate as the temperature is lowered making it harder to pick out the relevant term. This barrier to easy simulation at low temperature is a theme running through our calculations and prevents a close comparison with the low temperature asymptotic result as we see below.
In practice we need only a single flow field and we drop reference to the label from now on. We choose and . It is easily checked that . For the purposes of the simulation we set in eq(254). We have therefore
| (261) | |||||
In order not to shift the stationary points very far from we set . These stationary points which lie on the line . On the left we have the saddle at with , , the maximum at with , , and the minimum at with , . Of course at all three stationary points. For future reference we note that at the maximum we have and at the saddle . Hence the difference in heights between maximum and saddle is where
| (262) |
Combining eq(150) and eq(165) we find the asymptotic estimate for the decay index
| (263) |
Using the numbers appropriate to the simulation we have
| (264) |
where . A comparison between the asymptotic formula and the simulation results is shown in Table 1.
Also recorded is our evaluation of the decay index as where is the lowest eigenvalue of in the sector . Because we are in two dimensions this is the lowest eigenvalue of the simple Schrödinger Hamiltonian obtained from by making the replacement . We use the lattice field theory method of reference [23] to evaluate this eigenvalue. We see that this evaluation compares favourably with the outcome of the simulation, particularly at the higher values of temperature. The estimate from the asymptotic formula is less good, though not totally out of line with the other results. Our experience with the one dimensional problem suggests that we would require values of temperature somewhat lower than 0.1 to see agreement with the other methods of evaluation. However as we have indicated above these methods are not easily applied for temperatures in this range. With these provisos we feel that the theory and simulation are in encouraging agreement. It would be interesting to attempt theoretical evaluations of at the higher temperatures based on an approximation scheme that exploits the application of the minimum dissipation principle to appropriately chosen field distributions that are less extreme in form than the very narrow wires and surfaces used in the very low limit.
| 0.4 | 0.8813(5) | 0.884(2) | 0.8760 |
| 0.3 | 0.6449(5) | 0.651(1) | 0.7230 |
| 0.2 | 0.3900(6) | 0.392(1) | 0.4925 |
| 0.18 | 0.3411(5) | 0.3386(7) | 0.4334 |
| 0.16 | 0.283(1) | 0.2835(7) | 0.3693 |
| 0.10 | 0.110(4) | 0.1178(5) | 0.1557 |
| 0.09 | 0.084(3) | 0.0946(5) | 0.1206 |
11.2 Four Minimum Model
Finally we illustrate our methods with a model that has four minima. We choose have the form
| (265) |
where and are the coordinates of the diffusing particle. The relevant derivatives are
| (266) | |||||
The stationary points satisfy
| (267) | |||||
We have then the following stationary points.
-
(1)
A maximum at with , , .
-
(2)
Saddles with Morse index 1 at , with , , and at , with , , .
-
(3)
Four minima at the points and with and and .
For case (3) the discriminant of the Hessian at each minimum is where
| (268) |
We see that these stationary points are indeed minima if since this guarantees that , and are all positive. The eigenvalues of the Hessian matrix are
11.2.1 Decay Indices
We first calculate the decay indices in the high -limit. In this limit the partition function is
| (269) |
To calculate the low lying eigenvalues in this limit we first evaluate the resistances between adjacent minima. In the present model there are two resistances namely, , appropriate to paths of steepest descent passing in the -direction through the saddles at , , and , appropriate to paths passing in the -direction through the saddles at , . Using the result in eq(150) we find
| (270) |
and
| (271) |
For convenience we label the minima with in a clockwise direction starting in the positive quadrant. The symmetry of the model is sufficient to ensure that the capacitances at all four minima are equal. That is . From eq(137) we obtain the equations of current flow as
| (272) | |||||
The three eigenmodes of the form with are
| (273) |
We conclude that the three decay exponents associated with the subspaces and are , and . Note that these results at low imply that . However we do not expect this simple relation to hold for general values of the temperature.
To evaluate these decay exponents for values of above the low temperature limit we performed a simulation by numerically integrating the stochastic equations of motion. Our procedure was to equilibriate the system and then to fold over the resulting configuration by reflecting the position of each particle in appropriate axes so that it ended up in the positive -quadrant, the remaining three quadrants then being empty. We then restarted the evolution of the system and measured the expectation values , and as a function of time. The long time behaviour of each of these three quantities yields respectively the decay exponents , and . In Table 2 we show the results in the case , and for a number of values of and . The case corresponds to a situation in which motion in the and directions are independent. This serves as a check on our procedures since under these circumstances we expect that at all temperatures. Within errors Table2 shows that this is indeed the case. For we expect this outcome only at low temperatures, as indicated above. At the temperatures listed in Table 2 the result does not hold as indeed we anticipated.
| 0.0 | 0.8 | 0.6573(5) | 0.5704(6) | 1.222(5) |
| 0.6 | 0.5065(4) | 0.4626(6) | 0.9632(2) | |
| 0.2 | 0.8 | 0.7598(6) | 0.6612(4) | 1.566(3) |
| 0.6 | 0.5847(3) | 0.5452(3) | 1.239(2) | |
| 0.3 | 0.8 | 0.8000(7) | 0.6985(4) | 1.732(4) |
| 0.6 | 0.6174(3) | 0.5792(4) | 1.373(4) |
General theory tells us that the dimension of the low lying subspace in is equal to the number of saddles. As we have seen three of the basis states are in so a remaining low lying state lies in with a corresponding supersymmetric partner in . In our electromagnetic analogy this state is associated with a loop of magnetic flux (in the present example confined to the two-dimensional surface) that runs through all the minima and surrounds the maximum of at the point .
The loop resistance is given by
| (274) |
From eq(165) we can conclude that the associated decay exponent is
| (275) |
The decay index is associated with the subspaces and . We evaluate it at higher temperatures by using the same procedure mutatis mutandis as for the blind saddle. The results are shown in Table3 . Also shown for comparison is a theoretical evaluation of the index, , obtained using the Schrödinger problem with as was done for the blind saddle. The two sets of results compare reasonably well providing good evidence that the numerical methods work reliably. It is worth noting that for the case we , as expected.
For practical reasons both the simulation and the theoretical Schrödinger calculation of cannot be carried out at a temperature sufficiently low that a comparison with the the asymptotic calculation is possible.
| 0.0 | 0.8 | 1.354(1) | 1.240(2) |
| 0.6 | 0.954(3) | 0.965(2) | |
| 0.2 | 0.8 | 1.313(2) | 1.317(2)) |
| 0.6 | 1.031(1) | 1.039(2)) | |
| 0.3 | 0.8 | 1.354(1) | 1.347(2) |
| 0.6 | 1.068(1) | 1.065(1) |
11.2.2 Susceptibilities
We first calculate the susceptibility at low temperature. From eq(205) we see that there are two types of contribution from each of the minima. The overall mean position of the particle is the origin in this model and the capacity of each minimum is . We obtain from minimum contributions to , and of the form , and where and refer to the position of the minimum modified by terms that are . This modification is computed by setting
| (276) | |||||
| (277) |
We then consider and to be small quantities and evaluate in the neighbourhood of the minimum as
| (278) |
where
| quadratic | (279) | ||||
| cubic | (280) |
If we retain this cubic term in in evaluating the local average of and at minimum we find to
| (281) | |||||
| (282) |
The average positions at the other minima are obtained by applying the same modifying factors.
The second set of contributions from eq(205) are obtained by forming the local averages at minimum of , and keeping only the quadratic approximation for . We find
| (283) | |||||
| (284) | |||||
| (285) |
The the other minima yield identical results except for a sign change in the from minima and . The outcome from adding all the contributions from each of the minima is that vanishes and
| (286) | |||||
| (287) |
We show in Fig 5 this low- asymptotic dependence of the susceptibilities for , and . For the same parameter values we can obtain the susceptibilities from a direct simulation of the stochastic differential equations. Guided by our experience with the one-dimensional problem we extract the results by fitting an appropriate power law form to the measured cumulative distributions for and . The results for the susceptibility in the -direction are exhibited in Fig 5 in comparison with those predicted using the Einstein relation from an evaluation by direct numerical integration of and the asymptotic low results from eq(286).

There is good agreement between the simulation and the direct numerical valuation for temperatures . For lower values of here is difficulty in achieving good simulation results for the same reason as in the one dimensional case, namely that the distributions for and acquire such slowly descending power law tails that the do not have finite variances. However the asymptotic estimate does agree well with the direct numerical evaluation at low values of .
| 0.0 | 0.8 | 2.76(1) | 4.7(3) | 2.88(2) | 1.835750(3) |
| 0.6 | 2.31(1) | 3.8(1) | 2.33(2) | 2.8086(1) | |
| 0.2 | 0.8 | 3.62(3) | 6.2(2) | 3.29(8) | 1.5734(2) |
| 0.6 | 2.99(2) | 4.79(2) | 2.60(1) | 2.38711(6) | |
| 0.3 | 0.8 | 4.07(7) | 6.9(6) | 3.5(1) | 1.47233(2) |
| 0.6 | 3.29(4) | 5.64(9) | 2.72(2) | 2.22607(4) |
In Table 4 we exhibit the results from the simulation for the indices of the power law tails at a number of values for and the temperature . The first point of note is that for the case and at both temperatures, the area index is reasonably coincident with the smaller of the two linear indices namely . The explanation for this lies in the fact that when the variables and evolve independently and the area element is just . In the appendix we show that a product variable such, as , has in general, a power law tail with an index that coincides with the smaller of the two indices involved in the product. Of course when is no longer zero we cannot infer any such simple connection and the results in Table 4 bear this out.
In Table 4 we have included the area susceptibility for the relevant values of and . We found that obtaining a good outcome for the simulation at much lower temperatures rather difficult given the size, already considerable, of the statistical sample. Although we can in principle compute the low limit of the area susceptibility by generalising previous calculations for the linear susceptibility we do not pursue this point here. Since it is not possible to construct an equivalent to the direct numerical evaluation the linear susceptibility through the application of the Einstein relation we cannot carry out a numerical comparison. Nevertheless an exploration of such higher susceptibilities remains an interesting topic of further study.
12 Conclusions
We have studied a stochastic system comprising a particle with degrees of freedom together with associated slave variables that represent infinitesimal line elements carried along by the diffusing system. We refer to the equations satisfied by these slave variables as slave equations. The states of the system are described by a joint probability distribution , which may depend on time and which satisfies an appropriately generalised diffusion equation. Here and are values attained by the stochastic variables and . The slave variables can be used to construct a hierarchy of infinitesimal areas, volumes etc, that evolve either from an initial set of (infinitesimal) displacements of the initial conditions of the stochastic system or through alterations of trajectory induced by external forces. In the former situation we are concerned with decay exponents that describe the return of the system to equilibrium. In the latter we are interested in the (infinitesimal) response of the equilibrium distribution for the system to the presence of external forces. This response can be described by a hierarchy of susceptibilities, linear, area etc. There are exponents associated with these susceptibilities as a result of the fact that the probability distributions of the associated variables have power-law tails. These exponents play a significant role in extracting the values of the susceptibilities from the simulation data.
The state of the system can alternatively be described in terms of appropriately antisymmetrized moments of the slave variables . In turn these moments may be regarded as the wavefunctions in a hierarchy of states that are the basis of a supersymmetric description of the original system. The behaviour of the system is controlled by a supersymmetric Hamiltonian as explained by [15, 16] . The decay exponents characterising the return of the system to equilibrium are, up to a factor of the temperature , the eigenvalues of the supersymmetric Hamiltonian [15, 16, 17]. The susceptibilities are expectation values of antisymmetrized moments of the slave variables and are therefore related in a natural way to the hierarchy of supersymmetric states. This supersymmetric structure is the same as that introduced by Witten[14] and investigated further by Tǎnase-Nicola and Kurchan [15, 16] .
In order to obtain the decay exponents we follow a two pronged approach, theoretical on the one hand and computational on the other. In the theoretical approach we exploit an electromagnetic analogy and formulate a Principle of Minimum Dissipation that provides a natural basis for computing decay exponents. It is particularly effective in the limit of very low temperature. It might also be made the basis, in the style of the Rayleigh-Ritz method, for an approximate numerical computation of exponents at higher temperatures, though we have not pursued this idea here.
The computational approach we use is to some extent dependent on the number of degrees of freedom of the system and for simplicity we restrict our calculations to one and two degrees of freedom although there is no barrier to working with higher dimensional systems. For one dimensional systems we perform a direct numerical integration of the stochastic equations of motion starting with a non-equilibrium distribution of the variable. By measuring the expectation value of an appropriate observable we can observe its ultimately exponential decay with time and measure the decay exponent directly. This works well above a certain temperature. Unfortunately at its lower end this temperature range is just marginally above the range of applicability of the low temperature theoretical results. However in the one dimensional case it is simple to solve the relevant supersymmetric eigenvalue problem directly by the method of Sturm sequencing. This produces accurate results over a temperature range that covers both the low temperature asymptotic range and the higher simulation range. We obtain good consistency in both cases. This confirms the efficacy of the numerical simulation the correctness of the low temperature evaluation.
For systems with two degrees of freedom we again carry out a simulation by integrating the stochastic differential equations including the slave equations. Again by measuring the expectation values of appropriate variables we can measure the exponential decay that yields the low lying eigenvalues of the supersymmetric Hamiltonian. It should be noted however that in order to obtain the full complement of these low lying eigenvalues it is necessary to include slave variables that respond to behaviour in the higher fermion sector . This is particularly true for the case of the blind saddle [15, 16] where the only low lying eigenvalue of the supersymmetric Hamiltonian is in this sector. For this model and the four minimum model it is not easy to compare directly with the low temperature asymptotic calculations. However qualitatively the results are not bad. By exploiting lattice field theory techniques [23] we were able to compute the eigenvalue appropriate to the subspace which because of the supersymmetry inherent in the problem is the same as the eigenvalue for the subspace. This yielded results consistent with the numerical simulation.
In studying susceptibilities we again use two approaches one theoretical covering low temperatures, the other numerical applicable at higher temperatures. The theoretical calculation is exhibited in subsection 9.2. It shows that at low temperatures the linear susceptibility has two contributions, one associated with the positions and occupation of the neighbourhoods of the various minima and the other associated with a sum over the intrinsic susceptibilities of each of the minima. The numerical approach involves integrating the stochastic equations including the slave equations. After equilibriation we can in principle compute the mean value of directly from a sample of results obtained by continuing the integration procedure. At sufficiently high temperatures this works well. However at lower temperatures, as explained in [5] and subsection 10, the probability distribution for the slave variable, , which has a power-law tail at high values of . At sufficiently low temperatures the exponent of this power is so small that it prevents the slave variable having a variance. This makes the estimation of the average from the simulation impossible. However we were able to obtain good results by compiling a running average, which does have a variance, and by fitting the appropriate asymptotic form to the output from the numerical simulation. We were able, for the one dimensional case, to formulate a method for computing the exponent and hence deduce the critical temperature below which the variance diverges. This amounts to constructing a modified Hamiltonian , associated with the moment and then adjusting the value of until acquires a zero eigenvalue. This procedure is easily carried out numerically. In two dimensions we obtained similar results but without a method of establishing the critical temperature theoretically. This emphasises the importance of the simulations approach for more complicated dynamical systems. It is also possible to compute the linear susceptibility in any number of dimensions by computing directly the variance of the position variables by using the Einstein relation (see section 9). We obtained good agreement between the different numerical approaches and where relevant with the theoretical calculation. In two dimensions it is possible to compute an area susceptibility. We were able to obtain numerical results at sufficiently high temperatures from the numerical simulation. However we were not able to establish a useful version of the Einstein relation in this case in order to provide a check. Further work is also needed to investigate the theoretical results for the low temperature limit.
A question of interest is how the various susceptibilities might be measured. In a simulation there is no difficulty since the various relevant quantities can be computed in a direct manner by integrating the stochastic differential equation. In fact a measurement of the various correlators and decay exponents and their inter-relationships provides a useful means of establishing the consistency of the simulation and aids detective work on the structure of the landscape potential function. The experimental measurement of the standard susceptibility is, conceptually at least, also straightforward. One is looking at the response of the mean displacement to an external field. An experimental measurement of higher order susceptibilities remains for the moment elusive. However an example, in a different context, in which higher order elements, tetrads in fact, play a significant role is in the computation of the magnetic -effect for magnetic field generation [7]. Finally it is worth pointing out that elucidating the structure and evaluating the spectrum of supersymmetric quantum mechanical systems is an intrinsically interesting and important goal.
Appendix
We analyse here by means of a simple example the asymptotic property of the distribution of a variable that is the product of two independently distributed variables and . Because we are concerned with distributions on the range that exhibit power law behaviour for large values of the variables we choose as the distributions and where
| (288) | |||||
| (289) |
The distribution for is
| (290) |
The Mellin transform of is
| (291) |
and the inverse relation is
| (292) |
and similarly for the other distributions. The -integration is along a contour in the imaginary direction with a real part appropriately positioned. By splitting the -integration range into and we find explicitly
| (293) |
The pole at arises from the behaviour as . The -contour passes between this pole and that at which controls the behaviour at small . Similarly has a pole at .
It is easily seen that
| (294) |
Therefore has poles at and . If then the large asymptotic behaviour will be controlled by the rightmost pole at . That is
| (295) |
for large . The only change to this result arises when . In this case has a double pole at and the dominant behaviour at large becomes
| (296) |
Of course if then it is probably more useful to include both asymptotic contributions. However the basic result is that the distribution for has the same inverse power behaviour as that of the most slowly decreasing of the two distributions.
References
- [1] D. J. Wales. Energy landscapes. Cambridge University Press, 2003.
- [2] G. Parisi and Wu Yongshi. Sci. Sin., 24:483, 1981.
- [3] I. T. Drummond, S. Duane, and R. R. Horgan. Nucl. Phys. B, 280:25, 1987.
- [4] S. M. Catterall, I. T. Drummond, and R. R. Horgan. Phys. Lett., 254:177, 1991.
- [5] D. S. Dean et al. Phys Rev E, 70:011101, 2004.
- [6] H. K. Moffatt. Magnetic field generation in electrically conducting fluids. Cambridge University Press, 1979.
- [7] I. T. Drummond and R. R. Horgan. J. Fluid Mech., 163:425, 1986.
- [8] S. B. Pope, P. K. Yeung, and S. S. Girimaji. Phys. Fluids A, 1:2010, 1989.
- [9] I. T. Drummond and W. Münch. J. Fluid Mech., 215:45, 1990.
- [10] I. T. Drummond and W. Münch. J. Fluid Mech., 225:529, 1991.
- [11] I. T. Drummond. J. Fluid Mech., 252:479, 1993.
- [12] A. Schkochihin, S. Cowley, and J. Maron. Phys. Rev. E, 65:016305, 2001.
- [13] G. Junker. Supersymmetric methods in quantum and statistical physics. Springer Verlag, Berlin, 1996.
- [14] E. Witten. J. Diff. Geom., 17:661–692, 1982.
- [15] S. Tǎnase-Nicola and J.Kurchan. J. Stat. Phys., 116:1201–1245, 2004.
- [16] S. Tǎnase-Nicola and J.Kurchan. Phys. Rev. Lett., 91:188301–1, 2003.
- [17] R. Graham. Europhysics Letters, 5:101–106, 1988.
- [18] S. Tǎnase-Nicola and J.Kurchan. J. Phys. A: Math. Gen., 36:10299–10324, 2003.
- [19] H. Nicolai. Phys. Lett., 89B:341–346, 1980.
- [20] H. Nicolai. Nucl. Phys., B176:419–428, 1980.
- [21] F. H. London. Proc Roy Soc., A149:71, 1935.
- [22] P. G. de Gennes. Superconductivity of metals and alloys. Addison-Wesley, 1989.
- [23] S. M. Catterall, I. T. Drummond, and R. R. Horgan. J. Phys. A: Math. Gen., 24:481, 1991.