The platinum nuclei: concealed configuration mixing and shape coexistence
Abstract
The role of configuration mixing in the Pt region is investigated. For this chain of isotopes, the nature of the ground state changes smoothly, being spherical around mass and and deformed around the mid-shell region. This has a dramatic effect on the systematics of the energy spectra as compared to the systematics in the Pb and Hg nuclei. Interacting Boson Model with configuration mixing calculations are presented for gyromagnetic factors, -decay hindrance factors, and isotope shifts. The necessity of incorporating intruder configurations to obtain an accurate description of the latter properties becomes evident.
pacs:
21.10.-k, 21.60.-n, 21.60.Fw.I Introduction
By now, shape coexistence has been observed in many mass regions throughout the nuclear chart and turns out to be realized in more nuclei than anticipated a few decades ago heyde11 . Shell-model caurier05 and mean-field bender03 approaches have shown that shape coexistence arises naturally, in the first case through inclusion of many-particle, many-hole excitations across closed shells and in the latter case through constraints on the quadrupole moment in Hartree Fock (HF) and Hartree-Fock-Bogoliubov (HFB) studies grahn08 ; duguet03 ; smirnova03 ; bender04 ; rodri10 ; nomura11 . A particularly well-documented example of shape coexistence is the Pb region. From the closed neutron shell () to the very neutron-deficient nuclei, approaching and even going beyond the mid-shell, ample experimental evidence for shape coexisting bands has been accumulated for the Pb () and Hg () nuclei jul01 ; hey83 ; wood92 . Recent experiments have extended our knowledge of the excitation energies in intruding bands rahkila10 , lifetime data grahn06 ; grahn08 ; grahn09a ; grahn09 ; scheck10 , nuclear charge radii dewitte07 ; cocio11 , 2 gyromagnetic factors stuchbery96 ; bian07 , and -decay hindrance factors wauters94 ; wauters94a ; duppen00 .
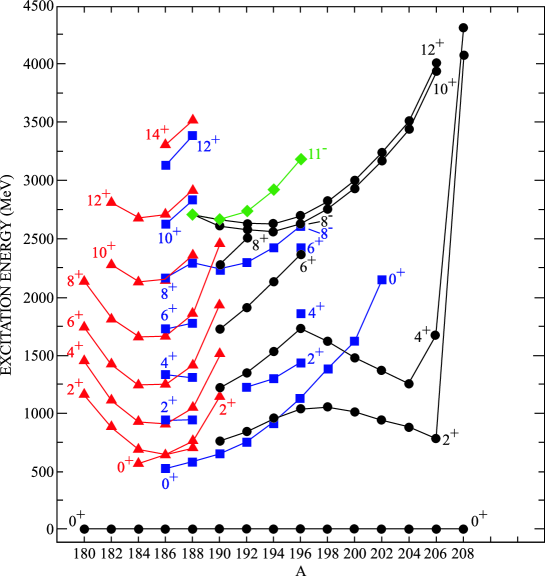
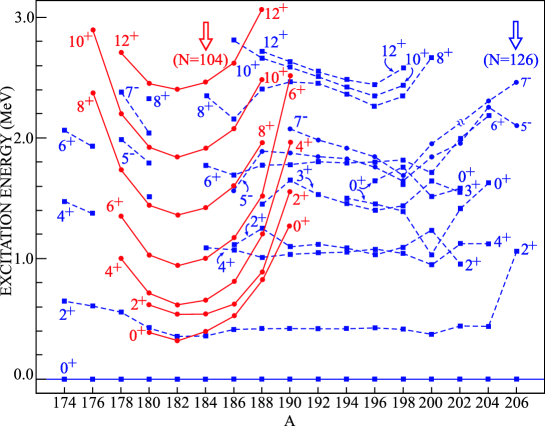
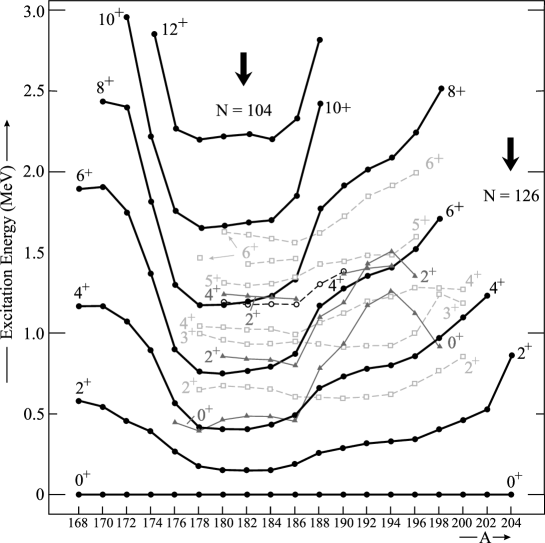
An important question is how these shape coexisting structures will evolve when one moves further away from the and closed shells. Recently, a lot of new results have become available for the even-even Po, Hg and Pt nuclei, for which experimental information was highly needed. It is informative to compare the systematics of the low-lying states of the proton closed shell Pb nuclei (Fig. 1), the Hg nuclei (Fig. 2), and the Pt nuclei (Fig. 3). The data to construct these figures have been taken from the relevant Nuclear Data Sheets, from rahkila10 (for the Pb nuclei), from sand09 ; bree10 ; huyse10 ; scheck10 ; scheck11 (for the Hg nuclei), and cutcham05 ; williams06 ; joss06 ; oktem07 ; cutcham08 ; gomez09 ; ilie10 (for the Pt nuclei). Whereas the intruder bands are easily singled out for the Pb and Hg nuclei and the excitation energies display the characteristic parabolic pattern with minimal excitation energy around the neutron mid-shell nucleus, this structure seems lost for the Pt nuclei. Focussing on the systematics of the energy spectra in these Pt nuclei as a function of the neutron number, one observes a rather sudden drop in the excitation energy of the 0, 4, 2 and 6 states between () and (), followed by a particularly flat behaviour as a function of until the energies of those states start to move up again around neutron number ().
As the Pb nuclei, the Pt nuclei have been studied within the framework of the Interacting Boson Model (IBM) iach87 . Taking into account the presence of proton 2p-2h excitations across the proton closed shell duval82 , one achieves an overall good description of both energy spectra, radii, and g-factors harder97 ; king98 . In addition, IBM calculations that do not explicitly take into account the proton intruder configurations have also been carried out cutcham05 ; cutcham05a ; cutcham08 , resulting in a satisfactory description of excitation energies and transition rates. In a previous paper García-Ramos and Heyde (2009), we studied the Pt nuclei extensively and carried out a detailed comparison between calculations that include proton 2p-2h excitations (hence, in the model space , where denotes the total number of bosons, irrespective of their charge character) with calculations that consider the smaller model space of the configurations only. It turned out that the results for the energy spectra and absolute values were very similar up to an excitation energy of 1.5 MeV, even though the corresponding wave functions have to be very different in some cases. As such, it was concluded that these similarities point towards a picture where the configuration mixing and the larger model space are somehow “concealed”.
This very same observation has been put forward a long time ago by Cohen, Lawson and Soper cohen66 ; law67 ; law80 when addressing the question “How can the results using a large model space, be very similar to the ones resulting from a truncated model space”. Starting from a model space of two degenerate and single-particle neutron orbitals (containing a neutron number ranging from 4 to 12) and a given two-body interaction, a Yukawa potential, they constructed a set of theoretical nuclei which were called the Pseudonium nuclei 40-48Ps. Interpreting the Ps energy spectra as pseudo-data, they consequently showed that these spectra could be well reproduced within the much more restricted model space of the orbital only, now containing between 0 and 8 neutrons. Indeed, the effective interaction matrix elements adjusted to the spectrum of the Ps nuclei corresponded to quite a different interaction than those in case of the larger model space. Moreover, they showed that other observables, such as the values for the strongest transitions, were very similar in both approaches, even though the wave functions differed distinctly. A different set of Pseudonium nuclei was constructed for a model space of two degenerate and single-particle states that could contain both protons and neutrons, up to a maximum of 12 nucleons. Very much the same conclusion was reached after the analysis of the resulting spectra within a restricted model space of the orbital only law67 . In the latter study, it was pointed out that quadrupole moments seemed to be a better observable to probe differences. Certain particularly chosen transfer reactions were highly sensitive to the choice of the model space. This demonstrates that a number of observables such as excitation energies and -values are rather insensitive to configuration mixing arising from the excitation of zero-coupled pairs across the closed shell. The same underlying mechanism may be responsible for the similarities between the results for the Pt-isotopes obtained within the configuration space of the IBM and those obtained for the configuration space. In addition to the detailed comparison in García-Ramos and Heyde (2009), we have constructed pseudo spectra in the IBM within a configuration space and consequently adjusted the parameters of an IBM Hamiltonian within the configuration space Garc-unp . Apart from very particular transition rates, it was impossible to discriminate between the results of the two approaches.
In a more recent example, a study of the actual wave function content and the way to test it has been explored in the study of the nucleus 40Ca caurier07 . It turns out that the ground state consists of only 65% closed sd shell (or 0p-0h) and exhibits 29% 2p-2h excitations out of the normally filled orbitals into the , , , higher-lying orbitals with even a 5% 4p-4h excitation contribution. This large model space is needed to describe the higher-lying strongly deformed bands and superdeformation as experimentally observed in 40Ca. The isotopic shifts in the even-even to Ca nuclei could be reproduced well through explicit inclusion of mp-nh excitations across the , ”closed” shell in a slightly smaller model space than the one mentioned before caurier01 . This indicates that one can indeed find observables which are sensitive to the important components of the wave function and thus can discriminate between various approaches that give quite similar results when restricting to a subset of data only.
The content of this paper is organised as follows. After Section I, we present the IBM formalism in Section II.1, the evolution of the character of low-lying states in II.2, the systematics of the energy spectra in II.3, and the decomposition of the values into regular and intruder contributions in II.4. In Section III we explain the origin of the observed flat energy tendencies around neutron mid-shell on the basis of the crossing of the regular and intruder unperturbed states. Section IV is devoted to the study of observables sensitive to the presence of 2p-2h configuration such as gyromagnetic factors, IV.1, -decay hindrance factors, IV.2, and nuclear radii, IV.3. Finally, in Section V we present the summary and the conclusions of this work.
II Configuration mixing and the observation of regular patterns
II.1 The formalism
In this section, we present an abridged introduction to the IBM configuration mixing formalism (or IBM-CM) and to the fitting-procedure of the IBM-CM parameters for the Pt isotopes. For an in-depth discussion, we refer to García-Ramos and Heyde (2009). The IBM-CM allows the simultaneous treatment and mixing of several boson configurations which correspond to different particle–hole (p–h) shell-model excitations duval82 . On the basis of intruder spin symmetry hey92 ; coster96 , no distinction is made between particle- and hole-bosons. Hence, the model space including the valence neutrons outside the shell as well as the regular 4h and 6h-2p proton configurations with respect to the shell corresponds to a boson space. The boson number is obtained as the sum of the number of active protons (counting both proton particles and holes) and the number of valence neutrons, divided by two. Thus, the Hamiltonian for two configuration mixing is written
| (1) |
where and are projection operators onto the and the boson spaces respectively, describes the mixing between the and the boson subspaces, and
| (2) |
is the extended consistent-Q Hamiltonian (ECQF) warner83 with , the boson number operator,
| (3) |
the angular momentum operator, and
| (4) |
the quadrupole operator. We did not consider the most general IBM Hamiltonian for each Hilbert space, and , but restricted ourselves to the ECQF formalism Hamiltonian warner83 ; lipas85 . This approach has been shown to be a rather good approximation in many calculations.
The parameter can be associated with the energy needed to excite two particles across the shell gap, corrected for the pairing interaction energy gain and including monopole effects hey85 ; hey87 . The operator describes the mixing between the and the configurations and is defined as
| (5) |
The transition operator for two-configuration mixing is subsequently defined as
| (6) |
where the () are the effective boson charges and is the quadrupole operator defined in equation (4).
In our fitting procedure, we focussed on obtaining the best possible agreement with the experimental data available for the excitation energies and for the reduced transition probabilities. In the most general case 13 parameters need to be determined for the IBM-CM Hamiltonian (1) and the operator (6). To obtain parameters that vary smoothly from isotope to isotope, we imposed some constraints. For the regular Hamiltonian, we chose , while we fixed the relative d-boson energy to for the intruder Hamiltonian, the latter choice also supported by harder97 . These choices were made following a number of test calculations in which no substantial improvement in the value of was obtained if we allowed or . In addition, we kept the value that describes the energy needed to create an extra particle-hole pair (or extra bosons) at keV (note the typo =1400 keV in García-Ramos and Heyde (2009); all calculations were performed with the correct value, though). Similarly, the mixing strengths were chosen keV for all the Pt isotopes. Those values are known to be quite appropriate in this part of the nuclear chart harder97 ; king98 , although the choice of the mixing strength remains somewhat arbitrary harder97 . Finally, we also have to determine the effective charges of the operator for each isotope. With these choices, the number of parameters still to be determined for each nucleus is 8.
The parameters for the IBM-CM Hamiltonian resulting from the fitting procedure are summarised in Table 1 García-Ramos and Heyde (2009). Note that some of the Hamiltonian parameters, especially for 172Pt and 174Pt, remain rather arbitrary due to the lack of experimental data. For 172Pt and 174Pt, the value of the effective charges cannot be determined because not a single absolute value is known. Similarly, for 182Pt, the absolute value of the effective charges could not be determined because only relative values are known. As a consequence, those charges are dimensionless.
| Nucleus | ||||||||
|---|---|---|---|---|---|---|---|---|
| 172Pt | 725.0 | 0.00 | -39.47 | 0.00 | -22.87 | -0.38 | - | - |
| 174Pt | 701.2 | 0.00 | -31.60 | 0.00 | -21.82 | -0.30 | - | - |
| 176Pt | 683.4 | 1.04 | -37.62 | 5.24 | -23.56 | -0.75 | 1.86 | 1.63 |
| 178Pt | 753.8 | -2.31 | -37.45 | 5.27 | -25.17 | -0.55 | 3.21 | 1.52 |
| 180Pt | 999.3 | -15.14 | -37.34 | 6.57 | -25.14 | -0.32 | 1.29 | 1.94 |
| 182Pt | 939.9 | -6.70 | -35.39 | 7.03 | -23.50 | -0.31 | 1 | 1.1 |
| 184Pt | 750.6 | 1.47 | -32.66 | 6.64 | -23.89 | -0.34 | 1.14 | 1.71 |
| 186Pt | 675.3 | 3.17 | -30.50 | 7.29 | -24.23 | -0.32 | 1.44 | 1.67 |
| 188Pt | 483.2 | 4.94 | -37.38 | 6.67 | -31.47 | -0.11 | 1.66 | 1.66 |
| 190Pt | 338.7 | 19.33 | -34.62 | 0.83 | -32.51 | 0.00 | 1.50 | 1.50 |
| 192Pt | 314.9 | 12.01 | -45.32 | -8.82 | -38.84 | 0.00 | 1.68 | 1.77 |
| 194Pt | 370.9 | 6.67 | -38.26 | 6.52 | -31.02 | 0.00 | 1.97 | 0.25 |
II.2 The evolution of the character of the yrast band
We start our analysis with the structure of the configuration mixed wave functions along the yrast levels, expressed as a function of the and basis states,
| (7) | |||||
where , , and are rank numbers.
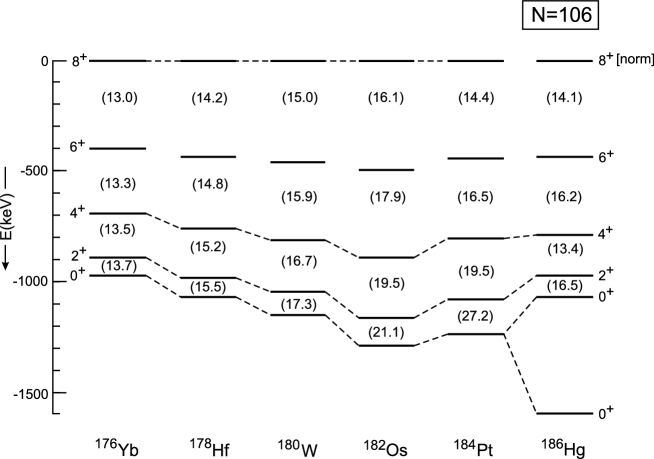
In Fig. 4, we present the weight of the wave function contained within the -boson subspace, defined as the sum of the squared amplitudes , for the yrast states and the 0 state, which is indicated with a dashed line. The results exhibit an interesting behaviour, both as a function of angular momentum and as a function of changing mass number. Indeed, the character of the yrast band changes with increasing neutron number, passing from being spherical (major component in the space) at mass number A 172 towards more deformed (major component in the model space) close to mid-shell, and changing again to a spherical character when approaching A192. This behaviour is very pronounced for the yrast 0, 2, 4 states but changes for the higher spin states and in particular for the state, which retains its intruder character along the whole region (except for 194Pt which is regular). This makes the state the ideal reference state to redraw the energy spectra of the Pt nuclei and study their evolution wood81 ; wood82 . Similarly scaled energy spectra can be obtained for other nuclei exhibiting this systematic behaviour. Hence, rescaling the energy spectra of the adjacent isotones with neutron number (with for 184Pt) gives a most interesting illustration that reveals the mixing effects in the ground-state and lower-spin yrast states (see Fig. 5). It shows that the energy of the 0+ ground state and some of the lower-spin yrast states relative to a higher-lying, more pure, reference state is particularly sensitive to the configuration space wave function components. This is studied in more detail in Sec. IV. It is also clear that the yrast band in 184Pt shows a very strong correspondence with the intruder band structure in 186Hg.
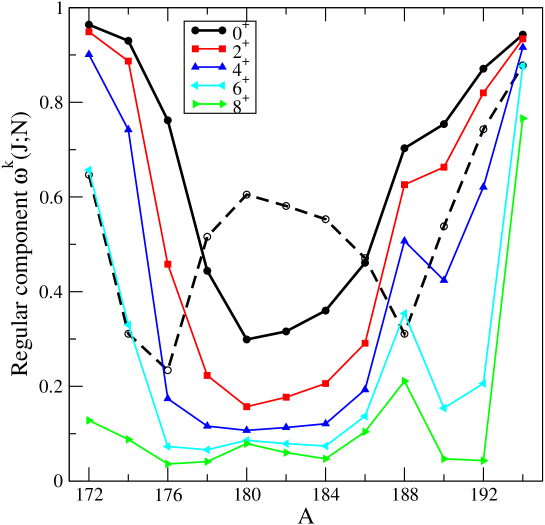
Going back to Fig. 4, where we also plotted the regular component of the state, one clearly notices its complementary behaviour compared to the state. This has an important consequence on the study of the hindrance factor for decay from the Hg ground state into the 0 states in the Pt nuclei, as will be discussed in Section IV.2.
II.3 Energy spectra
Having discussed the wave function content in terms of the and configurations in the previous section, as a next step we study the configuration mixed energy spectra in more detail. Especially the energies up to E 1.5 MeV are of interest because the extra states coming from the intruder configuration do not show up in an obvious way (in contrast to, e.g. the Pb and Hg nuclei in Fig. 1 and Fig. 2, respectively). Therefore, we diagonalize the Hamiltonian (1) without the mixing term in the separate model spaces and . This results in the wave functions
| (8) |
(and similarly for ) with corresponding energies E(k,J[N]) and E(l,J[N+2]). This method has been described in detail fossion03 ; helle05 ; helle08 and results in “so-called” unperturbed bands that are an intermediate step before obtaining the full, configuration-mixed, wave functions and their corresponding excitation energies. These bands are the equivalent of the unperturbed bands extracted from phenomenological band mixing studies that have been carried out in this mass region dracou04 ; page03 . The introduction of the coupling term leads to a mixing of these unperturbed bands. The intermediate basis of a set of unperturbed “bands” is particularly useful to detect the effects caused by the remaining mixing term and its influence on the final energy spectra.
In the next figures, we illustrate these various steps highlighting the way in which the energy spectra result. We consider, as examples, the nuclei 174Pt, 180Pt, 186Pt, and 192Pt which are positioned around neutron mid-shell . Starting with 174Pt (), we present the unperturbed bands resulting from diagonalizing in the space (called “Regular”) and in the space (called “2p-2h”) on the left-hand side of Fig. 6. The lowest unperturbed regular bands correspond to the less collective structure whereas the higher-lying unperturbed 2p-2h bands have a rotational-like structure, including bands that resemble excited Kπ=2+ and Kπ=0+ bands. The inclusion of the mixing then leads to the energy spectra (called CM for “configuration mixed”) at the right-hand side of the figure. On each of the levels, the weight (see Section II.2 for its definition) of the regular part of the model space is displayed. This nicely illustrates the gradual degrading of the percentage when going up the yrast band (see also Fig. 4). It also explains why the 2p-2h intruder band is not clearly separated from the regular band structure: the mixing induces a particular redistribution of the energy levels such that lowest band members originating from the unperturbed 2p-2h configuration end up in different final sets of states. We stress that the bands were constructed as sequences of levels connected through large reduced transition probabilities. We also mention that only the lowest 3 bands are shown in the CM spectrum as we focus on those bands which appear mostly below 1.5 MeV. Finally, it is clear that the CM spectrum strongly resembles that of the regular configuration even though the energies are more compressed. Evidently, the wave functions are largely different in both cases.

In Fig. 7, we illustrate the situation for 180Pt (), which is situated close to neutron mid-shell . Here, one clearly notices two things as compared with 174Pt: (i) the inversion of the energies of lowest 2p-2p unperturbed bands with the regular unperturbed bands, and (ii) the change in structure of the regular unperturbed bands. When comparing with the CM spectrum, one notices that the yrast band has its main components within the model space, becoming gradually pure with increasing angular momentum. The even angular momentum states in the two excited bands in the CM spectrum retain mostly a character but with a much larger contribution from the components as compared to the yrast band. In fact, they result mostly from strong mixing between the lowest unperturbed regular band and the two excited unperturbed 2p-2h bands. In 186Pt (, see Fig. 8), the unperturbed bands are almost degenerate. This is reflected in the composition of the wave functions, in particular for the lower spin states where strongly mixed configurations result. For both 180Pt and 186Pt, the strong mixing of the unperturbed bands conceals the presence of the two different configurations for the bands in the CM spectrum starting off well below 1.5 MeV.


For comparison, we also present in Fig. 9)the results for 192Pt (), a nucleus well past the neutron mid-shell . In this case, the 2p-2h unperturbed bands have moved up considerably compared to the regular bands which exhibit a clear O(6) structure in this mass region. Even though the unperturbed regular and 2p-2h bands seem well separated at first sight, the states above the level remain quite mixed in the spectrum resulting after configuration mixing.

As a conclusion to this part of our study, in which we investigated the unperturbed bands (regular and 2p-2h) and subsequently added the mixing interaction, we state that a very strong mixing of the bands for the Pt nuclei close to neutron mid-shell makes it virtually impossible to distinguish between the regular and 2p-2h configurations. Because of the strong mixing in the Pt nuclei, in particular in the mid-shell region, (i) it is hard to distinguish the precise nature of a band by just observing the energy systematics, and, (ii) remarkably, the energy spectra resulting from the IBM-CM calculation, below 1.5 MeV, resemble spectra that can be described with an IBM Hamiltonian in the space.
II.4 Electric quadrupole transitions
More detailed information on the admixture of the wave functions can be obtained from the transition matrix elements. Whereas the wave functions in eq. (7) are expressed using the and basis states, we can equally well express them using the eigenfunctions corresponding with the unperturbed regular and intruder bands, as given in eq. (8). Under this basis transformation, the transition matrix elements are decomposed into corresponding transition matrix elements within the unperturbed bands each having a certain weight factor. This allows to filter out those transitions in the unperturbed bands that contribute most to a certain transition in the fully configuration mixed bands and provides additional information on the admixture in the wave function.
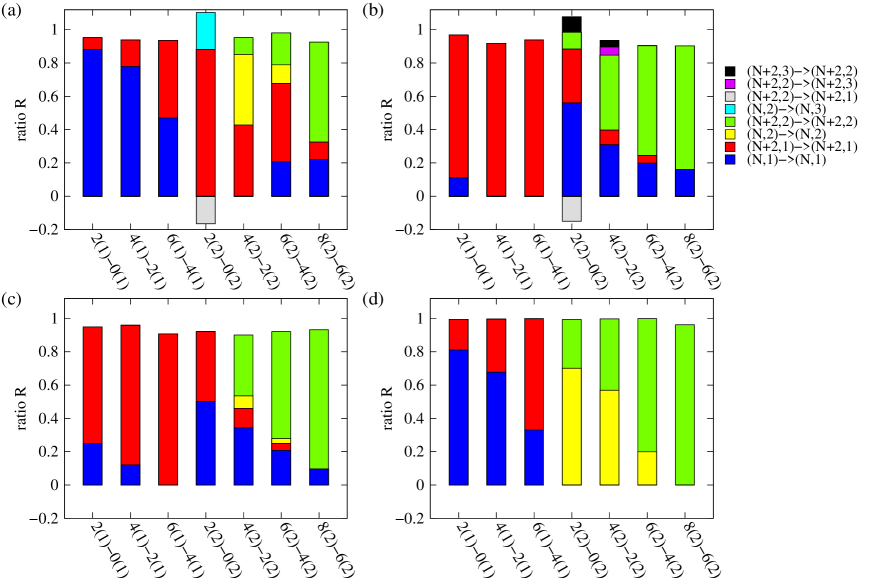
In Fig. 10, we present the ratio for (a) 174Pt, (b) 180Pt, (c) 186Pt, and (d) 192Pt. This quantity is defined as the ratio of a contributing reduced transition matrix element of the transition in the unperturbed regular band (and similar for N+2) times its weight factor, with respect to the reduced transition matrix element of the corresponding transition in the fully configuration-mixed system it contributes to ( being rank numbers). We have plotted the most important contributions (ratios), such that, when adding them, we arrive to within 10% of the full matrix element. The inset legend in Fig. 10 gives the specific contributions in the unperturbed band. For example, in blue , the contributing ratio
| (9) |
with the weight factor (see helle05 ; helle08 for the detailed expression), is shown (the same can be defined for ). The effective charges used for these decompositions are taken from Table 1, except for 174Pt where arbitrary charges have been used.
Inspecting the transitions in the yrast band (i.e. , , and ), we observe a pattern to be expected from the discussion of the energy spectra in Sect. II.3. Whereas, the largest contributions are coming from the unperturbed regular yrast band for 174Pt and 192Pt, with an increasing contribution from the unperturbed intruder yrast band when going to higher spin, the transitions in the yrast band of 180Pt and 186Pt are almost entirely determined by the contribution of transition in the unperturbed 2p-2h yrast band.
The transitions in the first excited band are more interesting. Starting with 192Pt, we notice that those transitions are dominated by the corresponding transitions in the first excited unperturbed regular and 2p-2h band. Though this may seem surprising at first sight from inspection of the spectrum, one should keep in mind that the intruder part of the Hamiltonian is very close to the case of symmetry and that selection rules for the transitions will apply. For the other nuclei, the decomposition of the matrix elements looks more complicated. For 180Pt and 186Pt (excluding the transition for the moment), the relatively largest contribution is coming from the transitions in the first excited unperturbed intruder band, followed by contributions from transitions in the unperturbed yrast regular band and some smaller contributions. Indeed, the strong lowering of the unperturbed intruder bands around neutron mid-shell and the typical spreading of the energies in the unperturbed bands brings the and states of the unperturbed regular yrast band and of the unperturbed first excited 2p-2h band pretty close in energy. Even though one would also expect a non-negligible contribution from the transitions involving the second excited unperturbed 2p-2h band from comparison of the unperturbed energies, they do not or barely contribute. In 174Pt, finally, the unperturbed 2p-2h bands have moved up in energy again and the transitions in the first excited band of the CM spectrum contain contributions from both yrast and first excited unperturbed regular and 2p-2h band, indicating a wider ’spreading’ of the wave function. Finally, note that the transition, being an inter-band transition, often has a structure that slightly differs from the rest of the second excited band. Hence, we may state that the decomposition of the E2-transition matrix elements gives some more insight into the precise ’spreading’ of the wave function in the basis of the unperturbed states. The relative purity of the ratios within the yrast band also hints at the possibility to describe those transitions in a reduced [N] space. From inspection of the more complex structure of the ratios in the first excited band and especially for the interband transition, one would expect differences between calculations with different model spaces to show up.
III Effect of configuration mixing on the systematics of energy levels
In this section, we concentrate on how the strong mixing effects discussed in Sect. II.2-II.4 give rise to the characteristic energy systematics of the even-even Pt nuclei.
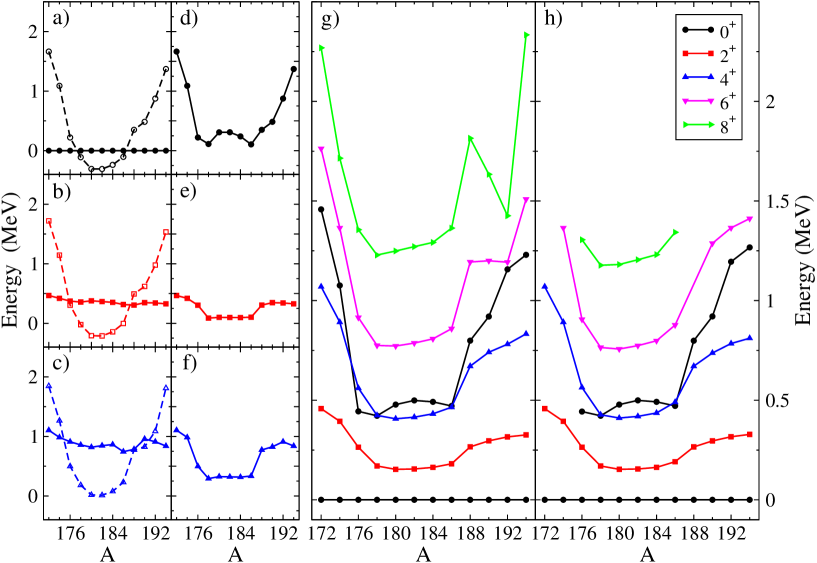
In panels a), b), and c) of Fig. 11, we plot the energy systematics of respectively the unperturbed , , and states. The energies are plotted relative to the energy of the unperturbed regular state, which enhances the parabolic behaviour of the energy intruder band. To compare those unperturbed energies to the final spectrum, we should plot them relative to the energy of the state that is lowest in energy. The unperturbed energies of the , , and states with respect to the energy of the state are plotted in panels d), e), and f), respectively. We observe a very striking tendency due to the crossing of the and states. The evolution of state is mexican hat shaped whereas the and states exhibit an almost flat behaviour around mid shell. This characteristic behaviour is exclusively due to the crossing of and states. Upon inclusion of the mixing interaction, it is clear that the mixing effect will be maximal near the crossing at mass number and , in particular for the states and likewise for the higher angular momentum states. It is the interplay of the crossing with subsequent mixing for the 0+ states that largely determines the final behaviour of the energy systematics. The resulting spectra up to spin 8+ are shown in panel g) and still clearly display the very specific pattern of the 0 and 4 states after the mixing. When comparing those same states with the experimental systematics (see panel h), a clear-cut correspondence shows up.
Therefore, we can conclude that the crossing of the set of unperturbed regular and intruder bands is of major importance to describe the energy systematics as observed in the Pt nuclei, even though the configuration mixing effects are highly concealed in the energy levels and values of a given nucleus.
IV Study of observables sensitive to configuration mixing
Following from our discussion in the previous sections, it should be clear that nuclear structure effects caused by the strongly changing character of the wave function in the and space are to be expected for a number of variables. Indeed, observables such as charge radii, gyromagnetic factors, and -decay hindrance factors are sensitive to an increased number of active protons (generated through particle-hole pair excitations across the closed shell), or to a change towards more explicit prolate deformation near neutron mid-shell . Therefore, we will focus on these experimental quantities as they allow to probe precisely those components of the nuclear wave functions.
IV.1 Gyromagnetic factors
A, for our purpose, particularly interesting set of data are the g-factor measurements for the state in the mid-shell 184,186,188Pt nuclei stuchbery96 . The data display a rather flat behaviour as a function of the neutron number in the vicinity of mid-shell. Early calculations by Kumar and Baranger that were quite consistent with the data kumar68 indicated a change from a prolate towards a more oblate ground-state shape between and and were later substantiated by studies from Bengtsson et al. bengt87 . Stuchbery et al. stuchbery96 analysed gyromagnetic factors starting from the two-band mixing study carried out by Dracoulis et al. dracou86 , in which the mixing between a regular and an intruder configuration consistent with the measured and with measurements by Xu et al. xu92 was extracted. The calculations by Stuchbery et al. stuchbery96 pointed out that the data cannot be described using only a single configuration but are consistent with the mixing of two configurations. In particular, the need of an increased number of active proton pairs for the description of the results was demonstrated. The same conclusion was reached by Harder et al. harder97 . More recently, Bian et al. bian07 carried out projected shell-model calculations starting from a deformed basis, concentrating on g-factors for the state throughout the rare-earth region, i.e. from Gd up to the Pt nuclei. Although they obtained a rather good agreement for most of the region, the calculated results show a distinct set of too low g-factors in the Pt nuclei in the mass region . Only by means of an artificial increase of the deformation, one could improve the agreement. Thus, g-factors are sensitive observables to the precise configuration content of the nuclear wave function describing the state.
Within an IBM context, magnetic moments can be calculated with the IBM-2 Arim77 ; Otsu78 , which differentiates between proton () and neutron bosons () . The M1 operator can then be written as
| (10) |
Using the standard microscopic values for the g factors Neumann95 , i.e. and , the M1 operator reduces to,
| (11) |
The calculation of the matrix element of this operator cannot be accomplished directly with IBM-1, but if one assumes F-spin symmetry for the IBM-2 Hamiltonian Otsu78 , it can be readily shown that the gyromagnetic factor can be written as harder97 ,
| (12) |
where is the number of protons out of the closed shell divided by two and is that part of the wave function of the state within the -boson (regular) space (see Section II.2 for its definition). In Fig. 12, we present the calculated g-factors and the experimental values.
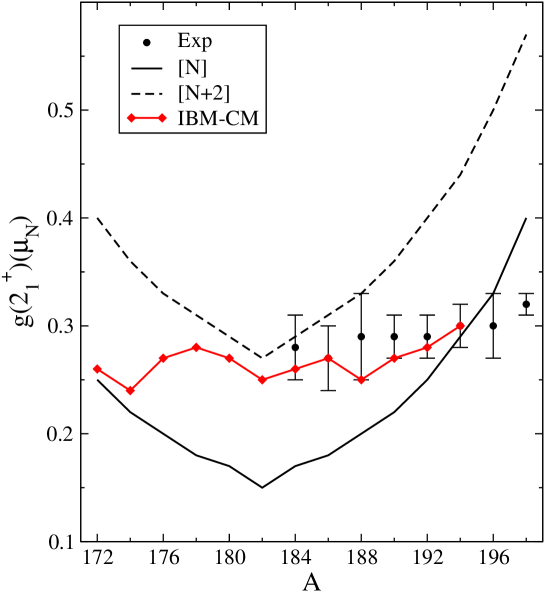
This figure is qualitatively similar to the one in harder97 , but displays a better agreement with the experimental data. Note that this calculation is parameter free once the wave functions are determined. As a reference, we also plotted the limits corresponding to wave function with either fully regular character or intruder . The theoretical results obtained after the mixing calculation should be situated between both lines. Note that, according to the IBM, this flat behaviour of the g-factors is necessarily explained by a strong mixing between the regular and intruder 2p-2h configurations.
IV.2 -decay hindrance factors
In the Pb-region, most interesting results were obtained when the content of the nuclear wave functions was tested through -decay measurements. It was shown by Andreyev et al. andrei00 that -decay was instrumental as a sensitive probe to prove the presence of a triplet of states in 186Pb, each corresponding to a different shape.
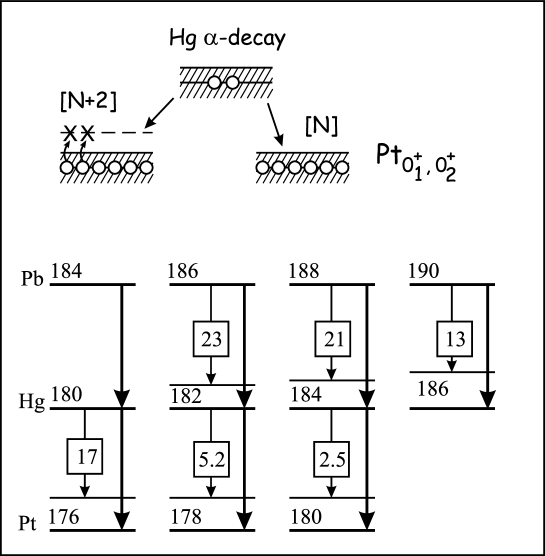
Wauters et al. wauters94 ; wauters94a carried out experiments on the -decay from the Po, Pb and Hg nuclei to the Pb, Hg and Pt nuclei, respectively, concentrating in particular on the mid-shell region. decay is a highly sensitive fingerprint, precisely because an particle is emitted in the decay, a process which requires the extraction of two protons and two neutrons from the initial nucleus. The comparison of s-wave l=0 -decay branches from a given parent nucleus (the Hg ground state in the present situation) to states in the daughter nucleus (the Pt ground state and excited states) is important in that respect.
The reduced -decay widths themselves are very difficult to calculate on an absolute scale, but hindrance factors reflect possible changes amongst the wave functions describing various states in a given daughter nucleus duppen00 well. Hindrance factors of an -decay branch to an excited state with a strength , relative to the -decay branch to the ground state with intensity are defined by the ratio
| (13) |
where is the reduced width, the penetration probability through the combined Coulomb and centrifugal barrier duppen00 and the -decay intensity (with for the ground state and excited state, respectively). They indicated that, in the neutron mid-shell region, the ground-state in the Pb and Hg nuclei is essentially consistent with a closed core and a two-proton hole configuration in the core wauters94 ; wauters94a (see upper part of Fig. 13; only the proton structure is depicted, as one does not expect the neutron part to be different in the final states). However, -decay feeding into the first-excited state exhibits a hindrance factor which is increasing with decreasing mass number (see Fig. 13, lower part. The specific values of the hindrance factors are the adopted values as given in Nucl. Data Sheets, starting from the original data wauters94 ; wauters94a ). The observed large increase in hindrance when moving towards () is consistent with the two-band mixing calculations by Dracoulis et al. dracou86 which results in a 0+ ground state exhibiting an increasing regular configuration weight of 50% for mass A=180 and A=178 up to 80% for mass A=176. This is consistent with the results presented in Fig. 4, where the the ground state is progressively becoming a regular configuration, moving from mass (with of component) towards ( of component) and ( of component). The important point here, as also stressed by Van Duppen and Huyse duppen00 , is the consistent picture that results when treating the Po, Pb, Hg, and Pt nuclei jointly. More detailed calculations have been carried out by Delion et al. delion95 ; delion96 , and more recently by Karlgren et al. karlgren06 , and by Xu et al. xu07 , emphasising the need for a microscopic QRPA description that encompasses both neutron and proton pairing vibrations and that includes proton 2p-2h excitations across the closed shell. They calculated hindrance factors for -decay into the neutron-deficient Po, Pb, Hg, and Pt nuclei. The hindrance factors for decay into the 176,178,180Pt first excited state exhibit a large increase when moving down from mass towards , corroborating the results from a simple two-level analysis wauters94a . Thus, -decay hindrance factors can serve as a sensitive fingerprint to test structural changes of the nuclear wave functions.
IV.3 Isotopic shifts
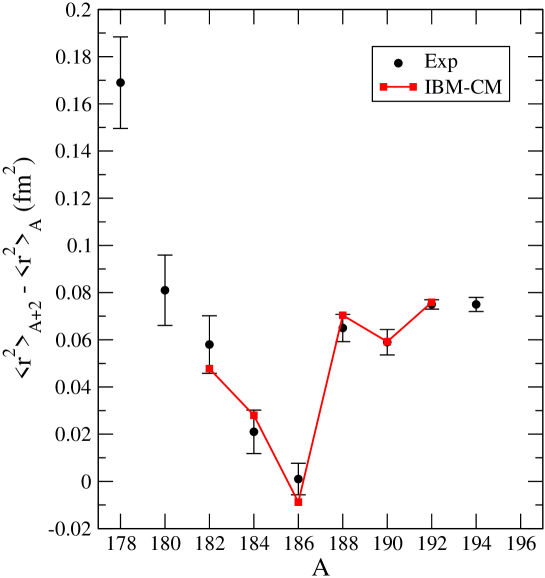
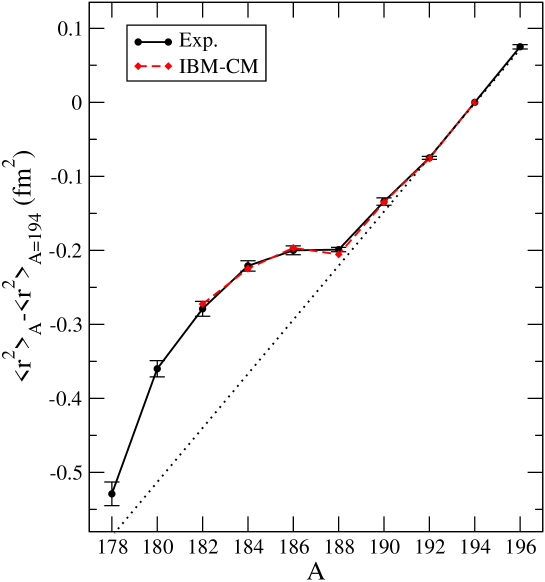
Experimental information about ground-state charge radii is also available for both the even-even and odd-mass Pt nuclei. Combined with similar data for the adjacent Pb and Hg as well as the odd-mass Bi, Tl and Au nuclei the systematic variation of the charge radii supplies invaluable information on the ground-state wave function otten89 . In particular, detailed studies by Hilberath et al. hilberath92 for the 183-198Pt nuclei and by Le Blanc et al. leblanc99 have extended the charge radii measurements down to 178Pt. We illustrate the relative changes defined as - in Fig. 14 and the overall behaviour of relative to the radius at mass in Fig. 15. The mean-square charge radius exhibits a clear-cut change at and below mass with respect to the almost linear decrease for the heavier mass Pt nuclei, as can be seen in Fig. 15 . This kink gives rise to a pronounced dip in the relative difference of charge radii for mass and , as illustrated in Fig. 14. An extrapolation of the linear trend downwards from mass (see dotted line in Fig. 15), hints towards an increased deformation of the ground state. This experimental mass dependence is rather well reproduced in the Hartree-Fock-Bogliubov calculations (HFB) using the Gogny force gogny80 ; gogny88 , as illustrated in Fig. 5 and Table V in the study by Le Blanc et al. leblanc99 .
The IBM-CM calculations that were carried out by Harder et al. harder97 as well as the present, more detailed, IBM-CM study of the even-even Pt nuclei yield the same qualitative results for the decomposition of the ground-state wave function presented in Fig. 3 of García-Ramos and Heyde (2009) and in the present Fig. 4. The regular component with N bosons becomes minimal at (about and in the more schematic and more extensive IBM-CM calculations, respectively) and reaches a value of in both calculations for masses heavier than and lighter than . This latter mass interval corresponds in a qualitative way to the bump in the evolution of the mean-square charge radii relative to the dotted-line background. The mixing calculations carried out by Harder et al. harder97 (see their Fig. 3) are consistent with a dip in the relative variation at the mass numbers and . To calculate the isotope shifts, we have used the standard IBM-CM expression for the nuclear radius
| (14) |
The four parameters appearing in this expression are adjusted to the experimental data. Note that only the experimental values past mid shell () are used. The resulting values are fm2, fm2, fm2, and fm2 and are only valid for the second half of the shell. The comparison with the experimental data show a very good quantitative agreement, which confirms the assumption that the balance between and contributions to the wave function along the whole chain of Pt isotopes is very well described.
V Conclusions
Upon comparison of the level systematics of the Pb, Hg and Pt nuclei, from the neutron closed shell at towards very neutron-deficient nuclei and even beyond the neutron mid-shell at , some conspicuous differences show up. For the Pb and Hg nuclei, intruding bands are observed in a compelling way and have been explained as the occurrence of prolate and oblate bands (coexisting with the spherical states at the proton closed shell Pb nuclei) within the context of mean-field theory or as many-particle many-hole proton excitations across the closed shell within a highly-truncated shell-model approach that approximates the nucleon pairs as - and -boson pairs (IBM). For the Pt nuclei, however, the energy systematics does not obviously point towards the presence of two different structures, as was the case in the Hg nuclei.
In a former paper García-Ramos and Heyde (2009), we have extensively compared configuration mixing IBM calculations incorporating both 2p-2h excitations and the regular configuration with IBM calculations that restrict the model space to just the regular configurations . At first sight, one would expect to observe strong differences. However, the results showed that, up to an excitation energy of 1.5 MeV, the energy spectra, absolute values, branching ratios, and quadrupole moments turned out largely similar. The point was raised that, somehow, configuration mixing did not show up explicitly when only considering a restricted set of data. Therefore the name “concealed” is in order.
In the present paper, we have extensively studied how configuration mixing between two distinct model spaces, i.e. the and configurations, may give rise to results that resemble those obtained when only using a subset of the full model space. We have noticed that it is important to have the two families of energy bands ( the regular, , and the intruder 2p-2h, , bands) of which the lowest cross at and . This particular crossing, reminiscent of similar situations of inversion of regular and intruder configurations as observed e.g. in the and neutron rich nuclei, and the mixing between the regular and intruder 2p-2h bands gives rise to a specific structure of the wave functions along the yrast bands. Near mid-shell (), we observe a progressive change of character from the higher-spin members (at Jπ=8+,6+) that are almost of pure intruder character towards more mixed configurations, though still mainly of intruder character, at the lower spin values. With the higher-spin members retaining a rather pure intruder character for most of the mass region studied here (with 172 A 192), it is natural to redraw energy spectra relative to the higher-spin member at 8+. The changing character in the wave function is evident from the energy spectra, which result from the mixing of the regular configuration, with a more spherical character and typical energy-spacing of keV, and the intruder 2p-2h configuration, with a more deformed character and a typical energy spacing of keV. We have illustrated this for the nuclei at , and , hence passing through the mid-shell region. In addition to the study of energy spectra, we have also carefully studied the decomposition of the most important E2 reduced matrix elements into its components originating from the regular and intruder bands. In this way, the specific effect of the mixing is highlighted in both, the appearance of the correct energy spectra and values, when comparing with the experimental data.
We stress in particular the importance of the crossing of these unperturbed regular and intruder bands for the description of the specific systematics of the energy spectra of the Pt nuclei. They are characterised by a rather sudden drop in the excitation energy of the 0, 4, 2 and 6 levels between neutron number and , with energies starting to move up again between neutron number and . In the intermediate region, the energy spectra exhibit a particularly flat behaviour with changing neutron number and even a slightly ’upward’ bump for the 0, 2, 4 levels. Within a schematic 2-level model, such an effect is caused by the mixing of a single regular band and an intruder band that has parabolic-like evolution of the absolute energy. When one plots the energy spectrum relative to the lowest 0+ state, a slight bump results.
At this point, the remaining question is whether the configuration mixing can be ’unveiled’, in particular for the lowest-lying levels such as the ground-state (through study of isotopic shifts, transfer reaction intensities, etc) and lowest 2 state (g-factor for instance) Therefore, we have calculated those observables. The g-factor very clearly indicates the need for a rather strong mixing, becoming more pure in regular character for the lightest and heaviest mass numbers. Until present, transfer reactions are not possible yet, but -decay can provide such overlap factors through the hindrance factors. Even though not quantitatively verified, the changing structure in the versus content of the wave functions for the 0 states is consistent with the change in hindrance factor, becoming increasingly large for the excited 0+ state compared to the ground state with decreasing mass number. The isotopic shifts are also a very direct measure of the ground-state wave function and as such is a number sensitive to its precise decomposition. The dip in the isotopic shift curve at is well reproduced by the present wave functions, derived from the mixing calculations and containing two different structures, a more spherical one and a more deformed component. The variation of the mean-square radii clearly shows a bump structure very much centred around the mid-shell neutron number.
The study of the Pt nuclei is interesting because it demonstrates that calculations of a very different nature can give rise to a good description of a number of properties. However, different models working in different model spaces and with different effective interactions should stand the test to as many observables as possible. In this respect, the study of the configuration mixing is quite illuminating as it consistently describes an as large set of observables as possible. Ideally, one would like to see transfer data, populating the Pt nuclei through single and double-nucleon transfer. Moreover, we suspect that the Pt nuclei are not just an isolated case of concealed configuration mixing. When carefully inspecting the changing structure and systematics in the Po nuclei (which have two protons outside the Pb core), the observed spectra do not display an obvious presence of extra intruder bands. However, recent studies point strongly towards the presence of intruding 2p-2h excitations (or the presence of an oblate and a spherical band in mean-field terminology) near hela99 ; coster99 ; oros99 ; grahn06 ; grahn08 ; grahn09 ; cocio11 .
VI Acknowledgements
We thank M. Huyse, P. Van Duppen and P. Van Isacker for continuous interest in this research topic and J. L. Wood for stimulating discussions on the study of shape coexistence in the Pb region. This work has been supported by Junta de Andalucía under projects FQM318 and P07-FQM-02962, by Spanish Consolider-Ingenio 2010 (CPAN CSD2007-00042) and by the Belgian Interuniversity Attraction Pool (IUAP) under project number P6/23. One of the authors (JEGR) acknowledges the hospitality of the Department of Physics and Astronomy of the University of Ghent. VH gratefully acknowledges a postdoctoral fellowship from the F.R.S.-FNRS (Belgium) and the partial financial support by the US DOE under grant DE-FG02-95ER-40934. KH thanks the FWO-Vlaanderen for financial support during this project under grant G.0407.07N as well as the University of Ghent for continuing support.
References
- (1) K. Heyde and J.L. Wood, to be published in Revs. Mod. Phys.
- (2) E. Caurier and G. Martínez-Pinedo and F. Nowacki and A. Poves and A. P. Zuker, Rev. Mod. Phys. 77, 427 2005.
- (3) M. Bender, P.-H. Heenen, and P.-G. Reinhard, Rev. Mod. Phys. 75, 121 (2003).
- (4) T. Duguet, M. Bender, P. Bonche, and P.-H. Heenen, Phys. Lett. B 559, 201 (2003).
- (5) N.A. Smirnova, P.-H. Heenen, and G. Neyens, Phys. Lett. B 569, 151 (2003).
- (6) M. Bender, P. Bonche, T. Duguet, and P.-H. Heenen, Phys. Rev. C 69, 064303 (2004).
- (7) T. Grahn et al., Nucl. Phys.A 801, 83 (2008).
- (8) R. Rodríguez-Guzmán, P. Sarriguren, L.M. Robledo, and J.E. García-Ramos, Phys. Rev. C 81, 024310 (2010).
- (9) K. Nomura, T. Otsuka, R. Rodríguez-Guzmán, L.M. Robledo, and P. Sarriguren, Phys. Rev. C 83, 014309 (2011).
- (10) K. Heyde, P. Van Isacker, M. Waroquier, J.L. Wood, and R.A. Meyer, Phys. Rep. 102, 291 (1983).
- (11) J.L. Wood, K. Heyde, W. Nazarewicz, M. Huyse, and P. Van Duppen, Phys. Rep. 215, 101 (1992).
- (12) R. Julin, K. Helariutta, and M. Muikku, J. Phys. G 27, R109 (2001).
- (13) P. Rahkila et al., Phys. Rev.. C82, 011303(R)(2010).
- (14) T. Grahn et al., Phys. Rev. Lett. 97, 062501 (2006).
- (15) T. Grahn et al., Phys. Rev.. C80, 014324 (2009).
- (16) T. Grahn et al., Phys. Rev. C80, 014323 (2009).
- (17) M. Scheck et al., Phys. Rev.. C81, 014310 (2010).
- (18) H. De Witte et al., Phys. Rev. Lett. 98, 112502 2007
- (19) T.E. Cocolios et al. Phys. Rev. Lett. 106, 052503 (2011).
- (20) A.E. Stuchbery, S.S. Anderssen, A.P. Byrne, P.M. Davidson, G.D. Dracoulis, and G.J. Lane, Phys. Rev. Lett. 76, 2246 (1996).
- (21) Bao-An Bian, Yao-Min Di, Gui-Lu Long, Yang Sun, Jing-ye Zhang, and J.A. Sheikh, Phys. Rev. C 75, 014312 (2007).
- (22) J. Wauters, N. Bijnens, P. Dendooven, M. Huyse, Han Yull Hwang, G. Reusen, J. von Schwarzenberg, P. Van Duppen, R. Kirchner, E. Roeckl, and the ISOLDE Collaboration, Phys. Rev. Lett. 72, 1329 (1994).
- (23) J. Wauters, N. Bijnens, H. Folger, M. Huyse, Han Yull Hwang, R. Kirchner, J. von Schwarzenberg, and P. Van Duppen, Phys. Rev. C 50, 2768 (1994).
- (24) P. Van Duppen and M. Huyse, Hyperf. Interact. 129, 149 (2000).
- (25) M. Sandzelius et al., Phys. Rev.. C79, 064315 (2009).
- (26) M. Scheck et al., Phys. Rev.. C83, 037303 (2011)
- (27) N. Bree, private comm.
- (28) M. Huyse, privat comm.
- (29) E. A. McCutchan, R.F. Casten, and N.V. Zamfir, Phys. Rev. C 71, 061301(R) (2005).
- (30) E. Williams, C. Plettner, E.A. McCutchan, H. Levine, N. V. Zamfir, R.B. Cakirli, R.F. Casten, H. Ai, C.W. Beausang, G. Gürdal, A. Heinz, J. Qian, D.A. Meyer, N. Pietralla, and V. Werner, Phys. Rev. C 74, 024302 (2006).
- (31) D.T. Joss et al., Phys. Rev. C 74, 014302 (2006).
- (32) Y. Oktem et al., Phys. Rev. C 76, 044315 (2007).
- (33) E.A. McCutchan, R.F. Casten, V. Werner, R. Winkler, R.B. Cakirli, G. Gürdal, X. Liang, and E. Williams, Phys. Rev. C 78, 014320 (2008).
- (34) M. B. Gómez Hornillos et al., Phys. Rev. C79, 064314 (2009).
- (35) G. Ilie et al., Phys. Rev. C82, 024303 (2010).
- (36) F. Iachello and A. Arima, The Interacting Boson Model, Cambridge University Press (1987).
- (37) P.D. Duval and B.R. Barrett, Nucl. Phys. A 376, 213 (1982).
- (38) M.K. Harder, K.T. Tang, and P. Van Isacker, Phys. Lett. B 405, 25 (1997).
- (39) S.L. King et al., Phys. Lett. B 433, 82 (1998).
- (40) E.A. McCutchan and N.V. Zamfir, Phys. Rev. C 71, 054306 (2005) and private communication.
- García-Ramos and Heyde (2009) J.E. Garía-Ramos and K. Heyde, Nucl. Phys. A 825, 39 (2009).
- (42) S. Cohen, R.D. Lawson, and J.M. Soper, Phys. Lett. 21, 306 (1966).
- (43) R.D. Lawson and J.M. Soper, Proc. of the International Nuclear Physics Conference, Gatlinburg,Tennessee, eds. R.L. Becker, C.D. Goodman, P.H. Stelson, and A. Zuker, Academic Press, New-York, pg. 511 (1967).
- (44) R.D. Lawson, Theory of the Nuclear Shell Model, Oxford Studies in Nuclear Physics, ed. P.E. Hodgson, Clarendon Press, Oxford (1980)
- (45) J.E. García-Ramos, unpublished.
- (46) E. Caurier, J. Menéndez, F. Nowacki, and A. Poves, Phys. Rev. C75, 054317 (2007).
- (47) E. Caurier, K. Langanke, G. Martínez-Pinedo, F. Nowacki, and P. Vogel, Phys. Lett. B522, 240 (2001).
- (48) K. Heyde, C. De Coster, J. Jolie, and J.L. Wood, Phys. Rev. C46, 541 (1992).
- (49) C. De Coster, K. Heyde, B. Decroix, P. Van Isacker, J. Jolie, H. Lehmann, and J.L. Wood, Nucl. Phys. A 600, 251 (1996).
- (50) D.D. Warner and R.F. Casten, Phys. Rev. C 28, 1798 (1983).
- (51) P.O. Lipas, P. Toivonen, and D.D. Warner, Phys. Lett. B155, 295 (1985).
- (52) K. Heyde, P. Van Isacker, R.F. Casten and J.L. Wood, Phys. Lett. B 155, 303 (1985).
- (53) K. Heyde, J. Jolie, J. Moreau, J. Ryckebusch, M. Waroquier, P. Van Duppen, M. Huyse, and J.L. Wood, Nucl. Phys. A 466, 189 (1987).
- (54) J.L. Wood, Proc. 4th Int. Conf. Nuclei Far From Stability, Helsingør, Denmark, eds. P.G. Hansen and O.B. Nielsen, CERN 81-09, 612 (1981).
- (55) J.L. Wood, Lasers in Nuclear Physics, eds. C.E. Bemis Jr. and H.K. Carter (Nuclear Sciences Res. Conf. Ser. vol. 3) (New-York, Harwood), 481 (1982).
- (56) R. Fossion, K. Heyde, G. Thiamova, and P. Van Isacker, Phys. Rev. C 67, 024306 (2003).
- (57) V. Hellemans, R. Fossion, S. De Baerdemacker, and K. Heyde, Phys. Rev. C 71, 034308 (2005).
- (58) V. Hellemans, S. De Baerdemacker, and K. Heyde, Phys. Rev. C 77, 064324 (2008).
- (59) G.D. Dracoulis et al., Phys. Rev. C 69, 054318 (2004).
- (60) R.D. Page et al., Proc. Of the 3rd International Conference on Exotic Nuclei and Atomic Masses ENAM, Hämeenlinna, Finland, july 2001, eds. J. Äystö, P. Dendooven, A. Jokinen, and M. Leino, Springer-Verlag Berlin Heidelberg, p. 309 (2003).
- (61) K. Kumar and M. Baranger, Nucl. Phys. A 110, 529 (1968).
- (62) R. Bengtsson, T. Bengtsson, J. Dudek, G. Leander, W. Nazarewicz, and Jing-Ye Zhang, Phys. Lett. B 183, 1 (1987).
- (63) G.D. Dracoulis, A.E. Stuchbery, A.P. Byrne, A.R. Poletti, S.J. Poletti, J. Gerl, and R.A. Bark, J. Phys. G 12, L97 (1986).
- (64) Y. Xu, K.S. Krane, M.A. Gummin, M. Jarrio, J.L. Wood, E.F. Zganjar, and H.K. Carter, Phys. Rev. Lett. 68, 3853 (1992).
- (65) A. Arima, T. Otsuka, F. Iachello, and I. Talmi, Phys. Lett. B 66, 205 (1977).
- (66) T. Otsuka, A. Arima, F. Iachello, and I. Talmi, Phys. Lett. B 76, 139 (1978).
- (67) P. von Neumann-Cosel, J.N. Ginocchio, H. Bauer, and A. Richter, Phys. Rev. Lett. 75, 4178 (1995)
- (68) A.N. Andreyev et al., Nature 405, 430 (2000).
- (69) D.S. Delion, A. Florescu, M. Huyse, J. Wauters, P. Van Duppen,the ISOLDE Collaboration, A. Insolia, and R.J. Liotta, Phys. Rev. Lett. 74, 3939 (1995).
- (70) D.S. Delion, A. Florescu, M. Huyse, J. Wauters, P. Van Duppen,the ISOLDE Collaboration, A. Insolia, and R.J. Liotta, Phys. Rev. 54, 1169 (1996).
- (71) D. Karlgren, R.J. Liotta, R. Wyss, M. Huyse, K. Van de Vel, and P. Van Duppen, Phys. Rev. C 73, 064304 (2006)
- (72) Chang Xu and Zhongzhou Ren, Phys. Rev. C 75, 044301 (2007)
- (73) E. Otten, Nuclear Radii and Moments of Unstable Isotopes, Treatise on Heavy-Ion Science, vol. 8, Nuclei Far from Stability, ed. D.A. Bromley Plenum Press, New York and London, 517 (1989).
- (74) Th. Hilberath, St. Becker, G. Bollen, H.-J. Kluge, U. Krönert, G. Passler, J. Rikovska, R. Wysse, and the ISOLDE Collaboration, Z. Phys. A 342, 1 (1992).
- (75) F. Le Blanc et al., Phys. Rev. C 60, 054310 (1999).
- (76) J. Dechargé and D. Gogny, Phys. Rev. C21, 1568 (1980).
- (77) M. Girod, P. Dessagne, M. Bernas, M. Langevin, F. Pougheon, and P. Roussel, Phys. Rev. C37, 2600 (1988).
- (78) K. Helariutta, J.F.C. Cocks, P.T. Greenlees, P. Jones, R. Julin, S. Juutinen, P. Jämsen, K. Kankaanpää, H. Kettunen, and P. Kuusiniemi, Eur. Phys. J. A6, 289 (1999).
- (79) C. De Coster, B. Decroix, K. Heyde, J. Jolie, H. Lehmann, and J.L. Wood, Nucl. Phys. A 651, 31 (1999).
- (80) A.M. Oros, K. Heyde, C. De Coster, B. Decroix, R. Wyss, B.R. Barrett and P. Navratil, Nucl. Phys. A 465, 107 (1999).
- (81) A. Astier and M.-G. Porquet, Phys. Rev. C83, 014311 (2011).