HMTT: A Hybrid Hardware/Software Tracing System for Bridging Memory Trace’s
Semantic Gap
Abstract
Memory trace analysis is an important technology for architecture research, system software (i.e., OS, compiler) optimization, and application performance improvements. Hardware-snooping is an effective and efficient approach to monitor and collect memory traces. Compared with software-based approaches, memory traces collected by hardware-based approaches are usually lack of semantic information, such as process/function/loop identifiers, virtual address and I/O access. In this paper we propose a hybrid hardware/software mechanism which is able to collect memory reference trace as well as semantic information. Based on this mechanism, we designed and implemented a prototype system called HMTT (Hybrid Memory Trace Tool) which adopts a DIMM-snooping mechanism to snoop on memory bus and a software-controlled tracing mechanism to inject semantic information into normal memory trace. To the best of our knowledge, the HMTT system is the first hardware tracing system capable of correlating memory trace with high-level events. Comprehensive validations and evaluations show that the HMTT system has both hardware’s (e.g., no distortion or pollution) and software’s advantages (e.g., flexibility and more information).
Index Terms:
Hybrid Tracing Mechanism, Hardware Snooping, Memory Trace, High-Level Events, Semantic Gap.1 Introduction
Although the Memory Wall [46] problem has been raised for over one decade, this trend remains in multicore era where both memory latency and bandwidth become critical. Memory trace analysis is an important technology for architecture research, system software (i.e., OS, compiler) optimization, and application performance improvements.
Regarding trace collection, Uhlig and Mudge [42] proposed that an ideal memory trace collector should be:
-
•
Complete: Trace should include all memory references made by OS, libraries and applications.
-
•
Detail: Trace should contain detail information to distinguish one process address space from others.
-
•
Undistorted: Trace should not include any additional memory references and it should have no time dilation.
-
•
Portable: Trace can still be tracked when moving to other machines with different configurations.
-
•
Other characteristics: An ideal trace collector should be fast, inexpensive and easy to operate.
Memory trace can be collected in several ways which are either hardware-based or software-based, such as software simulators, binary instrumentation, hardware counters, hardware monitors, and hardware emulators. Table I summarizes these approaches. Although all approaches have their pros and cons, hardware-snooping is relatively a more effective and efficient approach to monitor and collect memory trace. Usually they are able to collect undistorted and complete memory traces that include VMM, OS, library and application. However, in contrast with software-based approaches, there is a semantic gap between memory traces collected by hardware-based approaches and high-level events, such as kernel-user context switch , process/function/loop execution, virtual address reference and I/O access.
| Simu- | Instr- | HW | HW | HW | |
| late | ument | Cnt | Snoop | Emulate | |
| Complete | * | * | x | ||
| Detail | * | x | x | ||
| Undistorted | x | x | |||
| Portable | * | * | x | * | |
| Fast | x | x | |||
| Inexpensive | * | x | |||
| Note: -Yes *-Maybe x-No | |||||
To bridge the semantic gap, we propose a hybrid hardware/software mechanism which is able to collect memory reference trace as well as high-level event information. The mechanism integrates a flexible software tracing-control mechanism into conventional hardware-snooping mechanisms. A specific physical address region is reserved as hardware components’ configuration space which is prohibited for any programs and OS modules except tracing-control software components. When high-level events happen, the software components inject a specific memory traces with semantic information by referencing the pre-defined configuration space. Therefore, hardware components can monitor and collect mixed traces which contain both normal memory reference traces as well as high-level event identifiers. In such a hybrid tracing mechanism, we are able to analyze memory behaviors of specific events. For example, as illustrated in section 6.3, we can distinguish I/O memory reference from CPU memory reference. Moreover, the hybrid mechanism supports various hardware-snooping methods, such as MemorIES [35] which snoops on the IBM s 6xx bus, PHA$E [21] and ACE [26] which snoop on Intel’s Front Side Bus (FSB) and our approach which snoops on memory bus.
Based on this mechanism, we have designed and implemented a prototype system called HMTT (Hybrid Memory Trace Tool) which adopts a DIMM-snooping mechanism and a software-controlled trace mechanism to inject semantic information into normal memory trace. Several new techniques are proposed to overcome the system design challenges: (1) To keep up with memory speeds, the DDR state machine [11] is simplified to match high speed, and large FIFOs are added between the state machine and the trace transmitting logic to handle occasional bursts. (2) To support flexible software-controlled tracing, we develop a kernel module for an uncachable memory region reservation. (3) To dump full mass traces, we use a straightforward method to compress memory trace and adopt a combination of Gigabit Ethernet and RAID to transfer and save the compressed trace. Based on these primitive functions the HMTT system provided, advanced functions can be designed, such as distinguishing one process address space from others, distinguishing I/O memory references from CPU’s. Comprehensive validations and evaluations show that the HMTT system has both hardware’s and software’s advantages. In summary, it has the following advantages:
-
•
Complete: It is able to track complete memory reference trace of real systems, including OS, VMMs, libraries, and applications.
-
•
Detail: The memory trace includes timestamp, r/w, and some semantic identifiers, e.g. process’ pid, page table information, kernel entry/exit tags etc. It is easy to differentiate processes’ address spaces.
-
•
Undistorted: There are almost no additional references in most cases because the number of high-level events is much less than that of memory reference trace.
-
•
Portability: The hardware boards are plugged in DIMM slots which are widely used. It is easy to port the monitoring system to machines with different configurations (CPU, bus, memory etc.). The software components can be run on various OS platforms, such as Linux and Windows.
-
•
Fast: There is no slowdown when collecting memory trace for analysis of L2/L3 cache, memory controller, DRAM performance and power. The slowdown factor is about 10X100X when cache is disabled to collect whole trace.
-
•
Inexpensive: We have built the HMTT system, from schematic, PCB design and FPGA logic to kernel modules, and analysis programs. The implementation of hardware boards is simple and low cost.
-
•
Easy to operate: It is easy to operate the HMTT system, because it provides several toolkits for trace generation and analysis.
Using the HMTT system on X86/Linux platforms, we have investigated the impact of OS on stream-based access and found that OS virtual memory management can decrease stream accesses in view of memory controller (or L2 Cache), by up to 30.2% (301.apsi). We have found that prefercher in memory controller cannot produce an expected effect if not considering the multicore impact, because the interference of memory accesses from multiple cores (i.e., processes/threads) is serious. We have also analyzed characterization of DMA memory references and found that previously proposed Direct Cache Access (DCA) scheme [27] have poor performance for disk-intensive applications because disk I/O data is so large that it can cause serious cache interference. In summary, the evaluations and case studies show the feasibility and effectiveness of the hybrid hardware/software tracing mechanism and techniques.
The rest of this paper is organized as follows. Section 2 introduces semantic gap between memory trace and high-level events. Section 3 describes the proposed hybrid hardware/software tracing mechanism. Section 4 presents design and implementation of the HMTT system and section 5 discusses its verifications and evaluations. Section 6 presents several case studies of the HMTT system to show its feasibility and effectiveness. Section 7 presents an overview of related work. Finally, Section 8 summarizes the work.
2 Semantic Gap Between Memory Trace and High-Level Events
Memory trace (or memory address trace) is a sequence of memory references which are generated by executing load-store instructions. Conceptually, memory trace mainly indicates instruction-level architectural information. Figure 1(a) shows a conventional memory trace (in which timestamp, read/write and other information have already been removed). Since trace-driven simulation is an important approach to evaluate memory systems and has been used for decades [42], this kind of memory trace has played a significant role in advancing memory system performance. As described in the introduction, memory trace can be collected in various ways among which hardware-snooping is relatively a more effective and efficient approach. Usually they are able to collect undistorted and complete memory traces that include VMM, OS, library and application. Nevertheless, those memory traces mainly reflect low-level (machine-level) information which is obscure for most people.
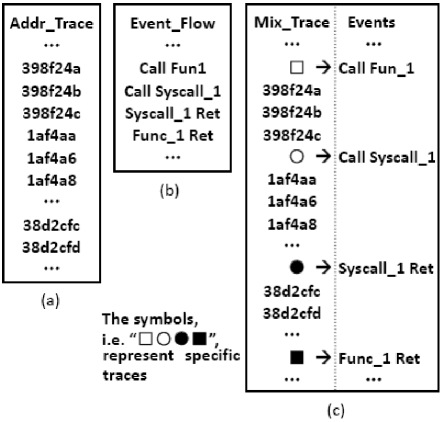
From the perspective of system level, a computer system generates various events, such as context switch, function call, syscall and I/O request. Figure 1(b) illustrates a typical event flow. To capture high-level event flow, one may instrument source code or binary at points of these events manually or automatically. In contrast with memory trace, those events are at higher levels and contain more semantic information which people can understand more easily. However, only given high-level events, it is usually insufficient to analyze system’s performance and behaviors in depth.
Based on the above observations, we can conclude that there is a semantic gap between conventional memory traces and high-level events. If they can correlate to each other, as shown in Figure 1(c), it should be significantly helpful for both of low-level (memory trace) and high-level (system or program events) analysis. For example, for architecture and system, one can distinguish I/O memory references from CPU memory references or analyze memory access pattern of a certain syscall, function and loop and so on. For software engineering, memory access information can be gathered for performance analysis to determine which sections of a program to optimize to increase its speed or decrease its memory requirement.
However, prevalent trace tools can only collect either memory trace or function call graph and OS event. Some hardware monitors are only capable of collecting whole memory requests by snooping on memory bus, such as MemorIES [35], PHA$E [21] and ACE [26]. For high level events, gprof can only provide call graph, and Linux Trace Toolkit [3] and Lockmeter [19] focus on collecting operating system events, however, with a substantial amount of overhead. In addition, by instrumenting the target program with additional instructions, some instrument tools such as ATOM [41], Pin [6], Valgrind [10] are capable of collect more information, e.g., memory trace, function call graph. However, complicated instrumenting the program can cause changes of the performance of program, inducing inaccurate results and bugs. Instrumenting can also slow down the target program as more specific information is collected. Moreover, it is hard to instrument virtual machine monitor and operating system.
In summary, there is a semantic gap between conventional memory traces and high-level events but almost none of the existing tools are capable of bridging the gap effectively.
3 A Hybrid Hardware/Software Tracing Mechanism
To address the semantic gap, we propose a hybrid hardware/software mechanism which is able to collect memory reference trace as well as high-level event information simultaneously.
As shown in Figure 1(c), in order to efficiently collect such correlated memory reference and event trace, the hybrid tracing mechanism consists of three key parts which we will discuss in the following subsections.
3.1 Hardware Snooping
Hardware snooping is an efficient approach to collect memory reference via snooping on system bus or memory bus. It is able to collect complete memory traces including VMM, OS, library and application without time and space distortions. It should be noted that hardware snooping approach mainly collects off-chip traffics. Nevertheless, there are at least two ways to alleviate this negative influence while one needs all memory references generated by load/store unites within a chip: (1) Mapping program’s virtual address regions to physical memory with uncachable attribution. This can be done by a slight modification for OS memory management or a command to reconfigure processor’s Memory Type Range Registers (MTRR). (2) Enabling/disabling cache dynamically. To achieve such a goal, we can set cache control registers many processors provided (e.g., X86’s CR0) when entering a certain code section. These cache control approaches may cause slowdown of 10X, still being competitive while comparing to other software tracing approaches.
3.2 Configuration Space
Usually it is difficult for software to control and synchronize with hardware snooping devices, because the devices are usually independent of target traced machine.
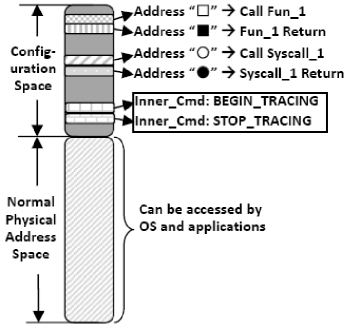
We address this problem by introducing a specific physical address region reserved as hardware device’s configuration space which is prohibited for any programs and OS modules except tracing-control software, as illustrated in Figure 2. The addresses within the configuration space can be predefined as hardware device’s inner commands, such as BEGIN_TRACING, STOP_TRACING, INSERT_ONE_SPECIFIC_TRACE. They can also represent high-level events, such as function call and syscall return.
3.3 Low Overhead Tracing-Control Software
Based on the configuration space, a low overhead tracing-control software mechanism can be integrated into a conventional hardware-snooping mechanism.
The tracing-control software has two functions. First, it is able to control hardware snooping device. When the tracing-control software generates a memory reference to a specific address in the configuration space, the hardware device captures the specific address which is predefined as an inner command, such as BEGIN_TRACING or STOP_TRACING. Then the hardware device performs corresponding operations according to the inner command. Second, the software can make hardware snooping device synchronize with high-level events. When those events occur, the tracing-control software generates specific memory references to the configuration space in which different addresses represent different high-level events. In this way, the hardware device is able to collect mixed traces as shown in the left side of Figure 1(c), including both normal reference and specific reference.
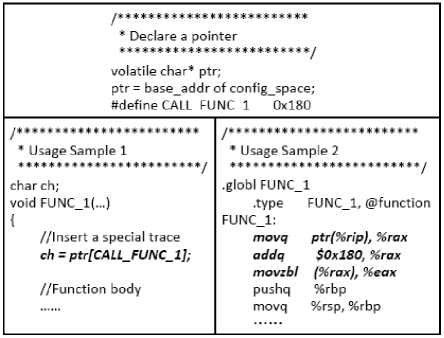
Since hardware snooping can be controlled by only one memory reference, this tracing-control software mechanism is extremely low-overhead. The design and implementation of the software are quite simple. Figure 3 illustrates a sample of tracing-control software. It includes two phases. In phase one, a pointer ptr is defined and assigned with base address of the configuration space. In phase two, programs can be instrumented with the statement ”ch = ptr[EVENT_OFFSET];” to insert specific references into normal trace. Further, in order to reduce substantial negative influence of source code instrumentation, instructions can be directly inserted into an assembler program, as the second sample shown in Figure 3.
With this hybrid tracing mechanism, we are able to analyze memory behaviors of a certain event. For example, as illustrated in section 6, we can instrument device drivers to distinguish I/O memory reference from CPU memory reference. Further, the tracing mechanism can be configured to only collect high-level events with very low overhead, i.e., only collect the right side of Figure 1(c). In addition, the hybrid mechanism supports various hardware-snooping methods, such as MemorIES [35] which snoops on the IBM s 6xx bus, PHA$E [21] and ACE [26] which snoop on Intel’s Front Side Bus (FSB) and our prototype system HMTT which snoops on memory bus.
4 Design and Implementation of HMTT Tracing System
Based on the hybrid hardware/software tracing mechanism, we have designed and implemented a prototype system called HMTT (Hybrid Memory Trace Tool). The HMTT system adopts a DIMM-snooping mechanism that uses hardware boards plugged in DIMM slots to snoop on memory bus. We will introduce design and implementation of the HMTT system in detail in the following subsections.
4.1 Top-Level Design
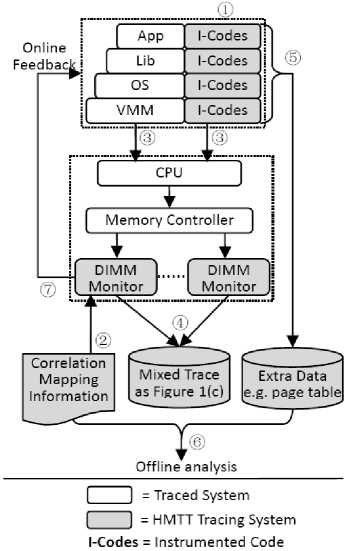
At the top-level, the HMTT tracing system mainly consists of seven procedures for memory trace tracking and replaying. Figure 4 shows the system framework and the seven procedures.
From Figure 4, the first step for mixed trace collection is instrumenting target programs (i.e., application, library, OS and VMM) with I-Codes by hand and by scripts or compilers (①). The I-Codes inserted at the points where high-level events occur will generate specific memory references (③) and some extra data such as page table, I/O request (⑤). Note that the mapping information of correlated memory trace and high-level events (②) is also an output of the instrumenting operations.
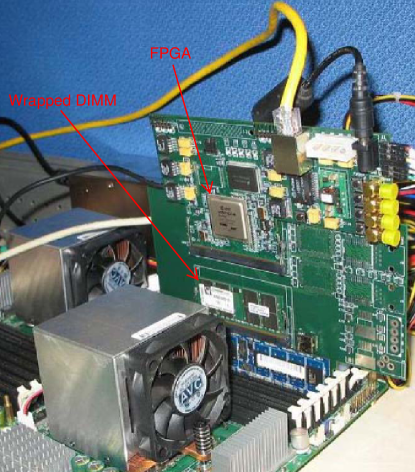
For hardware parts, the HMTT system uses several hardware DIMM-monitor boards plugged into DIMM slots of a traced machine. The main memories of the traced system are plugged into the DIMM slots integrated on the hardware monitoring boards (see Figure 8). The boards monitor all memory commands via DIMM slots (④). An on-board FPGA converts the commands into memory traces in this format address, r/w, timestamp. Each hardware monitor board generates trace separately and sends the trace to its corresponding receiver via Gigabit Ethernet or PCI-Express interface (see ④). With synchronized timestamps, the separated traces can be merged into a total mixed trace.
If necessary, the I-Codes can track and collect some additional data to aid memory trace analysis. For example, page table information can be used to reconstruct physical-to-virtual mapping relationship to help analyze process’ virtual address (⑥). I/O request information collected from device drivers can be used to distinguish I/O memory references from CPU memory references. Further, the on-board FPGA can perform online analysis and send feedbacks to OS for online optimization via interrupt.
We need to address several challenges to design this system, such as how to make hardware snooping devices keep up with memory speeds, how to design configuration space for hardware devices, how to control tracing by software and how to dump and replay massive trace. We will elaborate on our solutions in the following subsections.
4.2 Hardware Snooping Device
4.2.1 Keeping up with Memory Speeds
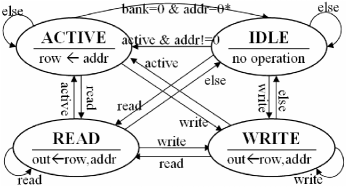
Fast and efficient control logic is required to keep up with memory speeds because of high memory frequency and multi-bank technologies. Since only memory address is indispensable for tracking trace, we can only monitor DDR commands at half memory data frequency. For example, if use a DDR2-533MHz memory, the control logic can operate at a frequency of only 266MHz, at which most advanced FPGAs can work.
To interpret the two-phase read/write operations, the DDR SDRAM specification [11] defines seven commands and a state machine which has more than twelve states. Commercial memory controllers integrate even more complex state machines which cost both time and money to implement and validate. Nevertheless, we find that only three commands, i.e. ACTIVE, READ and WRITE, are necessary for extracting memory reference address. Thus, we design a simplified state machine to interpret the two-phase operations for one memory bank. Figure 5 shows the simplified state machine. It has only four states and performs state transitions based on the three commands. The state machine is so simplified that the implementation in a common FPGA is able to work at a high frequency. Our experiments show that the state machine implemented in a Xilinx Virtex II Pro FPGA is able to work at a frequency of over 300MHz.
On the other hand, applications will generate occasional bursts which may induce dropping trace. A large FIFO between the state machine and trace transmitting logic is provided to solve this problem. In the HMTT system, we have verified that a 16K entries FIFO is sufficient to match the state machine for a combination of DDR-200MHz and a transmission bandwidth of 1Gbps as well as a combination of DDR2-400MHz and a bandwidth of 3Gpbs. For a higher memory frequency (e.g., DDR2-800MHz), we can adopt some alternative transmission technologies, such as PCI-E which can provide bandwidths of over 8Gbps.
4.2.2 Design of Hardware Device
The HMTT system consists of a Memory Trace Board (MTB), which is a hardware monitor board wrapping a normal memory and itself plugged in a DIMM slot (see Figure 8). The MTB monitors memory command signals which are sent to DDR SDRAM from memory controller. It captures the DDR commands, and forwards them to the simplified DDR state machine (described in the last subsection). The output of state machine is a tuple address, r/w, duration. These raw traces can be sent out directly via GE/PCIE or buffered for online analysis.
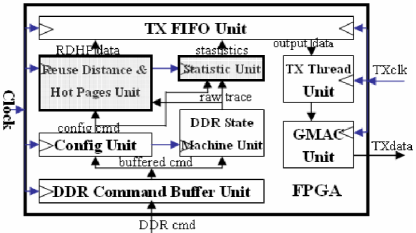
There is an FPGA on the MTB. Figure 6 shows the physical block diagram of the FPGA. It contains eight logic units. The DDR Command Buffer Unit (DCBU) captures and buffers DDR commands. Then the buffered commands are forwarded to the Config Unit and the DDR State Machine Unit. The Config Unit (CU) translates a specific address into inner-commands, and then controls MTB to perform corresponding operations, such as switching work mode, inserting synchronization tags to trace. The DDR State Machine Unit (DSMU) interprets two-phase interleaved multi-bank DDR commands to a format of address, r/w, duration. Then the trace will be delivered to the TX FIFO Unit (TFU) and be sent out via GE. The FPGA is reconfigurable to support two optional units: the Statistic Unit (SU) and Reuse Distance & Hot Pages Unit (RDHPU).
The Statistic Unit is able to do statistic of various memory events in different intervals (1us 1s), such as memory bandwidth, bank behavior, and address bits change. The RDHPU is able to calculate page s reuse distance and collect hot pages. The RDHPU s kernel is a 128-length LRU stack which is implemented in an enhanced systolic array proposed by J.P. Grossman [25]. The output of these statistic unit can be sent out or used for online feedback optimization. To keep up with memory speeds, the DDR State Machine Unit adopts the simplified state machine described in the last subsection. The TX FIFO Unit contains a 16K entries FIFO between the state machine and the trace transmitting logic.
4.3 Design of Configuration Space
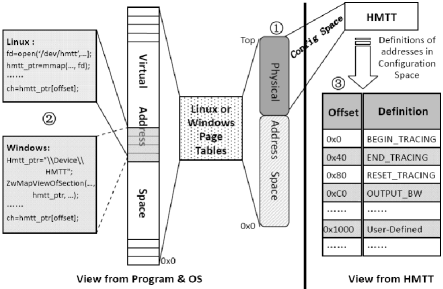
As described before, we adopt a configuration space mechanism to address the challenge of making software control hardware snooping devices. Figure 2 has illustrated the principle scheme of this mechanism where a specific physical address region is reserved for configuration space. Further, the right part of Figure 7 illustrates the details of HMTT’s configuration space. The addresses of the space are defined as either HMTT’s inner commands (e.g., BEGIN_TRACING, STOP_TRACING, INSERT_ONE_SPECIFIC_TRACE) or user-defined high-level events (from address 0x1000). Note that the difference of two contiguous defined addresses relies on block size of processor’s last level cache whose size is 64 (0x40) bytes in our cases.
4.4 Tracing-Control Software
Figure 3 has already illustrated two samples of tracing-control software. In this subsection, we will present details of software implementations. As shown in Figure 7, the tracing-control software can run on both Linux and Windows platforms. At phase ①, the top several megabytes (e.g., 8MB) physical memory is reserved as the HMTT’s configuration space when Linux or Windows boot. This can be done by modifying the parameter in grub (i.e., mem) or boot.ini (i.e., maxmem). Thus, access to the configuration space is prohibited for any programs and OS modules. At phase ②, a kernel module is introduced to map the reserved configuration space as a user-defined device, called /dev/hmtt for Linux or DeviceHMTT for Windows. Then user programs can map /dev/hmtt (Linux) or DeviceHMTT (Windows) into their virtual address spaces so that they can access the HMTT’s configuration space directly. At phase ③, the HMTT’s Config Unit will identify the predefined addresses and translate them into inner-commands to control the HMTT system. For example, the inner-command END_TRACING is defined as one memory read reference on the offset of 0x40 in the configuration space.
4.5 Trace Dumping and Replay
Usually, memory reference traces are generated at very high speed. Our experiments show that most applications generate memory trace at bandwidths of more than 30MB/s even when utilize the DDR-200MHz memory. Moreover, the high frequency of the DDR2/DDR3 memory and the prevalent multi-channel memory technology further increase trace data generation bandwidth, up to 100X MB/s. Our efforts consist of two aspects.
First, we apply several straightforward compress methods to reduce the memory trace generation and transmission bandwidth. While memory works in burst mode [11], we only need to track the first memory address of a contiguous addresses pattern. For example, when the burst length is equal to four, the latter three addresses of a 4-length addresses pattern can be ignored. Trace format is usually defined as address, r/w, timestamp which needs at least 68 bytes to store and transmit. We find that the high bits of the difference of timestamps in two adjacent traces are always 0s at most time. We use duration (= - ) to replace timestamp in the trace format. This differencing method reduces the duration bits to ensure one trace to be stored and transmitted in 4 bytes. However, the duration may overflow. We define a specific format special_identifier, duration_high_bits to handle the overflows. Then, the timestamps can be calculated in the trace replay phase. The straightforward compress methods substantially reduce trace generation and transmission bandwidth.
Second, the experimental results show that trace generation bandwidth is still high with the above compressions. In the procedure ④ shown in figure 4, we adopt multiple Gigabit Ethernets (GE) and RAIDs to send and receive memory traces respectively (in fact, multiple GEs can be replaced by one PCIE interface). In this way, all traces are received and stored in RAID storages (the details about trace generation and transmission bandwidth will be discussed in the next section). Each GE sends trace respectively, so the separated traces need to be merged when replay. We assign each trace its own timestamp which is synchronized within FPGA. Then the trace merge operation is simplified to be a merge sort problem.
In summary, the HMTT system adopts a combination of the straightforward compressions, the GE-RAID approach and the trace merge procedure to dump massive traces. In our experiments, we use a machine with several Intel E1000 GE NICs to receive memory trace. These techniques are scalable for higher trace generation bandwidth.
4.6 Other Design Issues
There are several other design issues of the HMTT system, such as collecting extra kernel information, controlling cache dynamically.
Assistant Kernel Module: We introduce an assistant kernel module to help collect kernel information, such as page table, I/O requests. On Linux platform, the assistant kernel module provides an hmtt_printk routine which can be called at any place from the kernel. Unlike Linux kernel s printk, the hmtt_printk routine supports large buffers and user-defined data format, like some popular kernel log tools, such as LTTng [3]. The assistant kernel module requires a kernel buffer to store kernel collected information. Usually, this buffer is quite small. For example, our experiments show that the size of a buffer for all page tables is only about 0.5% of total system memory.
Dynamical Cache-Enable Control: Hardware snooping approach collects off-chip traffics. We adopt a dynamically enabling/disabling cache approach to collect all memory references. On X86 platforms, we introduce a kernel module to set the Cache-Disable bit (bit30) of CR0 register to control cache when entering or exiting a certain code section. This cache control approach may cause slowdown of 10X, still being competitive while comparing to other software tracing approaches. In addition, the X86 processor’s Memory Type Range Registers (MTRR) can also be used for managing cachable attribution.
4.7 Put It All Together
So far, we have described a number of design issues of the HMTT system, including hardware snooping device, configuration space, tracing-control software, trace dumping and replay, assistant kernel module, dynamically cache enabling and so on.
Figure 8 illustrates the real HMTT system which is working on an AMD server machine. Currently, the HMTT system supports DDR-200MHz and DDR2-400MHz and will support DDR2/DDR3-800MHz in the near future. We have tested the tracing-control software on various Linux kernels (2.6.14 2.6.27). The software can be ported to Windows platform easily. We have also developed an assistant kernel module to collect page table and DMA requests currently (we will describe them in detail later). Besides, we have developed a toolkit for trace replay and analysis.
5 Evaluations of the HMTT System
5.1 Verification and Evaluation
We have done a lot of verification and evaluation work. The HMTT system is verified in four aspects, including physical address, comparison with performance counter, software components and synchronization of hardware device and software. We have also evaluated the overheads of the HMTT system, such as trace bandwidth, trace size, additional memory references, execution time of I-Codes and kernel buffer for collecting extra kernel data. The work show that the HMTT system is an effective and efficient memory tracing system. (More details are shown in APPENDIX A.)
5.2 Discussion
5.2.1 Limitation
It is important to note that the monitoring mechanism can not distinguish the prefetch commands.
Regarding the impact of prefetch on memory trace, it has both up side and down side. The up side is that we can get real memory accesses trace to main memory, which can benefit research on main memory side (such as memory thermal model research [31]). The down side is that it is hard to differentiate the prefetch memory access and on-demand memory accesses. Regarding prefetch, caches could generate speculative operations. However, they do not influence memory behaviors significantly. Most memory controllers do not have complex prefetch unit, although several related efforts have been made, such as Impluse project [48], proposed region prefetcher [44], and the stream prefetcher in memory controller [28]. Thus, it is not a critical weakness of our monitoring system. It is to be noted that all hardware monitors also have the same limitation, prefetching from various levels of the memory hierarchy.
5.2.2 Combination With Other Tools
As a new tool, HMTT system is a complementary tool to binary instrumentation and full system simulation with software rather than a thorough substitution. Since it is running in real-time and in real systems, the combination with different techniques would be more efficient for architecture and application research.
Combination with simulators: to combine with simulators, the HMTT system can be used to collect trace from real systems, including multicore platform. Then, the trace is analyzed for finding new insights. Some new optimization mechanisms based on new insights can be evaluated by simulators.
Combination with binary instrumentation: In fact, the tracing-control software is an instance of the combination of hardware snooping and source code instrumentation. Further, we can adopt binary instrumentation to insert tracing-control codes into binary files to identify functions/loops/blocks. In addition, with compiler-provided symbol table, the virtual-address trace can be used for semantic analysis.
6 Case Studies
In this section, we will present several case studies on two different platforms, an Intel Celeron machine and an AMD Opteron machine respectively. The case studies are: (1) OS impact on stream-based access; (2) multicore impact on memory controller; (3) characterization of DMA memory reference.
We have performed experiments on two different machines listed in Table II. It should be noted that the HMTT system can be ported to various platforms, including multicore platforms, because it mainly depends on DIMM. We have studied memory behaviors of three classes of benchmarks including (See Table II): computing intensive applications (SEPC CPU2006 and SPEC CPU2000 with reference input sets), OS intensive applications (OpenOffice and Realplayer), Java Virtual Machine applications (SPECjbb 2005), and I/O-intensive applications (File-Copy, SPECWeb 2005 and TPC-H).
| Machine 1 | Machine 2 | |
|---|---|---|
| CPU | Intel Celeron 2.0GHz | AMD Opteron |
| Dual Core 1.8GHz | ||
| L1 I-Cache | 12K,6op/Line | 64KB,64B/Line |
| L1 D-Cache | 8KB,4-Way,64B/Line | 64KB,64B/Line |
| L2 Cache | 128KB,2-Way,64B/Line | 1MB,16-Way,64B/Line |
| Memory | Intel 845PE | Integerated |
| Controller | ||
| DRAM | 512MB,DDR-200 | 4GB,DDR-200 |
| Dual-Channel | ||
| Hardware | None | Yes |
| Counter | ||
| Hardware | None | Sequential Prefetcher |
| Prefetcher | in Memory Controller | |
| OS | Fedora Core 4(2.6.14) | Fedora 7(2.6.18) |
| 1.SPEC CPU 2000 | 1. SPEC CPU 2006 | |
| Application | 2.SPECjbb 2005 | 2. File-Copy: 400MB |
| 3.OpenOffice: 25MB slide | 3. SPECWeb 2005 | |
| 4.RealPlayer: 10m video | 4. Oracle + TPC-H |
6.1 OS Impact on Stream-Based Access
Stream-based memory accesses, also called fixed-stride access, can be used by many optimization approaches, such as prefetching and vector loads. Here, we define a metric of Stream Coverage Rate (SCR) as the proportion of stream-based memory accesses in application s total accesses:
| (1) |
Previous works have proposed several stream prefetchers in cache or memory controller [13][28][30][37][40]. However, these proposed techniques are all based on physical address and little research has focused on impact of virtual address on stream-based access. Although Dreslinski et al [22] have pointed the negative impact of not accounting for virtual page boundaries in simulation, they still adapted a non-full system simulator to perform experiments because of the long period of time to simulate a system in steady state. Existing research methods have prohibited further investigations into the impact of OS’s virtual memory management on prefetching. In this case, we have used the HMTT system to reveal this issue in a real system (Intel Celeron Platform).
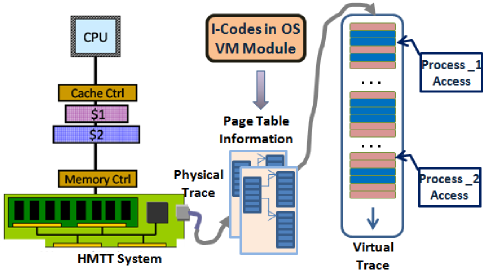
Before presenting the case study, we introduce how to use the HMTT system to collect virtual memory trace. As Figure 9 shown, we insert some I-Codes into Linux kernel’s virtual memory management module to track each page table entry update. The data is stored in the form of pid, phy_page, virt_page, page_table_entry_addr which indicates that a mapping physical page phy_page to virtual page virt_page is created for process pid, and this mapping information is stored in the location of page_table_entry_addr. Thus, given a physical address, the corresponding process and virtual address can be retrieved from the page table information. The I-Codes are also responsible for synchronization with physical memory trace by referencing the HMTT’s configuration space. In this way, we are able to analyze specified process’s virtual memory trace.
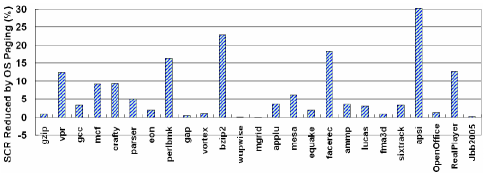

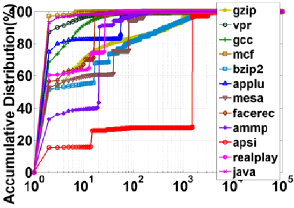
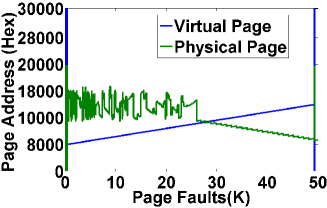
In order to evaluate application’s SCR, we adopt an algorithm proposed by Mohan et al [34] to detect stream among L2 cache misses in cache line level. Figure 11 shows the physical and virtual SCRs detected with different scan-window sizes. As shown in Figure 11, most applications’ SCRs are more than 40% under a 32-entry window (The following studies are based on the 32-entry window). Figure 10 illustrates the portion of SCR reduced due to OS’s virtual memory management. We can see that the OS’s influence varies relying on different applications. Among all 25 applications, the reduction of 15 applications’ SCRs is not significantly, less than 5%, but there are also 8 applications approaching or exceeding 10%. As a specifical case, the SCR of ”apsi” is reduced by 30.2%. We selected several applications to investigate the reason of the phenomena. Figure 12(a) shows the CDF of these applications’ stream strides where most applications’ strides are less than 10, within one page. The short strides indicate that most streams have good spatial locality and also indicate that OS page mapping may slightly influence the SCRs when streams are within one physical page. Nevertheless, most strides of the 301.apsi application are quite large. For example, they is mainly over 64KB (64B*1000), covering several 4KB-size pages. Figure 12(b) illustrates the apsi’s virtual-to-physical page mapping information where virtual pages are absolutely contiguous but their corresponding physical pages are non-contiguous.
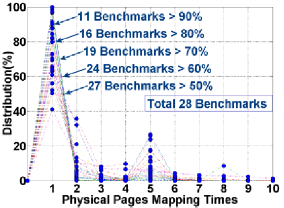
We can find an interesting observation from Figure 12(c) that most physical pages are mapped to virtual pages only once during application’s entire execution lifetime. This observation implies that either application’s working set has long lifetime or memory capacity is enough so that reusing physical pages is not required. Thus, to remove the negative impact of virtual memory management on stream-based access, OS can pre-map a region where both virtual and physical addresses are linear. For example, OS can allocate memory within this linear region when applications call malloc library function. If the region has no space, OS could determine to either reclaim free space for the region or allocate in common method.
6.2 Multicore Impact on Memory Controller
Programs run on multicore system can concurrently generate memory access requests. Although L1 cache, TLB etc are usually designed to be core’s private resources, some resources remain sharing by multiple cores. For example, memory controller is a shared resource existing in almost all prevalent multicore processors. Thus, memory controller can receive concurrent memory access requests from different cores (process/thread). In this case, we will investigate the impact of multicore on memory controller on the AMD Opteron dual cores system by the HMTT system. The traces are collected in the same method as shown in Figure 9, which is depicted in last section .
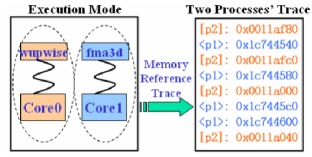
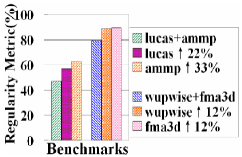
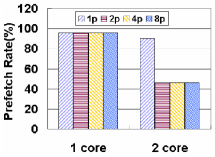
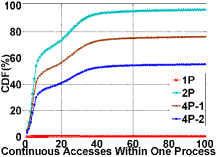
Figure 13(a) illustrates a slice of memory trace of two concurrent processes, i.e. wupwise and fma3d, where the phenomenon of interleaved memory access is intuitively obvious. We detect ”Stream Coverage Rate (SCR)” of the two-process mixed trace and find that the SCR can is about 46.9% and 79.3% for lucas+ammp and wupwise+fma3d respectively. Because the memory traces collected by the HMTT system contain process information, we are able to detect SCR of individual process’s memory accesses. In this way, we evaluate the potential of process-aware detection policy at memory controller level. Figure 13(b) shows that the SCRs of lucas and ammp increase to 56.9% and 62.6% respectively, as are the SCRs of wupwise and fma3d.
Further, we adopt micro-benchmarks to investigate the effect of AMD’s sequential prefetcher in memory controller. We use performance counters to collect statistic of two events, i.e. DRAM_ACCESSES which indicates the number of memory requests issued by memory controller and DATA_PREFETCHES which indicates the number of prefetching requests issued by sequential prefetcher. Here, we define a metric of Prefetch_Rate as the proportion of prefetching requests in total memory accesses:
| (2) |
It should be noted that the sequential prefetcher can issue prefetching requests only after it detects three contiguous accesses. Thus, the Prefetch_Rate also implies the ”Stream Coverage Rate (SCR)” detected by the prefetcher.
We run a micro-benchmark to sequentially read a linear 256MB physical memory region. Since our experimental AMD Opteron processor has two cores, we disable one core to emulate one-core environment by Linux’s tool. Intuitively, an ideal sequential prefetcher should achieve a Prefetch_Rate of near 100%. As shown in Figure 13(c), this ideal case exists in one-core environment no matter how many processes run concurrently. However, in the two-core environment, the Prefetch_Rate of one-precess case is still over 90% but it sharply decrease to 46% when running two or more processes concurrently. We further investigate the phenomenon by analyzing memory trace. Figure 13(d) shows the CDF of one process’ continuous memory accesses before interfered by another process. We can find that when two processes run concurrently, in most cases (over 95%) memory controller can only handle less than 40 memory access requests of one process and then will be interrupted to handle another process’ requests. For the case of running one process, memory controller can handle over 1000 memory access requests of the process and then be interrupted to handle other requests. These experiments reveal that the interference of memory accesses from multiple cores (i.e., processes/threads) is serious.
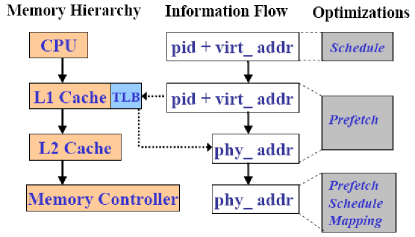
In a word, although prefetcher has been integrated into memory controller for optimizing memory system performance, it cannot produce an expected effect if not consider the multicore’s impact. Usually, optimization requires request information. Figure 14 shows a traditional memory access information flow in a common memory hierarchy. We can find that memory access information is continually reduced when a request passes from high memory hierarchy level to low level. For example, after TLB’s address translation, L2 cache and memory controller can only obtain physical address information. So if more information (e.g., core-id, virtual address) could be passed through the memory hierarchy, those optimization techniques for low-level hierarchies (L2/L3 cache and memory controller) should gain better effect.
6.3 Characterization of DMA Memory Reference
I/O accesses are essential on modern computer systems, whenever we load binary files from disks to memory or download files from network. DMA technique is used to release processor from I/O process, which provides special channels for CPU and I/O devices to exchange I/O data. However, as the throughput of the I/O devices grows rapidly, memory data moving operations have become critical for DMA scheme, which becomes a performance bottleneck for I/O operations. In this case, we will investigate the characterization of DMA memory reference.
First, we introduce how to collect DMA memory reference trace. To distinguish a memory reference issued by DMA engine or processor, we have inserted I-Codes into the device drivers of hard disk controller and network interface card (NIC) on Linux platform. Figure 15 illustrates the memory trace collection framework. When the modified drivers allocate and release DMA buffers, the I-Codes record start address, size and owner information of a DMA buffer. Meanwhile, they send synchronization tags to the HMTT system’s configuration space. When the HMTT system receives synchronization tags, it injects tags (DMA_BEGIN_TAG or DMA_END_TAG) into physical memory trace to indicate that those memory references between the two tags and within the DMA buffer s address region are DMA memory references initiated by DMA engine. The status information of DMA requests, such as start address, size and owner, is stored in a reserved kernel buffer and is dumped into a file after memory trace collection is completed. Thus, there is no interference of additional I/O access. In this way, we can differentiate DMA memory reference from processor memory reference by merging physical memory trace and status information of DMA requests. In this case, we run all the benchmarks on the AMD server machine and use the HMTT system to collect memory reference traces of three real applications (file-copy, TPC-H, and SPECweb2005).
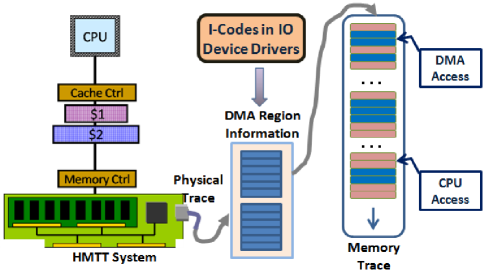
Table III shows the percentages of DMA memory references in various benchmarks. In Table III we can see that the file-copy benchmark has nearly the same percentage of DMA read references (15.4%) and DMA write references (15.6%), and the sum of two kinds of DMA memory references is about 31%. For TPC-H benchmark, the percentage of all DMA memory references is about 20%. The percentage of DMA write references (19.9%) is about 200 times of that of DMA read references (0.1%) because the dominant I/O operations in TPC-H is transferring data from disk to memory (i.e., DMA write request). For SPECweb2005, the percentage of DMA memory references is only 1.0%. Because the size of network I/O requests (including a number of DMA memory references) is quite small, processor is busy with handling interrupts.
| File Copy | TPC-H | SPECweb2005 | |
|---|---|---|---|
| CPU Read | 45% | 60% | 75% |
| CPU Write | 24% | 20% | 24% |
| DMA Read | 15.4% | 0.1% | 0.76% |
| DMA Write | 15.6% | 19.9% | 0.23% |
Table IV and Figure 16 depict the average size of DMA requests and the cumulative distributions of the size of DMA requests for three benchmarks respectively (one DMA request includes a number of DMA memory references with 64 bytes). For file-copy and TPC-H benchmarks, all DMA write requests are less than 256KB and the percentage of those requests with the size of 128KB is about 76%. The average sizes of DMA write requests are about 110KB and 121KB for file-copy and TPC-H respectively. For SPECweb2005, the size of all DMA requests issued by NIC are smaller than 1.5KB because the maximum transmission unit (MTU) of Gigabit Ethernet frame is only 1518 bytes. The size of DMA requests issued by IDE controller for SPECweb2005 is also very small, an average of about 10KB.
| Request Type | % | Avg Size | |
|---|---|---|---|
| File | Disk DMA Read | 49.9 | 393KB |
| Copy | Disk DMA Write | 50.1 | 110KB |
| TPC-H | Disk DMA Read | 0.5 | 19KB |
| Disk DMA Write | 99.5 | 121KB | |
| Disk DMA Read | 24.4 | 10KB | |
| SPECweb | Disk DMA Write | 1.7 | 7KB |
| 2005 | NIC DMA Read | 52 | 0.3KB |
| NIC DMA Write | 21.9 | 0.16KB |
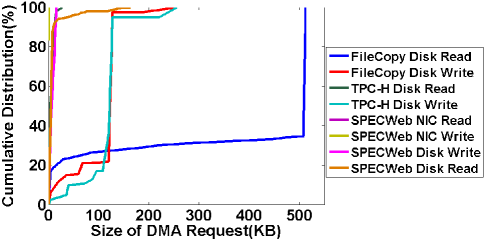
It should be noted that some studies have focused on reducing the overhead of additional memory copy operations for I/O data transfer, such as Direct Cache Access (DCA) [27]. However, their study focuses on network traffics and shows that the DCA scheme has poor performance for applications that have intensive disk I/O traffics (e.g. TPC-C). Our evaluations have shown this is because sizes of disk DMA requests (100+KB) are larger than those of network (1KB). Therefore, disk I/O data can cause serious cache interference. We will further analyze and optimize I/O memory access in our future work.
6.4 Summary of Case Studies
In this section, we have present three case studies to demonstrate the widespread and effective use of the HMTT system. It should be noted that although we insert these I-Codes into OS modules and device drivers manually in the three case studies, we are enhancing the HMTT system by integrating binary instrumentation into it. In this way, the HMTT system is able to collect information from binary files. Overall, the case studies have shown the HMTT System, which adopts the hybrid hardware/software tracing mechanism, is a feasible and convincing memory trace monitoring system.
7 Related Work
There are several areas of effort related to memory trace monitoring: software simulators, binary instrumentation, hardware counters, hardware monitors and hardware emulators.
Software simulators: Most memory performance and power researches are based on simulators. They utilize cycle-accurate simulators to generate memory trace and then feed trace to tracedriven memory simulators (e.g. DRAMSim [43], MEMsim [38]). SimpleScalar [8] is a popular user-level simulator, but it can not run operating system for analysis of full system behaviors. Several full system simulators (such as SimOS [39], Simics [33], M5 [4], BOCHS [1] and QEMU [17]), which can boot commercial operating systems, are commonly used in research when deal with OS-intensive applications. However, software simulators usually have speed and scalability limitations. As the computer architectures become more and more sophisticated, more detail simulation models are need, which may lead to a slowdown of 1000X10000X [15]. Moreover, simulation with complex multicore and multi-threaded applications may incur inaccuracies and could lead to misleading conclusions [35].
Binary instrumentation: Many binary instrument tools (e.g. O-Profile [5], ATOM [41], DyninstAPI [2], Pin [6], Valgrind [10], Nirvana [18] etc.) are popularly utilized to profile applications. They are able to obtain applications virtual access trace even without source codes. Nevertheless, few of them can provide full system memory trace because instrumenting kernels is very tricky. PinOS [20] is an extension of the Pin [6] dynamic instrumentation framework for full-system instrumentation. It is built on top of the Xen [14] virtual machine monitor with Intel VT [36] technology and, is able to instrument both kernel and user-level code. However, PinOS can only run on IA-32 in uni-processor mode. Moreover, binary instrumentation method usually slows down target programs execution, incurring time distortion and memory access interference.
Hardware counters: Hardware counters are able to provide accurate events statistic (e.g. Cache Miss, TLB Miss, etc.). Itanium2 [29] is even able to collect trace via sampling. The approach of hardware counters is fast, low overhead, but they can not track complete and detailed memory reference trace.
Hardware monitors: Various Hardware monitors, divided into two classes, are able to monitor memory trace online. One class is pure trace collectors, and another is online cache emulators. BACH [23][24] is a trace collector. It utilizes a logic analyzer to interface with host system and to buffer the collected traces. When the buffer is full, the host system is halted by an interrupt and the trace is moved out. Then, the host system continues to execute programs. BACH is able to collect traces from long workload runs. However, this halting mechanism may alter original behavior of programs. The hardware-based online cache emulation tools (such as MemorIES [35], PHA$E [21], RACFCS [47], ACE [26], and HACS [45]) are very fast and have low distortion and no slowdown. Logic analyzer is also a powerful tool for capturing signals (including DRAM signals) and can be very useful for hardware testing and debugging.
However, these hardware monitors have several disadvantages: (1) they (except BACH) are not able to dump full mass trace but only produce short traces due to small local memories; (2) there is a semantic gap problem for hardware monitors because they can only collect physical address; (3) they depend on proprietary interfaces, for example, MemorIES relies on the IBM s 6xx bus, BACH, PHA$E, ACE, HACS etc. adopt logic analyzer which is quite expensive. RACFCS use a latch board that directly connects to output pins of specified CPUs. So they have poor portability.
Hardware emulators: Several hardware emulators are thorough FPGA-based systems which utilize a number of FPGAs to construct uni-processor/multi-processor research platforms to accelerate research. For example, RPM [16] emulates the entire target system within its emulator hardware. Intel proposed an FPGA-based Pentium system [32] which is an original Socket-7 based desktop processor system with typical hardware peripherals running modern operating systems. RAMP [7] is also a new scheme for architecture research. Although they do not produce any memory traces currently, they are capable of tracking full system trace. But they can only emulate a simplified and slow system with relative fast I/O, which enlarges the CPU-memory / memory-disk gaps that may be bottlenecks in real systems.
8 Conclusion
In this paper we propose a hybrid hardware/software mechanism which is able to collect memory reference trace as well as semantic information. Based on this mechanism, we have designed and implemented a prototype system called HMTT (Hybrid Memory Trace Tool) which adopts a DIMM-snooping mechanism to snoop on memory bus and a software-controlled trace injection mechanism capable of injecting semantic information into normal memory trace. Comprehensive validations show that the HMTT system is a feasible and convincing memory trace monitoring system. Several case studies show that it is also effective and widespread. Thus, the HMTT system demonstrates that the hybrid tracing mechanism can leverage both hardware’s (e.g., no distortion or pollution) and software’s advantages (e.g., flexibility and more information). Moreover, this hybrid mechanism can be adopted by other tracing systems.
References
- [1] Bochs. http://bochs.sourceforge.net/.
- [2] Dyninstapi. http://www.dyninst.org/.
- [3] Linux trace toolkit next generation. http://ltt.polymtl.ca/.
- [4] M5. http://m5.eecs.umich.edu/.
- [5] O-profile. http://oprofile.sourceforge.net/.
- [6] Pin. http://rogue.colorado.edu/pin/.
- [7] Ramp. http://ramp.eecs.berkeley.edu/.
- [8] Simplescalar 3.0. http://www.simplescalar.com/.
- [9] Spec cpu 2006 benchmarks. http://www.spec.org/cpu2006/.
- [10] Valgrind. http://valgrind.org/.
- [11] Double data rate (ddr) sdram specification. JEDEC SOLID STATE TECHNOLOGY ASSOCIATION, 2004.
- [12] Ddr2 sdram specification. JEDEC SOLID STATE TECHNOLOGY ASSOCIATION, 2006.
- [13] J.-L. Baer and T.-F. Chen. Effective hardware-based data prefetching for high-performance processors. IEEE Trans. Comput., 44(5):609–623, 1995.
- [14] P. Barham, B. Dragovic, K. Fraser, S. Hand, T. Harris, A. Ho, R. Neugebauer, I. Pratt, and A. Warfield. Xen and the art of virtualization. In Proceedings of the nineteenth ACM symposium on Operating systems principles, pages 164–177, 2003.
- [15] L. A. Barroso. Design and evaluation of architectures for commercial applications. Technical report, Western Research Laboratory, 1999.
- [16] L. A. Barroso, S. Iman, J. Jeong, K. Öner, M. Dubois, and K. Ramamurthy. Rpm: A rapid prototyping engine for multiprocessor systems. Computer, 28(2):26–34, 1995.
- [17] F. Bellard. Qemu, a fast and portable dynamic translator. In Usenix Annual Technical Conference, 2005.
- [18] S. Bhansali, W.-K. Chen, S. de Jong, A. Edwards, R. Murray, M. Drinić, D. Mihočka, and J. Chau. Framework for instruction-level tracing and analysis of program executions. In Proceedings of the 2nd international conference on Virtual execution environments, pages 154–163, New York, NY, USA, 2006. ACM.
- [19] R. Bryant and J. Hawkes. Lockmeter: highly-informative instrumentation for spin locks in the linux®kernel. In Proceedings of the 4th annual Linux Showcase & Conference, pages 17–17, Berkeley, CA, USA, 2000. USENIX Association.
- [20] P. P. Bungale and C.-K. Luk. Pinos: A programmable framework for whole-system dynamic instrumentation. In Proceedings of the 3rd international conference on Virtual execution environments, pages 137–147, 2007.
- [21] N. Chalainanont, E. Nurvitadhi, R. Morrison, L. Su, K. Chow, S.-L. Lu, and K. Lai. Real-time l3 cache simulations using the programmable hardware-assisted cache emulator (pha$e). In IEEE 6th Annual Workshop on Workload Characterization, pages 86–95, Corvallis, OR, USA, 2003. IEEE.
- [22] R. G. Dreslinski, A. G. Saidi, T. Mudge, and S. K. Reinhardt. Analysis of hardware prefetching across virtual page boundaries. In Proceedings of the 4th international conference on Computing frontiers, pages 13–22, New York, NY, USA, 2007. ACM.
- [23] J. K. Flanagan, B. E. Nelson, J. K. Archibald, and K. Grimsrud. Bach: Byu address collection hardware, the collection of complete traces. In Proc. of the 6th Int. Conf on Modelling Techniques and Tools for Computer Performance Evaluation, pages 128–137, 1992.
- [24] K. Grimsrud, J. Archibald, M. Ripley, K. Flanaga, and B. Nelson. Bach: a hardware monitor for tracing microprocessor-based sytems. Microprocessors and Microsystems, 17(6), 1993.
- [25] J. Grossman. A systolic array for implementing lru replacement. Technical report, AI Lab, MIT, 2002.
- [26] J. Hong, E. Nurvitadhi, and S.-L. L. Lu. Design, implementation, and verification of active cache emulator (ace). In Proceedings of the 2006 ACM/SIGDA 14th international symposium on Field programmable gate arrays, pages 63–72, New York, NY, USA, 2006. ACM.
- [27] R. Huggahalli, R. Iyer, and S. Tetrick. Direct cache access for high bandwidth network i/o. In Proceedings of the 32nd annual international symposium on Computer Architecture, pages 50–59, Washington, DC, USA, 2005.
- [28] I. Hur and C. Lin. Memory prefetching using adaptive stream detection. In Proceedings of the 39th Annual IEEE/ACM International Symposium on Microarchitecture, pages 397–408, Washington, DC, USA, 2006. IEEE Computer Society.
- [29] Intel Corp. Intel Itanium2 Processor-Reference Manu, 2004.
- [30] N. P. Jouppi. Improving direct-mapped cache performance by the addition of a small fully-associative cache and prefetch buffers. SIGARCH Comput. Archit. News, 18(3a):364–373, 1990.
- [31] J. Lin, H. Zheng, Z. Zhu, H. David, and Z. Zhang. Thermal modeling and management of dram memory systems. In Proceedings of the 34th annual international symposium on Computer architecture, pages 312–322, New York, NY, USA, 2007. ACM.
- [32] S.-L. L. Lu, P. Yiannacouras, R. Kassa, M. Konow, and T. Suh. An fpga-based pentium®in a complete desktop system. In Proceedings of the 2007 ACM/SIGDA 15th international symposium on Field programmable gate arrays, pages 53–59, New York, NY, USA, 2007. ACM.
- [33] P. S. Magnusson, M. Christensson, J. Eskilson, D. Forsgren, G. Hallberg, J. Hogberg, F. Larsson, A. Moestedt, and B. Werner. Simics: A full system simulation platform. IEEE Computer, Feb. 2002.
- [34] T. Mohan, B. R. de Supinski, S. A. McKee, F. Mueller, A. Yoo, and M. Schulz. Identifying and exploiting spatial regularity in data memory references. In Proceedings of the 2003 ACM/IEEE conference on Supercomputing, page 49, Washington, DC, USA, 2003. IEEE Computer Society.
- [35] A. Nanda, K.-K. Mak, K. Sugarvanam, R. K. Sahoo, V. Soundarararjan, and T. B. Smith. Memories: a programmable, real-time hardware emulation tool for multiprocessor server design. In Proceedings of the ninth international conference on Architectural support for programming languages and operating systems, pages 37–48, New York, NY, USA, 2000. ACM.
- [36] G. Neiger, A. Santoni, F. Leung, D. Rodgers, and R. Uhlig. Intel virtualization technology: Hardware support for efficient processor virtualization. Intel Technology Journal, 10, August 2006.
- [37] S. Palacharla and R. E. Kessler. Evaluating stream buffers as a secondary cache replacement. SIGARCH Comput. Archit. News, 22(2):24–33, 1994.
- [38] K. Rajamani. Memsim users’ guide. Technical report, IBM, 2000.
- [39] M. Rosenblum, S. A. Herrod, E. Witchel, and A. Gupta. Complete computer system simulation: The simos approach. IEEE parallel and distributed technology: systems and applications, 3(4):34–43, Winter 1995.
- [40] A. Smith. Sequential program prefetching in memory hierarchies. IEEE Transactions on Computers, 1978.
- [41] A. Srivastava and A. Eustace. Atom: a system for building customized program analysis tools. In Proceedings of the ACM SIGPLAN 1994 conference on Programming language design and implementation, pages 196–205, New York, NY, USA, 1994. ACM.
- [42] R. A. Uhlig and T. N. Mudge. Trace-driven memory simulation: a survey. ACM Comput. Surv., 29(2):128–170, 1997.
- [43] D. Wang, B. Ganesh, N. Tuaycharoen, K. Baynes, A. Jaleel, and B. Jacob. Dramsim: A memory system simulator. Computer Architecture News, 33(4):20–24, Sept. 2005.
- [44] Z. Wang, D. Burger, K. S. McKinley, S. K. Reinhardt, and C. C. Weems. Guided region prefetching: A cooperative hardware/software approach. In Proceedings of the 30th annual international symposium on Computer architecture, pages 388–398, 2003.
- [45] M. Watson and J. Flanagan. Simulating l3 caches in real time using hardware accelerated cache simulation (hacs): A case study with specint 2000. In Proceedings of the 14th Symposium on Computer Architecture and High Performance Computing (SCAB-PAD’02), page 108, Washington, DC, USA, 2002. IEEE Computer Society.
- [46] W. A. Wulf and S. A. McKee. Hitting the memory wall: Implications of the obvious. Computer Architecture News, 23(1):20–24, March 1995.
- [47] H.-M. Youn, G.-H. Park, K.-W. Lee, T.-D. Han, S.-D. Kim, and S.-B. Yang. Reconfigurable address collector and flying cache simulator. In Proc. High Performance Computing Asia, 1997.
- [48] L. Zhang, Z. Fang, M. Parker, B. K. Mathew, L. Schaelicke, J. B. Carter, W. C. Hsieh, and S. A. McKee. The impulse memory controller. IEEE Trans. Comput., 50(11):1117–1132, 2001.
Appendix A HMTT’s Verification and Evaluation
A.1 Verification
The HMTT system is verified in four steps:
1) As a basic verification, we have checked the physical address trace tracked by the monitoring board (MTB) with micro benchmarks which generate sequential reads, sequential writes, sequential read-after-writes and random reads in various unites from cache line to page size. The test results show that there are no incorrect physical addresses.
2) A comparison with performance counter (use O-Profile [5] with DRAM_ACCESS event) is illustrated in Figure 18. Note that the axis represent 29 programs of SPECCPU2006 [9]. Through the figure, differences of memory access numbers acquired by HMTT and performance counter respectively are mostly less than 1%, mainly incurred in initialization and finalization phases.

3) The following two steps are to verify software parts of the HMTT system. Here, we present a case of virtual address trace verifications. To obtain virtual address trace, we adopt an assistant kernel module to collect page table information. We have replayed virtual memory trace to verify if physical addresses and virtual address are corresponding. Figure 19 shows an example of quicksort s virtual memory reference trace with an input of 100,000,000 integers. Figure 19(b) shows the virtual address space and its corresponding physical address space of quicksort s data segment collected by the kernel module. The virtual address region is linear but the physical address region is discrete. Figure 19(a) shows a piece of virtual memory trace, which presents the exact reference pattern of quicksort. Moreover, the address space region (0xA28000xA5800) also belongs to the virtual address space of data segment (0xA00000xC0000) (Figure 19(b)).

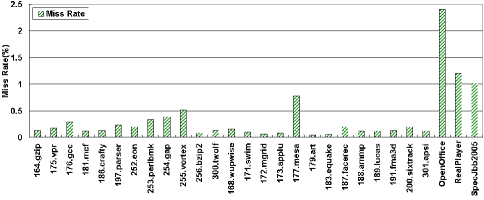
4) Figure 17 shows miss rates which indicate the portion of those physical addresses that cannot be translated to virtual addresses. These ”misses” are generated due to some I/O operations which are performed without page mapping. As Figure 17 shown, the miss portions of SPECCPU are nearly all less than 0.5%, while those applications with more I/O accesses have miss portions of over 1%. Note that we also introduce other I-Codes (see figure 4) to further distinguish I/O memory reference, which will be discussed later.
The above verification works show that the HMTT system is a feasible and convincing memory tracing system.
A.2 Evaluations
The trace bandwidth is a crucial issue for the HMTT system. We first adopt a mathematical method to analyze the trace bandwidth issue. We let BW denote trace bandwidth, cmdfrq denote the frequency of DDR read/write commands 111Note that trace is only generated on read/write commands., tracenum denote the number of trace generated upon each DDR command and bitwidth denote the bitwidth of each trace. Then we can calculate the trace bandwidth in the following equation:
| (3) |
Next, we will present how to determine the values of the three parameters. According to the timing diagram from JEDEC specification [12], we can find that the maximal frequency of DDR read/write command is dependent on the parameter of CAS-CAS delay time (tCCD). On the other hand, read and write accesses to the DDR2 SDRAM are burst oriented, which means that accesses start at a selected location and continue for a burst length (BL) of four or eight in a certain sequence. Thus, we can get that:
| (4) |
In practise, BL (Burst Length) is larger than 2*tCCD222For DDR/DDR2, usually BL is equal to 4 or 8 and the tCCD is equal to 2. For DDR3, tCCD is equal to be 4.. So we can calculate the data transferred on memory bus upon each read/write command as BL*. Because most memory controllers handle memory requests to read/write whole cache line which can be identified as one memory trace, the parameter of tracenum denoting the number of trace generated upon each read/write command can be calculated as follows:
| (5) |
Since BL 2*tCCD, Equation (3) is rewritten:
| (6) |
For instance, when we set trace bitwidth to be 40 bits, the trace bandwidth for a dual-channel DDR2-400 machine with 128-bit memory bus and 64-byte cache line can be calculated as follows:
| (7) |
It should be noted that this is the peak trace bandwidth. In practise, because applications have occasional burst memory access phases, we find that it is sufficient to adopt a 16K-entry FIFO to buffer traces and three Gigabit Ethernet interfaces in the HMTT system to send memory trace.
In hundreds of experiments, we have verified that bandwidths of 3Gb/s and 1Gb/s are sufficient for DDR2-400 and DDR-200 respectively. Table V illustrates trace generation bandwidth of various applications on two DDR-200MHz machine machines (SPECCPU2000, desktop and server applications are on an Intel Celeron machine and SPECCPU2006 is on an AMD Opteron machine). The bandwidth varies from 5.7MB/s (45.6Mbps) to 72.9MB/s (583.2Mbps) on Intel platform, and from 0.1MB/s (0.8Mbps) to 106.8MB/s (854.4Mbps) on AMD platform. This indicates that a bandwidth of 1Gb/s is sufficient for the HMTT system to capture all applications traces on Intel platform and most applications traces on AMD platform. However, the high frequency of DDR2/DDR3 memory and prevalent multi-channel memory technology increase trace data generation bandwidth. Therefore, the HMTT system supports three Gigabit Ethernet interfaces currently and will adopt PCI-E inerface to provide a bandwidth of 10Gb/s to overcome the bandwidth problem.
| Appication | BW | Appication | BW | ||
| (MB/s) | (MB/s) | ||||
| S | 164.gzip | 33.9 | S | 168.wupwise | 24.6 |
| P | 165.vpr | 44.9 | P | 171.swim | 65.8 |
| E | 176.gcc | 44.5 | E | 172.mgrid | 48.0 |
| C | 181.mcf | 63.4 | C | 173.applu | 47.9 |
| 2 | 186.crafty | 27.3 | 2 | 177.mesa | 11.2 |
| 0 | 197.parser | 36.1 | 0 | 179.art | 72.9 |
| 0 | 252.eon | 8.7 | 0 | 183.equake | 58.3 |
| 0 | 253.perlbmk | 24.0 | 0 | 187.facerec | 34.4 |
| C | 254.gap | 29.3 | C | 188.ammp | 46.4 |
| I | 255.vortex | 32.8 | F | 189.lucas | 41.7 |
| N | 256.bzip2 | 36.7 | P | 191.fma3d | 33.8 |
| T | 300.twolf | 48.7 | 200.sixtrack | 5.7 | |
| * | OpenOffice | 10.5 | 301.apsi | 44.4 | |
| RealPlayer | 22.2 | 410.bwaves | 42.98 | ||
| @ | SPECjbb2005 | 41.3 | 416.gamess | 0.50 | |
| S | 400.perlbench | 8.27 | 433.milc | 96.54 | |
| P | 401.bzip2 | 33.60 | S | 434.zeusmp | 34.14 |
| E | 403.gcc | 85.48 | P | 435.gromacs | 4.92 |
| C | 429.mcf | 46.71 | E | 436.cactusADM | 24.36 |
| 2 | 445.gobmk | 11.00 | C | 437.leslie3d | 84.84 |
| 0 | 456.hmmer | 19.29 | 2 | 444.namd | 1.19 |
| 0 | 458.sjeng | 4.84 | 0 | 447.dealII | 32.80 |
| 6 | 462.libquantum | 102.04 | 0 | 450.soplex | 69.39 |
| C | 464.h264ref | 9.02 | 6 | 453.povray | 0.10 |
| I | 461.omnetpp | 60.14 | C | 454.calculix | 3.67 |
| N | 473.astar | 31.16 | F | 459.GemsFDTD | 87.94 |
| T | 483.xalancbmk | 29.16 | P | 465.tonto | 26.06 |
| * – Desktop App | 470.lbm | 106.82 | |||
| @ – Server App | 481.wrf | 44.80 | |||
| 482.sphinx3 | 71.78 | ||||
The overheads of the HMTT system include trace size, additional memory references, execution time of I-Codes and kernel buffer for collecting extra kernel data. Because applications usually generate billions of traces during their execution periods, most trace sizes are more than 10GB. The trace size is quite large, and large capacity disks are demanded. Fortunately, it should not be a problem because the disks are becoming larger and cheaper. On the other hand, Figure 4 illustrates that the HMTT system adopt I-Codes to generate specific memory reference and collect extra kernel data. In fact, there is almost no additional execution time while I-Codes only generate specific memory references because those specific memory references are less than one thousand of normal memory references. For example, we have experimented on an AMD machine and observed that applications’ execution time is increased by less than 1% when I-Codes collect page table data upon every page fault. To collect page table data, the assistant kernel module requires to allocate a buffer which is less than 0.5% of total memory of traced system. Furthermore, these specific buffers cannot induce significant influence because those references to the specific buffers can be filtered.