THE SEARCH FOR EXTRAGALACTIC LITHIUM HYDRIDE
Abstract
We have conducted Combined Array for Research in Millimeter-wave Astronomy (CARMA) observations of LiH, in absorption, toward three quasars. These quasars, B0218+357, PKS1830-211 and PKS0201+113, have redshifts of , and shift the LiH transition to the 1 mm and 3mm wavelength bands, where atmospheric absorption is sharply reduced from that predominating near the rest frequency of 443 GHz. We report a 3 detection of LiH toward B0218+357 with a column density of cm-2 and place an upper limit on the 6Li/7Li ratio of . LiH was not detected toward any other source.
1 Introduction
Big bang nucleosynthesis (BBN) remains our earliest probe of the universe, and plays a central role in post-WMAP cosmology. Light element observations and BBN theory measure the cosmic baryon density ( ); comparison with the independent WMAP measure of fundamentally tests the hot big bang (Spergel et al., 2003; Larson et al., 2011). The result: deuterium observations spectacularly agree with WMAP, as does helium; in sharp contrast, the predicted primordial Li is a factor 2 above the best estimates of the Li abundance in Galactic halo star atmospheres (Cyburt et al., 2003; Coc et al., 2004; Cyburt et al., 2008). This discrepancy, between the CMB-predicted primordial Li and the stellar abundance determinations, is the primordial lithium problem.
The lithium problem and possible solutions have recently been reviewed by Fields (2011) and Pospelov & Pradler (2010). A serious possibility is that nonstandard processes occurred during primordial nucleosynthesis, altering the lithium abundance; dark matter decays can do this (Jedamzik et al., 2006). A signature which would test this scenario is the production of the 6Li isotope at levels 6Li/7Li (Pospelov, 2007; Cyburt et al., 2006), a ratio orders of magnitude larger than is found in standard BBN. Indeed, recent observations of lithium isotopes in halo stars suggest 6Li at these levels (Asplund et al., 2006). However, these results are highly controversial due to the difficulty of extracting isotope ratios from the thermally-broadened 6707 Å Li I line.
The lithium problem may be even worse if there are additional sources of Li which leave traces in the halo stars where Li is observed. A very likely source of this kind is Li produced by the interactions of pre-Galactic or “structure formation” cosmic rays (SFCRs) which should be accelerated in cosmic shocks which accompany the infall of baryonic gas onto protogalaxies (e.g. Miniati et al., 2000). The resulting non-primordial 6Li and 7Li production can be significant compared to their primordial levels (Fields & Prodanović, 2005) and would need to be subtracted from halo star abundances to determine the true primordial levels. This both exacerbates the lithium problem but also opens the possibility of using Li abundances in different cosmic environments to probe both the early universe and cosmic-ray acceleration in structure formation.
Lithium also plays a role in the primordial chemistry leading to the formation of the first stars. Namely, the lithium hydride (LiH) molecule (Bougleux & Galli, 1997; Galli & Palla, 1998) contributes to the cooling of the dust-free primordial gas. Current calculations suggest however that the impact of LiH is not dominant due to the small primordial Li/H abundance, but the chemistry of primordial LiH is complex and a subject of ongoing interest (Bovino et al., 2011).
Lithium thus takes a uniquely important role in the cosmology of the early universe. Unfortunately, lithium is difficult to measure due to its tiny abundance: in the solar system, Li/H 10-9, while in metal-poor halo stars, Li/H (1-2)10-10. To date, optical spectroscopy of Galactic stellar atmospheres has been the only probe of Li in the early Galaxy, and stubborn systematic uncertainties could account for the Li problem. Any alternative means of observing Li in any source would be extraordinarily useful for many reasons, not least of which would be the different systematics. Furthermore, to date there are no stellar observations of extragalactic Li, and so any extragalactic information would shed qualitatively new light onto this problem.
Since the atomic lines of Li have been so challenging to observe, we have chosen to search for the simplest Li containing molecule, lithium hydride (LiH). LiH has been searched for previously by Combes & Wiklind (1998) toward B0218+357, where the authors report a tentative detection in a system that is 5 km/s offset from the systemic velocity but within the CO velocity profile.
2 Sources
The LiH molecular isotopomers have a v=0, J=0-1 rotational transition at 443.95293 GHz (7LiH) and 453.16028 GHz (6LiH) (Bellini et al., 1994; Plummer, Herbst, & De Lucia, 1984). This region of the mm-wave spectrum is highly opaque through the atmosphere. However these lines are accessible in the 1 & 3 mm bands at the Combined Array for Research in Millimeter-wave Astronomy (CARMA) for extragalactic sources in redshift ranges of z=0.64-1.1 and 2.85-4.2, respectively.
Our strategy for detecting LiH in these redshift ranges is to search for interstellar LiH absorption toward lensed quasars with high millimeter continuum flux density. The absorption originates from molecular clouds in the lensing galaxy along the line of sight. These galaxies should preferentially exhibit high optical depth in other atomic and/or molecular transitions, including H and CO. There are only a few candidates known to date. The three best candidate lenses which meet these criteria are B0218+357, PKS1830-211, and PKS0201+113. Table 2 lists the source redshift, and red-shifted rest frequencies of our search lines (7LiH, 6LiH, and 13CO).
| Source | z | 7LiHbbThe unshifted rest frequency of the 7LiH transition is 443.95280 GHz | 6LiHccThe unshifted rest frequency of the 6LiH transition is 453.16028 GHz | 13COddThe unshifted rest frequency of the 13CO transition is 440.7651668 GHz | Ref |
|---|---|---|---|---|---|
| B0218+357 | 0.68466 | 263.526648 | 268.992129 | 261.634494 | 1 |
| PKS1830-211 | 0.88582 | 235.416319 | 240.298798 | 233.726001 | 2 |
| PKS0201+113 | 3.387144 | 101.194035 | 103.292775 | 100.467449 | 3 |
2.1 B0218+357
B0218+357 is a gravitational lens with an Einstein ring. The source is a BL Lac object at a redshift z0.94, and appears, at arcsecond resolution, as two distinct point sources in the ring, with a separation of 335 mas, and a weak jet called the “hot spot”(Patnaik et al., 1993; O’Dea et al., 1992; Wiklind & Combes, 1995; Biggs et al., 2003; Cohen et al., 2003). The point sources, A & B, have a flat spectrum, while the Einstein ring has a steep spectrum. They are highly variable on a timescale of a few days and each is separated into at least two subcomponents separated by a few mas (Biggs et al., 2001; Patnaik et al., 1995). The A source is brighter by a factor of 3 in the radio and both have jets (Wiklind & Combes, 1995; Biggs et al., 2001). The lensing source is a spiral galaxy at a redshift of z0.685 (Patnaik et al., 1995; Wiklind & Combes, 1995). Atomic and molecular lines including the 21 cm H line (Carilli et al., 1993), H2CO (Menten & Reid, 1996), H2O, CS (Combes & Wiklind, 1997), CO, HCO+, HCN (Wiklind & Combes, 1995), NH3 (Henkel et al., 2005), OH (Kanekar et al., 2003), H2CO anti inversion (Zeiger & Darling, 2010), and LiH (tentative) (Combes & Wiklind, 1998) have been detected toward the A component. The line center of the LiH tentative detection is off by 5 km/s compared to other detected lines, but within the CO velocity profile (Combes & Wiklind, 1998).
2.2 PKS1830-211
PKS1830-211 was one of the first quasars that was found to be lensed. The source blazar is at a redshift of z2.5 and appears as two bright images in a faint Einstein ring at sub-arcsecond resolution (Lidman et al., 1999; Subrahmanyan et al., 1990). The two images are NW and SE of the lens center and are separated by 1″; the NW component is the brighter of the two (Jin et al., 1999). The images vary in brightness, separation, and size due to a helical jet emanating from the core (Jin et al., 2003; Nair et al., 2005). These variations cause notable changes in absorption line features in the lensing galaxy (Muller & Guélin, 2008). The lens galaxy is a face on spiral at a redshift of z0.886 (Winn et al., 2002; Wiklind & Combes, 1998). One of the spiral arms lies along the line of sight to the SW image and is the primary source of molecular and atomic absorption lines, although a small percentage also originates from the NW source (Winn et al., 2002). Numerous molecular lines have been detected toward PKS1830-211 including CO, HCN, HCO+ (Wiklind & Combes, 1995), CS, H2O (Combes & Wiklind, 1997), N2H+ (Wiklind & Combes, 1998), C2H, HC3N, C3H2 (Menten et al., 1999), NH3 (Henkel et al., 2005), and H2CO (Menten & Reid, 1996).
2.3 PKS0201+113
PKS0201+113 is a radio loud quasar at a redshift of z3.61 (Condon et al., 1977; White et al., 1993). VLBI observations indicate that its linear size is small 40 pc and has a smaller secondary component 2″south (Hodges et al., 1984; Morabito et al., 1986; Stanghellini et al., 1990). The secondary source emits on 1% of the total system flux (at 22 GHz). PKS0201+113 shows damped Lyman along the line of sight, several atomic lines, and 21 cm absorption at z3.387 (White et al., 1993; Oya et al., 1998; Kanekar et al., 2007).
3 Observations
All observations were conducted with the Combined Array for Research in Millimeter-wave Astronomy (CARMA). In all cases the source is unresolved in our beams, and thus appears as a point source. PKS0201+113 was observed in 2008 February when CARMA was in its B configuration giving a typical synthesized beam of 0.880.70″. The coverage of the observations gives projected baselines of 25.2-319.6 k (74.6-946.9 m). All three correlator bands were set up with 62 MHz bandwidths and positioned with overlapping edge channels. This gives full frequency coverage across the J = 0-1 7LiH line with a velocity resolution of 2.9 km/s. Uranus was used as a flux density calibrator, the internal noise source was used to correct the passbands of each window, and 0238+166 was used to calibrate the complex antenna-based gains. The source was then self-calibrated to refine the solution. The data were calibrated and imaged using the MIRIAD software package (Sault et al., 1995). We obtained about ten hours of good data on this source.
PKS1830-211 was observed in 2008 March and April, when CARMA was in its D configuration giving a typical synthesized beam of 3.62.1″. The u-v coverage of the observations gives projected baselines of 3.79-95.03 k (4.8-121.1 m). All three correlator bands were set up with 62 MHz bandwidths, giving a resolution of 1.2 km/s. Two of the bands were configured to overlap at the edges to cover the J = 0-17LiH line in the lower sideband and J = 0-1 6LiH in the upper sideband. The remaining band was configured to observe the J = 3-4 13CO line in the lower sideband, this choice was driven by the frequency configuration. Neptune and MWC349 were used as flux density calibrators, 3C273 and 3C454.3 were used to correct the passbands of each window, and 1733-130 and 1911-201 were used to calibrate the antenna based gains. The source was then self-calibrated to refine the solution. We obtained only 4.5 hours of good data due to poor weather.
B0218+357 was observed in 2008 August and September, when CARMA was also in its D configuration, giving a typical synthesized beam of 1.71.5″. The coverage of the observations gave projected baselines of 6.7-129.2 k (7.7-147.1 m). Two of the correlator bands were set up in 62 MHz mode, giving 1.1 km/s resolution, and the third was in 31 MHz mode, giving 0.55 km/s resolution. Band 1 in the lower sideband was centered on the J = 3-4 13CO line. Bands 2 and 3 in the lower sideband were set to observe the J = 0-1 7LiH transition. Band 1 in the upper sideband was set to observe the J = 0-1 6LiH transition. The upper sideband of the other two bands were for continuum. Uranus was used as the flux density calibrator, 3C84, 3C454.3, and the internal noise source were used to correct the passbands of each window. The data were self-calibrated for the antenna based gains. We only obtained about seven hours of good data on this source due to poor weather.
4 RESULTS & DISCUSSION
4.1 B0218+357
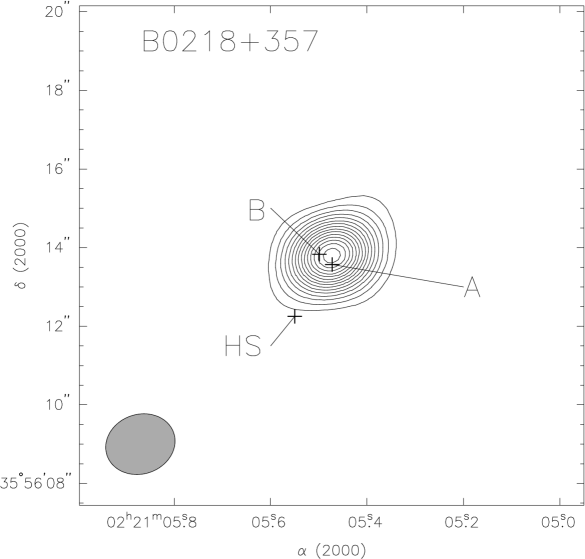
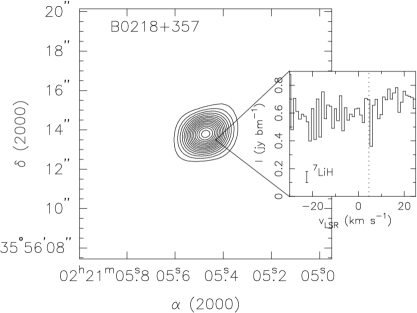
Figure 1 shows our continuum map of B0218+357. The two point sources (A and B) and the ”hot spot” are labeled and the synthesized beam is in the lower left corner. The contour levels are 12, 24, 36, …, = 4.5 mJy/beam and the peak flux is 885 mJy/beam. Note that we do not detect the ”hot spot” (even at our 3 cutoff). This peak flux value is within the uncertainties of the expected value at our rest frequency from Figure 2 of (Combes & Wiklind, 1997). Figure 2 shows our 3 detection of 7LiH. The noise level of the spectrum is denoted by the error bar and the dashed line denotes the expected rest velocity of the line. This line was detected toward the A component, where all other line detection have been made to date and is at the expected rest velocity. For absorption features the total beam averaged column density can be calculated from (Lucas & Liszt, 1993; Greaves & Nyman, 1996)
| (1) |
where is the rotational partition function, is the lower state energy, is the product of the line strength and dipole moment, and the opacity, , is defined below
| (2) |
giving
| (3) |
where is the main beam brightness temperature of the line, is defined as (Rohlfs & Wilson, 2000)
| (4) |
is the cosmic microwave background (), and is the continuum brightness temperature. For observations not done in a temperature scale one can convert from Jy beam-1 to K using (Rohlfs & Wilson, 2000)
| (5) |
where the is peak intensity of the line in Jy beam-1 and is the beam filling factor (incorporating both the continuum and absorption source factors). In all equations the excitation temperature is assumed to be 10 K.
From these equations we get an opacity () of 1.7 and a total column density of cm-2 for 7LiH. This value is similar to that of (Combes & Wiklind, 1997). Calculated H2 column densities for this source range from - cm-2 (Menten & Reid, 1996; Combes & Wiklind, 1995). From these values we calculate a LiH/H2 ratio of - . If we assume that the gas is cold and dark, as did Combes & Wiklind (1998), we have f(H2) = 0.5. The Li/H ratio for a source with the redshift of B0218+357 can be estimated to be (Combes & Wiklind, 1998). From these values we calculate a LiH/Li ratio of 0.287 - 0.003.
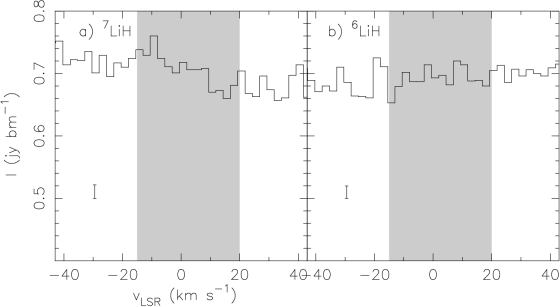
Figure 3 shows our non-detections toward B0218+357. a) shows 13CO and b) shows 6LiH. Using equation 1 we can set 1 upper limits of cm-2 and cm-2, respectively. From this we can calculate a 6Li/7Li upper limit of 0.16. The 13CO transition was detected by (Combes & Wiklind, 1995), thus given our non-detection we can set limits on the temperature. Given our 1 upper limit we can only set a temperature upper limit of 75 K.

4.2 PKS1830-211
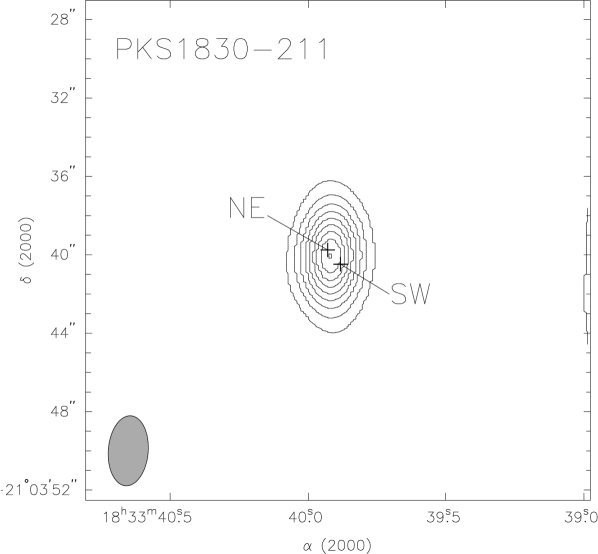
Figure 4 shows our continuum map of PKS1830-211. The two point sources (NE and SW) are labeled. The synthesized beam is in the lower left corner and the contour levels are 12, 24, 36, …, = 9.0 mJy/beam and the peak flux is 953 mJy/beam. Figure 5 shows our 3.4 detection of 13CO toward the SW component of PKS1830-211. The error bar denotes the rms noise level of the spectrum. The grey area indicates the velocities over which absorption peaks have been detected previously (e.g. Muller et al., 2006; Menten et al., 2008). The arrow indicates the line center. In order to increase the S/N of our spectra we inverted the data by averaging adjacent together, decreasing the velocity resolution to 2.5 km/s.
From equation 1 we calculate a column density of cm-2 for 13CO. Comparing this value with the 12CO value from Wiklind & Combes (1998) gives a 12CO/13CO ratio of 72. While this value is a bit high compared to most Galactic values it is not unreasonable, since 13C is formed primarily in low and medium mass stars during their red giant phase, and there are fewer of these at higher z, one could reasonably expect a higher ratio toward PKS1830-211 (Wilson & Rood, 1994, and references therein).
Figure 6 shows our non-detections toward PKS1830-211. a) shows 7LiH and b) shows 6LiH. Using equation 1 we can set 1 upper limits of cm-2 and cm-2, respectively.

4.3 PKS0201+113
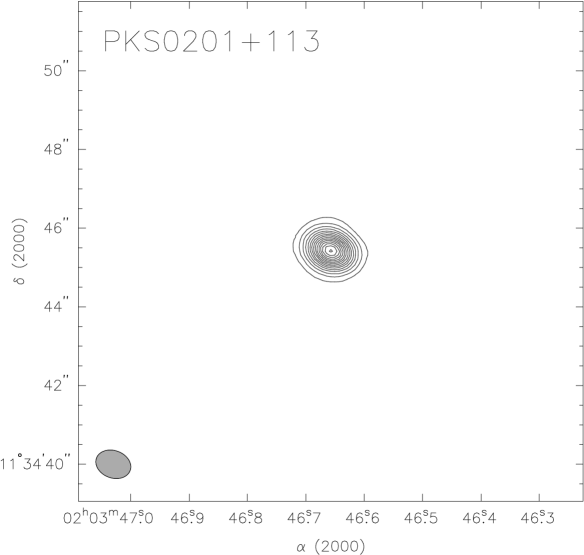
Figure 7 shows our continuum map of PKS0201+113. The synthesized beam is plotted in the lower left corner and the contour levels are 12, 24, 36, …, = 926 Jy/beam and the peak flux is 169 mJy/beam.
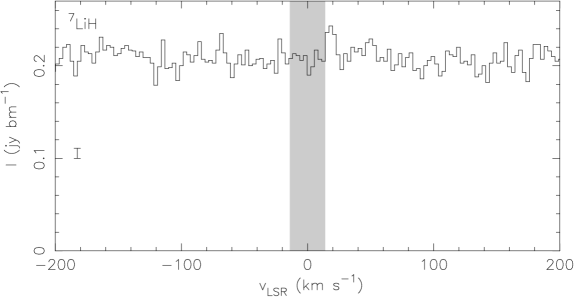
We did not detect 7LiH toward this source. Figure 8 shows the spectrum of the non-detection. The error bar denotes the 1 rms noise level. From equation 1 we calculate an upper limit to the column density of cm-2.
5 Implications and Conclusions
We have presented CARMA observations of the transitions of 7LiH and 6LiH, and the transition of 13CO toward three distant quasars, B0218+357, PKS1830-211, and PKS0201+113. While these lines were not detected in most of the sources, due primarily to the lack of sensitivity, some were detected. The 7LiH line was detected toward only one source, B0218+357, at a 3- level. From these observations we calculate a beam averaged column density of cm-2. We also searched for the transition of 6LiH toward B0218+357, but did not detect it. We were able to set an upper limit on the 6Li/7Li ratio of 0.28 for this source. Unfortunately, this upper limit does not indicate which model for BBN is correct. Further observations to detect the 6LiH transition are necessary to resolve this.
Ultimately one wants to know the primordial Li abundance. Observing and detecting LiH is just the first step in this process. The next step is determining the Li column density from the LiH. Doing this requires detailed knowledge of the formation and destruction processes of LiH, both in the gas phase (for both high and low objects) and on grain surfaces (for low objects). To date this knowledge is notably incomplete, especially over the range in in which we can observe LiH. Additionally the H column density needs to be determined to good accuracy. Recent determinations of the H column density in many of these sources is based on CO/H ratios, using CO lines that may be saturated, and assuming that the CO/H ratio is constant for all , which is not likely to be the case. Thus, while LiH offers a new probe of extragalactic lithium, much work is still needed before LiH yields the primordial abundance.
References
- Asplund et al. (2006) Asplund, M., Lambert, D. L., Nissen, P. E., Primas, F., & Smith, V. V. 2006, ApJ, 644, 229
- Bellini et al. (1994) Bellini, M., de Natale, P., Inguscio, M., Fink, E., Galli, D., & Palla, F. 1994, ApJ, 424, 507
- Biggs et al. (2001) Biggs, A. D., Browne, I. W. A., & Wilkinson, P. N. 2001, MNRAS, 323, 995
- Biggs et al. (2003) Biggs, A. D., Wucknitz, O., Porcas, R. W., Browne, I. W. A., Jackson, N. J., Mao, S., & Wilkinson, P. N. 2003, MNRAS, 338, 599
- Bougleux & Galli (1997) Bougleux, E., & Galli, D. 1997, MNRAS, 288, 638
- Bovino et al. (2011) Bovino, S., Tacconi, M., Gianturco, F. A., Galli, D., & Palla, F. 2011, arXiv:1102.3812
- Carilli et al. (1993) Carilli, C. L., Rupen, M. P., & Yanny, B. 1993, ApJ, 412, L59
- Coc et al. (2004) Coc, A., Vangioni-Flam, E., Descouvemont, P., Adahchour, A., & Angulo, C. 2004, ApJ, 600, 544
- Cohen et al. (2003) Cohen, J. G., Lawrence, C. R., & Blandford, R. D. 2003, ApJ, 583, 67
- Combes & Wiklind (1995) Combes, F., & Wiklind, T. 1995, A&A, 303, L61
- Combes & Wiklind (1997) Combes, F., & Wiklind, T. 1997, ApJ, 486, L79
- Combes & Wiklind (1998) Combes, F., & Wiklind, T. 1998, A&A, 334, L81
- Condon et al. (1977) Condon, J. J., Hicks, P. D., & Jauncey, D. L. 1977, AJ, 82, 692
- Cyburt et al. (2006) Cyburt, R. H., Ellis, J., Fields, B. D., Olive, K. A., & Spanos, V. C. 2006, JCAP, 11, 14
- Cyburt et al. (2003) Cyburt, R.H., Fields, B.D., & Olive, K.A. 2003, PhyLettB, 567, 227
- Cyburt et al. (2008) Cyburt, R. H., Fields, B. D., & Olive, K. A. 2008, JCAP, 11, 12
- Fields (2011) Fields, B.D. 2011, Annual Review of Nuclear and Particle Science, in press
- Fields & Prodanović (2005) Fields, B. D., & Prodanović, T. 2005, ApJ, 623, 877
- Galli & Palla (1998) Galli, D., & Palla, F. 1998, A&A, 335, 403
- Greaves & Nyman (1996) Greaves, J. S., & Nyman, L.-A. 1996, A&A, 305, 950
- Henkel et al. (2005) Henkel, C., Jethava, N., Kraus, A., Menten, K. M., Carilli, C. L., Grasshoff, M., Lubowich, D., & Reid, M. J. 2005, A&A, 440, 893
- Hodges et al. (1984) Hodges, M. W., Mutel, R. L., & Phillips, R. B. 1984, AJ, 89, 1327
- Jedamzik et al. (2006) Jedamzik, K., Choi, K.-Y., Roszkowski, L., & Ruiz de Austri, R. 2006, JCAP, 7, 7
- Jin et al. (1999) Jin, C., Garrett, M. A., Nair, S., Porcas, R. W., & Patnaik, A. R. 1999, NewA Rev, 43, 767
- Jin et al. (2003) Jin, C., Garrett, M. A., Nair, S., Porcas, R. W., Patnaik, A. R., & Nan, R. 2003, MNRAS, 340, 1309
- Kanekar et al. (2003) Kanekar, N., Chengalur, J. N., de Bruyn, A. G., & Narasimha, D. 2003, MNRAS, 345, L7
- Kanekar et al. (2007) Kanekar, N., Chengalur, J. N., & Lane, W. M. 2007, MNRAS, 375, 1528
- Larson et al. (2011) Larson, D., et al. 2011, ApJS, 192, 16
- Lidman et al. (1999) Lidman, C., Courbin, F., Meylan, G., Broadhurst, T., Frye, B., & Welch, W. J. W. 1999, ApJ, 514, L57
- Lucas & Liszt (1993) Lucas, R., & Liszt, H. S. 1993, A&A, 276, L33+
- Menten & Reid (1996) Menten, K. M., & Reid, M. J. 1996, ApJ, 465, L99
- Menten et al. (1999) Menten, K. M., Carilli, C. L., & Reid, M. J. 1999, Highly Redshifted Radio Lines, 156, 218
- Menten et al. (2008) Menten, K. M., Güsten, R., Leurini, S., Thorwirth, S., Henkel, C., Klein, B., Carilli, C. L., & Reid, M. J. 2008, A&A, 492, 725
- Miniati et al. (2000) Miniati, F., Ryu, D., Kang, H., Jones, T. W., Cen, R., & Ostriker, J. P. 2000, ApJ, 542, 608
- Morabito et al. (1986) Morabito, D. D., Niell, A. E., Preston, R. A., Linfield, R. P., Wehrle, A. E., & Faulkner, J. 1986, AJ, 91, 1038
- Muller et al. (2006) Muller, S., Guélin, M., Dumke, M., Lucas, R., & Combes, F. 2006, A&A, 458, 417
- Muller et al. (2007) Muller, S., Guélin, M., Combes, F., & Wiklind, T. 2007, A&A, 468, L53
- Muller & Guélin (2008) Muller, S., & Guélin, M. 2008, A&A, 491, 739
- Nair et al. (2005) Nair, S., Jin, C., & Garrett, M. A. 2005, MNRAS, 362, 1157
- O’Dea et al. (1992) O’Dea, C. P., Baum, S. A., Stanghellini, C., Dey, A., van Breugel, W., Deustua, S., & Smith, E. P. 1992, AJ, 104, 1320
- Oya et al. (1998) Oya, S., Iwamuro, F., Tsukamoto, H., & Maihara, T. 1998, PASJ, 50, 163
- Patnaik et al. (1993) Patnaik, A. R., Browne, I. W. A., King, L. J., Muxlow, T. W. B., Walsh, D., & Wilkinson, P. N. 1993, MNRAS, 261, 435
- Patnaik et al. (1995) Patnaik, A. R., Porcas, R. W., & Browne, I. W. A. 1995, MNRAS, 274, L5
- Plummer, Herbst, & De Lucia (1984) Plummer, G. M., Herbst, E., & De Lucia, F. C. 1984, J. Chem. Phys., 81, 4893
- Pospelov (2007) Pospelov, M. 2007, Physical Review Letters, 98, 231301
- Pospelov & Pradler (2010) Pospelov, M., & Pradler, J. 2010, Annual Review of Nuclear and Particle Science, 60, 539
- Rohlfs & Wilson (2000) Rohlfs, K., & Wilson, T. L. 2000, Tools of Radio Astronomy (Springer-Verlag:New York)
- Sault et al. (1995) Sault, R. J., Teuben, P. J., & Wright, M. C. H. 1995, Astronomical Data Analysis Software and Systems IV, 77, 433
- Spergel et al. (2003) Spergel, D. N., et al. 2003, ApJS, 148, 175
- Stanghellini et al. (1990) Stanghellini, C., Baum, S. A., O’Dea, C. P., & Morris, G. B. 1990, A&A, 233, 379
- Subrahmanyan et al. (1990) Subrahmanyan, R., Narasimha, D., Pramesh-Rao, A., & Swarup, G. 1990, MNRAS, 246, 263
- White et al. (1993) White, R. L., Kinney, A. L., & Becker, R. H. 1993, ApJ, 407, 456
- Wiklind & Combes (1995) Wiklind, T., & Combes, F. 1995, NASA STI/Recon Technical Report N, 98, 18647
- Wiklind & Combes (1998) Wiklind, T., & Combes, F. 1998, ApJ, 500, 129
- Wilson & Rood (1994) Wilson, T. L., & Rood, R. 1994, ARA&A, 32, 191
- Winn et al. (2002) Winn, J. N., Kochanek, C. S., McLeod, B. A., Falco, E. E., Impey, C. D., & Rix, H.-W. 2002, ApJ, 575, 103
- Zeiger & Darling (2010) Zeiger, B., & Darling, J. 2010, ApJ, 709, 386