Explosive site percolation with a product rule
Abstract
We study the site percolation under Achlioptas process (AP) with a product rule in a (2D) square lattice. From the measurement of the cluster size distribution, , we find that has a very robust power-law regime followed by a stable hump near the transition threshold. Based on the careful analysis on the distribution, we show that the transition should be discontinuous. The existence of the hysteresis loop in order parameter also verifies that the transition is discontinuous in 2D. Moreover we also show that the transition nature from the product rule is not the same as that from a sum rule in 2D.
pacs:
64.60.ah, 64.60.De, 05.70.Fh, 64.60.BdThe percolation transition describing the emergence of large-scale connectivity in lattice systems or complex networks has been extensively studied in statistical mechanics and related fields due to its possible applications to various phenomena such as sol-gel transition and polymerization, resistor networks, and epidemic spreading Stauffer_book . When the occupation probability of node (site) is lower than certain threshold , all the clusters are microscopic. As the occupation probability increases, the macroscopically connected cluster emerges. Such transition in the ordinary percolation is a continuous transition Stauffer_book .
On the other hand, there have been several attempts to find a percolation model which undergoes a discontinuous transition. The discontinuous percolation transition can be found in the modelling of magnetic systems with significant competition between exchange and crystal-field interactions Andersen76 ; Chalupa79 . The similar phenomena has been found in financial systems Kim08 , in which two equally probable phases exit. Other examples of the discontinuous transition in percolation are the formation of infinite cluster under a central-force Moukarzel97 and the cascade of failure in interdependent networks Buldyrev10 .
Recently, Achlioptas et al. Achlioptas09 suggested a simple process in which the growth of large clusters is systematically suppressed and the process is usually called as Achlioptas process (AP). Based on the analysis of transition interval it was argued that the percolation transition under AP is explosive and discontinuous. Several variant of models have been investigated to understand the general properties and conditions which cause such non-trivial discontinuous transition Ziff09 ; Cho09 ; Radicchi ; YKim10 . Some examples of such non-trivial transition has been found in nano-tube based system YKim10 , protein homology network Rosenfeld10 , and community formation Pan10 .
However, more recent studies on the percolation transition under AP reveals several evidences which strongly suggest that the transition can be continuous. For example, da Costa et al. daCosta10 argued that the transition in the complete graph (CP) is continuous, even though the order parameter exponent is very small (). From the measurement of the cluster size distribution Lee et al. Lee11 also argued that the transition in CP is continuous. Grassberger et al. Grassberger11 also argued that the transition, even in the low-dimensional systems, can be continuous based on a measurement of the order parameter distribution.
Since most of the studies on the criticality of AP process are restricted to the infinite dimensional systems, it is still not clear whether AP also produces a continuous transition in lower dimensional systems or not. For example, in the bond percolation under AP in a 2-dimensional (2D) square lattice, the product rule was argued to produces a discontinuous transition based on a finite-size scaling Ziff09 ; Araujo11 . In contrast Grassberger et al. Grassberger11 was argued that transition of the 2D AP bond percolation is still continuous. We therefore cannot exclude the possibility that the transition nature of the AP in the mean-field limit can be different from that in lower-dimensional systems, like the Potts model Wu82 . Moreover, based on the measurement of hysteresis Bastas11 , a sum rule for the 2D site percolation possibly makes the transition continuous in the thermodynamic limit. This indicates that under the AP-like processes the bond percolation and site percolation may have different transition natures in the 2D lattice. In the ordinary percolation, bond and site percolations are known to belong to the same universality class Stauffer_book . In contrast, the results in Refs. Ziff09 ; Araujo11 ; Bastas11 show the possibility that under AP the bond percolation with a product rule and the site percolation with a sum rule do not belong to the same universality class. Therefore, it is theoretically important and interesting to investigate whether in a low-dimensional system the product rule and the sum rule belong to the same universality class or not. In order to achieve this purpose, we investigate the site percolation under AP with a product rule and show that AP with the product rule produces a clear discontinuous transition in a 2D lattice. For this we carefully analyze the cluster size distribution and hysteresis.
AP in 2D site percolation is defined as follows: (I) We select two sites and at random. (II) Let ( be the sizes of clusters which form into a new big cluster with the size () by occupying the site (). Here the cluster size is defined by the number of sites in the cluster. Then calculate the products
| (1) |
This rule is generally called product rule (PR). (III) If () then site () remains to be vacant. The processes (II) and (III) prefer the connection between small clusters, which causes the cluster repulsion or suppress the growth of large cluster. If the product in Eq. (1) is replaced by summation, then the rule is called as a sum rule. Recent study for site percolation with sum rule shows that the transition is continuous when the linear size of the lattice, , goes to infinity Bastas11 . Since we use a 2D square lattice in Eq. (1) is at most 4.
To understand the percolation transition physically to a deeper level, the properties of the cluster size distribution should be the first one to understand Stauffer_book ; Lee11 ; Cho10 . The cluster size distribution at a site occupation probability is normally defined by the probability that a randomly selected site belongs to a cluster which has sites (-cluster) . For ordinary percolation, it is well known that satisfies a power-law relation Stauffer_book ,
| (2) |
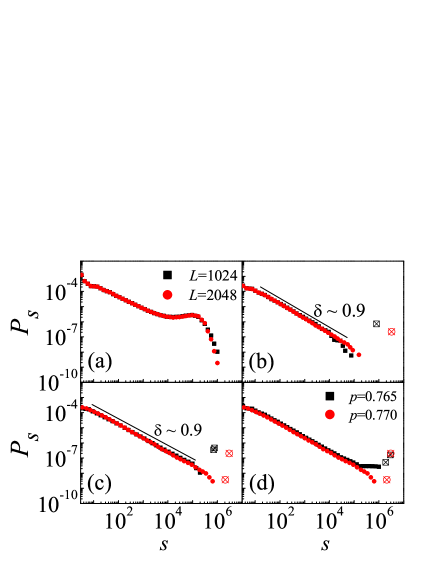
with at the percolation transition probability . Since, as we shall show, the percolation properties under AP depend on the history how the clusters are grown, we measure by filling sites from the vacant lattice or increasing . In Fig. 1 ’s for 2D site percolation under AP with product rule (2DSAP) are displayed. in Fig. 1 shows an anomalously unique behavior compared to that of the ordinary percolation (OP) Stauffer_book and that of the AP percolation on the complete graph (APCG), which was argued to undergo the continuous phase transition Lee11 .
When , for 2DSAP has a hump in the tail as approaches to Cho10 . In this regime, does not depend on or as shown in Fig. 1(a). In OP, normally decays exponentially as gets larger in this regime. For the detailed comparison to those of OP and APCG, let’s call at which the hump is maximal . In OP we cannot identify . In APCG and was argued to satisfy the scaling behavior, and with and Lee11 . Therefore in APCG the hump has the negligible contribution and satisfies the same scaling form as Eq.(2) in the limit . This behavior in APCG is believed to be one of the signals for the continuous transition as in OP. In contrast and of 2DSAP do not depend on or and as gets larger. We have numerically checked this behavior for . This behavior for 2DSAP means that there should be many considerably large stable microscopic -clusters with before transition, which indicates the unstable or sudden appearance of the macroscopic cluster by connecting these clusters when increases.
Even when , for 2DSAP has a unique behavior as shown in Fig. 1(b). Except for the macroscopically large cluster, for microscopically finite clusters for still satisfies the same power-law with the same exponent as or , which we will explain with the data in Fig. 1(c). The difference between and is in and the tail part for finite clusters. As becomes larger than , decreases and the length of tail becomes shorter compared to at . The power-law behavior is very robust, because it maintains for nearly four decades or as shown in Fig. 1(b) before appearing finite-size effects. Moreover, the power-law behavior for is nearly independent of as for (see Fig. 1(b)). This power-law behavior for the finite clusters has been confirmed even for large upto . In contrast of microscopic clusters for in OP and APCG exponentially decays. In 2DSAP the product rule makes the macroscopic cluster absorb relatively smaller clusters when gets large in the regime . Therefore the larger microscopic clusters cannot easily disappear. The sustainablity of such metastable clusters seems to be the origin of the power-law of for . As we shall see the hysteresis of 2DSAP is consistent with the power-law for because of such metastable states.
The phase transition for 2DSAP naturally occurs at which divides the two regimes of described by Fig. 1(a) and Fig. 1(b). The transition threshold for 2DSAP is estimated by the data in Fig. 1(c) and Fig. 1(d). As shown in Fig. 1(c) and in Fig. 1(d) at for the macroscopically large cluster starts to be detached from the continuous distribution of for microscopic clusters. This detachment behavior seems to be independent of as shown in Fig. 1(c). As shown in Fig. 1(d), this detachment behavior barley occurs and the hump-like tail still exists for . We have scrutinized between , but the sharp discrimination between the hump-like behavior and the detachment cannot be made. Such complex behavior mixing the hump and for the macroscopically large clusters for seems to be a unique behavior of 2DSAP. Therefore the best estimation of from the numerical data of is . At , satisfies the power-law with very well except for the very tiny tail part. Again this power-law is very robust and holds for more than four decades. The result also provides a very important clue to understand the transition nature of 2DSAP. Since is a probability, should satisfy the normalization condition, . However, the summation diverges if . Therefore, there should be a cutoff in the upper limit as . In the limit , . Thus, there should be a discontinuous jump to produce a macroscopic cluster in the limit and the transition becomes discontinuous. The physical origin of the discontinuous transition should come from the merge of -clusters with to form the macroscopic cluster when gets larger to be .
One of the most generally accepted and the simplest methods to verify whether the observed transition is discontinuous or not is the measurement of the hysteresis Landau_book . The hysteresis measurement for the explosive percolation has also been emphasized in Refs.YKim10 ; Bastas11 . The hysteresis is a history-dependent property of a system and usually observed in the discontinuous phase transition because of the metastable state. If the transition is discontinuous, then the route of changes in the order parameter during the process of filling sites from the vacant lattice or increasing would be different from that for the process of deleting sites from the fully-occupied lattice or decreasing . The order parameter, , is defined by the probability that a site belongs to the largest cluster Stauffer_book ; Ziff09 ;
| (3) |
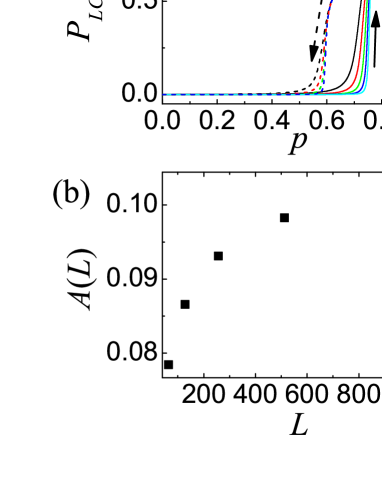
Here, is the number of sites in the largest cluster. In Fig. 2(a), to check the existence of hysteresis we compare the measured ’s along the process of increasing (solid lines) and along the process of decreasing from to . For the decreasing process, we slightly modify the rule (III) to easily break the larger clusters into smaller ones YKim10 , since the rules (II) and (III) suppress the formation of a large cluster; i.e., if then we delete the site . With this modified rule we find that there exists a hysteresis for various as shown in Fig. 2(a).
Now the remaining question is whether the hysteresis robustly remains in the limit. For the systematic analysis, we show the dependence of area, , enclosed by for the increasing and decreasing processes on . If the system undergoes a continuous transition, then should vanish in the limit . However, our data clearly shows that increases as increases or, at least, seems to saturate to a nonzero value unlike the sum rule Bastas11 in which as . This shows that 2DSAP undergoes a discontinuous transition. And in 2D lattice, the product rule makes a completely different transition nature from that of the sum rule Bastas11 . This hysteretic property of 2DSAP should be from the sustainability of the metastablly larger clusters, which is consistent with the analysis of in Fig. 1.
Since we don’t know the physically corresponding formula to Hamiltonian or free energy for 2DSAP and there exists the nontrivial hysteretic property, it might be physically nonsense to discuss about the finite-size scaling. However for the comparison’s purpose to other works on explosive percolation Ziff09 ; Cho09 ; Radicchi , we now present the finite size analysis around , which is the percolation transition probability for the -increasing process. From the data in Fig. 2(a), at the is estimated as shown in Fig. 3(a). seems to satisfy the relation with , where conventionally corresponds to . This value of is very close to zero. Thus, in the inset of Fig. 3(a), we also fit the data to the relation which corresponds to the case . Since we cannot exclude the possibility or , the possibility for at to have discontinuous jump cannot be excluded. We also measure the mean cluster size, defined by
| (4) |
represents the summation over all except the largest one. ’s maximal value, , is displayed in Fig. 3(b). Again we fit the data to the conventional scaling relation , and we obtain , where corresponds to conventional .

In summary, we study the site percolation under AP with a product rule in a 2D lattice. From the measurement of , we find that the have a very stable hump when . This indicates that below large number of stable -clusters with exist but their sizes are still microscopic. As approaches to , has a very robust power-law regime followed by the hump. Since the obtained value of the exponent, , for the power-law regime in the vicinity of is less than unity, there should be a cutoff in the possible cluster size for unlike OP Stauffer_book . Thus, to generate a macroscopic cluster there should be a discontinuous jump in the limit and the transition becomes discontinuous. The non-vanishing hysteresis in also verifies that the transition is discontinuous. This result clearly shows that the percolation transition caused by the product rule in a 2D square lattice is discontinuous.
This work was supported by National Research Foundation of Korea (NRF) Grant funded by the Korean Government (MEST) (No. 2009-0073939 and No. 2011-0015257).
References
- (1) D. Stauffer and A. Aharony, “Introduction to Percolation Theory” 2nd Ed. (Taylor & Francis, London and New York, 1994).
- (2) N. H. Andersen, P. E. Lindelof, H. Smith, O. Splittorff, and O. Vogt, Phys. Rev. Lett. 37, 46 (1976).
- (3) J. Chalupa, P. L. Leath, and G. R. Reich, J. Phys. C: Solid State Phys. 12, L31 (1979).
- (4) Y. Kim, H.-J. Kim and S.-H. Yook, Phys. Rev. E 78, 036115 (2008).
- (5) C. Moukarzel, P. M. Duxbury, and P. L. Leath, Phys. Rev. Lett. 78, 1480 (1997).
- (6) S. V. Buldyrev, R. Parshani, G. Paul, H. E. Stanley, and S. Havlin, Nature 464, 1025 (2010).
- (7) D. Achlioptas, R. M. D’Souza, and J. Spencer, Science 323, 1453 (2009).
- (8) R. M. Ziff, Phys. Rev. Lett. 103, 045701 (2009) and Phys. Rev. E 82, 051105 (2010).
- (9) Y. S. Cho, J. S. Kim, J. Park, B. Kahng, and D. Kim, Phys. Rev. Lett. 103, 135702 (2009).
- (10) F. Radicchi and S. Fortunato, Phys. Rev. Lett. 103, 168701 (2009). and Phys. Rev. E 81, 036110 (2010).
- (11) Y. Kim, Y. K. Yun, and S.-H. Yook, Phys. Rev. E 82, 061105 (2010).
- (12) H. D. Rozenfeld, L. K. Gallos, H. A. Makse, Eur. Phys. J. B 75, 305 (2010).
- (13) R. K. Pan, M. Kivelä, J. Saramäki, K. Kaski, and J. Kertész, arXiv:1010.317 (2010).
- (14) R. A. da Costa, S. N. Dorogovtsev, A. V. Goltsev, and J. F. F. Mendes, Phys. Rev. Lett. 105, 255701 (2010).
- (15) H. K. Lee, B. J. Kim, and H. Park, arXiv:1103.4439 (2011).
- (16) P. Grassberger, C. Christensen, G. Bizhani, S.-W. Son, and M. Paczuski, arXiv:1103.3728 (2011).
- (17) N. A. M. Araújo, J. S. Andrade Jr, R. M. Ziff, and H. J. Herrmann, Phys. Rev. Lett. 106, 095703 (2011).
- (18) F. Y. Wu, Rev. Mod. Phys. 54, 235 (1982).
- (19) N. Bastas, K. Kosmidis, and P. Argyrakis, arXiv:1105.1098 (2011).
- (20) Y. S. Cho, S.-W. Kim, J. D. Noh, B. Kahng, and D. Kim, Phys. Rev. E 82, 042102 (2010).
- (21) D. P. Landau and K. Binder, “A Guide to Monte Carlo Simulations in Statistical Physics” (Cambridge University Press, Cambridge, 2000).