SN 2008in Bridging the gap between normal and faint supernovae of type IIP
Abstract
We present optical photometric and low-resolution spectroscopic observations of the Type II plateau supernova (SN) 2008in, which occurred in the outskirts of the nearly face-on spiral galaxy M 61. Photometric data in the X-rays, ultraviolet and near-infrared bands have been used to characterize this event. The SN field was imaged with the ROTSE-IIIb optical telescope about seven days before the explosion. This allowed us to constrain the epoch of the shock breakout to JD = 2454825.6. The duration of the plateau phase, as derived from the photometric monitoring, was 98 days. The spectra of SN 2008in show a striking resemblance to those of the archetypal low-luminosity IIP SNe 1997D and 1999br. A comparison of ejecta kinematics of SN 2008in with the hydrodynamical simulations of Type IIP SNe by Dessart et al. (2010) indicates that it is a less energetic event ( erg). However, the light curve indicates that the production of radioactive 56Ni is significantly higher than that in the low-luminosity SNe. Adopting an interstellar absorption along the SN direction of 0.3 mag and a distance of 13.2 Mpc, we estimated a synthesized 56Ni mass of . Employing semi-analytical formulae (Litvinova & Nadezhin, 1985), we derived a pre-SN radius of , an explosion energy of erg and a total ejected mass of . The latter indicates that the zero age main-sequence mass of the progenitor did not exceed 20 . Considering the above properties of SN 2008in and its occurrence in a region of sub-solar metallicity ([O/H] 8.44 dex), it is unlikely that fall-back of the ejecta onto a newly formed black hole occurred in SN 2008in. We therefore favor a low-energy explosion scenario of a relatively compact, moderate-mass progenitor star that generates a neutron star.
Subject headings:
supernovae: general supernovae: individual (2008in)1. introduction
Core-collapse Type II supernovae (SNe) mark the violent death of stars with main-sequence masses greater than 8 and as is indicated by the presence of hydrogen lines in their optical spectra, they originate from a progenitor star with a significant amount of hydrogen still intact (Eldridge & Tout, 2004). Of special interest are the Type II plateau SNe which are characterized by a ‘plateau’ in their optical light curve and are more common, constituting about 75% of all Type II SNe (Smith et al., 2011). The IIP SNe show a wide range of plateau luminosities, plateau durations, expansion velocities and nickel masses (Hamuy, 2003) and these observational properties are connected with the explosion mechanism as well as the physical properties of the progenitor star such as ejected mass, explosion energy and pre-SN radius (Nadyozhin, 2003; Smartt et al., 2009). The IIP SNe are thought to result from progenitor masses in the range (Heger et al., 2003) with an extended hydrogen envelope necessary to maintain the plateau phase. A detailed study of optical light curves and spectra of only a few nearby IIP SNe has been done so far and there exists a discrepancy in estimating the mass of their progenitors, e.g, for the three well studied events (namely 1999em, 2005cs and 2004et), the determination of progenitor mass from the hydrodynamical modeling of their light curve is found to be higher than that estimated from pre-SN imaging (Utrobin et al., 2010; Bersten et al., 2011).
Recently, a number of ‘low luminosity’ Type IIP events have been discovered viz. SNe 1999br, 1999eu, 1994N, 2001dc, 2005cs (Pastorello et al., 2004, 2009), 2008bk (Van Dyk et al., 2010) and 2009md (Fraser et al., 2010). These events have explosion energy ( erg) and ejected 56Ni-mass ( ), both lower by a factor of 10 than normal, and low expansion velocity 1000 (Pastorello et al. 2009 and references therein). The low-luminosity IIP SNe are debated because of the unknown nature of their progenitors. The first reported faint SN was SN 1997D (Turatto et al., 1998; Benetti et al., 2001), and the observed properties of its light curves and spectra were explained in terms of significant fallback of ejected material on a newly formed black hole (BH), created through the core collapse of a massive progenitor (, Zampieri et al. 1998, 2003). Alternatively, SN 1997D was interpreted as the explosion of a less massive progenitor (, Chugai & Utrobin 2000), close in mass to the lower limit for stars that can undergo core-collapse. Heger et al. (2003) suggested that low-luminosity Type IIP events are electron capture SNe produced by low-mass progenitors giving rise to ONeMg cores. This is further supported through investigations of pre-explosion images (Maund & Smartt, 2005; Maund et al., 2005), though Eldridge et al. (2007) have ruled out the possibility of such a mechanism for the low-luminosity SN 2005cs. According to the formalism of Heger et al. (2003) and Eldridge & Tout (2004), no star having initial mass less than 22 can form a BH, which can quench the ejected material and produce a low luminosity SN. Stars with masses above 25, formed in metal-poor or slightly sub-solar metallicity regions can produce low-luminosity, BH-forming Type IIP SNe. Type IIL/b events can be produced through this process from stars having masses and generated in regions with solar (or super-solar) metallicity. So, the metallicity information at the SN location and the estimation of the initial mass are essential to constrain the triggering mechanisms of these explosions.
SN 2008in was discovered in the nearby galaxy M 61 (NGC 4303). The first unfiltered CCD images of SN 2008in were taken by Koichi Itagaki on 2008 December 26.79 (all times in UT hereafter) and 27.69 at a magnitude of 14.9. Independent observations of this event by K. Kadota showed the transient at an unfiltered mag of 15.1, In addition W. Wells recorded the SN on 2008 December 28.46 at and band magnitudes of 14.3 and 13.2, respectively (Nakano et al., 2008). Low and mid-resolution spectroscopic observations indicate an early discovery for SN 2008in (within 12 weeks after core-collapse). The spectra showed highly blueshifted Hα and Hβ absorptions (by 9000 ) with weaker emission components (Chakraborti et al., 2008; Foley, 2008; Stritzinger, 2008). The presence of prominent P-Cygni profiles of Balmer lines leads to its classification as a Type II SN.
The broadband light curve and the initial spectral evolution of SN 2008in were similar to those of normal Type IIP SNe. However, from mid-plateau, the SN started to show a few spectral features (like H ) which are similar to under-luminous events. SN 2008in was also observed in the radio with the Very Large Array (VLA) on 2008 December 31.40 UT in two frequency bands at 8.4601 and 22.4601 GHz (Stockdale et al., 2008). Observation for the second epoch was further reported by Stockdale et al. (2009) on 2009 January 27. Interacting Type II SNe, like Type IIn events and a few Type IIP events (e.g. SN 2004et) are supposed to be strong sources of radio emission (for review see Weiler et al. 2002). However, both VLA observations produced null results for this proximate event.
In this paper we present optical and near-infrared photometric and optical spectroscopic observations of SN 2008in. The photometric data cover a time span of about 410 days since the discovery. The Swift/XRT (Burrows et al., 2005) and Swift/UVOT (Roming et al., 2005) data covering a time span of 60 days are also presented. In Sections 3 and 4 we study the the photometric and spectroscopic evolutions respectively. In Sections 5 and 6 we cover the estimates of distance, reddening, intrinsic color and bolometric fluxes. The main physical parameters of the explosion and the mass of the progenitor are derived in Section 7 while a comparison of its properties with other SNe is given in Section 8. The conclusion of the paper is given in the last section. The epoch of explosion JD = 2454825.6 (§3) is considered throughout the paper and the times of pre-/post-explosion are referred with signs respectively.
2. observation and data reduction
2.1. Photometric Observation
The prompt follow-up of the event was carried out by the ground-based ROTSE-IIIb telescope111The Robotic Optical Transient Search Experiment (ROTSE-III) is a set of four 45 cm fully robotic optical telescopes, installed at Siding Spring Observatory, Australia (ROTSE-IIIa), McDonald Observatory, Texas (ROTSE-IIIb), H.E.S.S. site, Namibia (ROTSE-IIIc) and TUBITAK National Observatory, Turkey (ROTSE-IIId; Akerlof et al. 2003; Yuan 2010). having sensitivity in the wavelength region from 0.35 to 1.0 with a peak around 0.6 (Quimby et al., 2007). The SN was first detected in the ROTSE-IIIb images on 2008 December 24.45 and it was monitored at 58 phases until +115d. The initial detections of the SN evaded the automated pipeline identification due to poor image quality and low signal-to-noise ratio (S/N). The data reduction was performed afresh on all the available ROTSE data. In order to remove the contamination of the true SN-flux from the underlying galaxy, a pre-SN galaxy template was constructed from images taken in early 2008 and each SN frame was reduced using the galaxy-template subtraction scheme developed by Alard (2000). The point spread function (PSF) photometry was performed at the SN location in the galaxy-template subtracted images. The unfiltered instrumental magnitudes were calibrated using the USNO B1.0 -band magnitudes of about 15 isolated stars. The light curve thus produced was found to be 0.15 mag off from the Cousins band light curve produced by multi-band observation carried out at ARIES (described below) and the ROTSE magnitudes were scaled accordingly.
| UT Date | JD | PhaseaaWith reference to the explosion epoch JD 2454825.6 | ||||||
|---|---|---|---|---|---|---|---|---|
| (yy/mm/dd) | 2454000+ | (day) | (mag) | (mag) | (mag) | (mag) | (mag) | (mag) |
| 2008/12/30.08 | 830.58 | 5.00 | 14.970.05 | 14.650.04 | 14.450.05 | 14.120.04 | 15.240.04 | 15.200.04 |
| 2008/12/30.60 | 831.11 | 5.53 | 15.130.05 | 14.850.04 | 14.540.04 | 14.160.04 | 15.200.04 | 15.130.05 |
| 2008/12/31.96 | 832.46 | 6.88 | 15.530.05 | 15.280.09 | 14.840.05 | 14.320.04 | 15.250.04 | 15.150.06 |
| 2009/01/01.83 | 833.30 | 7.72 | 15.720.05 | 15.470.05 | 15.010.05 | 14.340.04 | 15.300.04 | 15.170.04 |
| 2009/01/03.54 | 835.05 | 9.47 | 16.230.05 | 16.070.05 | 15.510.05 | 14.520.04 | 15.350.04 | 15.250.04 |
| 2009/01/07.79 | 839.29 | 13.71 | 17.870.08 | 17.880.11 | 16.960.07 | 15.150.04 | 15.490.04 | 15.250.05 |
| 2009/01/11.15 | 842.64 | 17.06 | 18.810.11 | 18.660.14 | 17.800.09 | 15.740.04 | 15.620.04 | 15.270.04 |
| 2009/01/19.79 | 851.30 | 25.72 | 18.670.16 | 16.670.05 | 16.000.04 | 15.360.05 | ||
| 2009/01/22.00 | 884.53 | 58.95 | 17.920.07 | 16.770.05 | 15.690.04 | |||
| 2009/01/22.73 | 885.23 | 59.65 | 18.020.09 | 16.750.05 | 15.680.05 |
The SN 2008in was also monitored with the Ultraviolet Optical Telescope (UVOT) on board Swift from +5d to +60d. The UVOT filters , and have their effective wavelength at 2030, 2231, 2634, 3501, 4329, and 5402 Å, respectively (Poole et al. 2008). The UVOT data reduction was performed following the prescriptions of Brown (2009). A 5″ aperture is used to measure the counts for the coincidence loss correction whereas a 3″ aperture was used for the photometry. For the filters , and , the last epoch (obtained about 60 days after explosion when the UV flux was very weak) data were used to subtract the galaxy light, while in the optical the SN remains much brighter than the underlying light so contamination was negligible. An aperture correction (based on an average PSF in Swift CALDB) as well as zeropoints from Poole et al. (2008) was applied to put the magnitudes on the UVOT photometric system. The UVOT magnitudes are listed in Table 1.
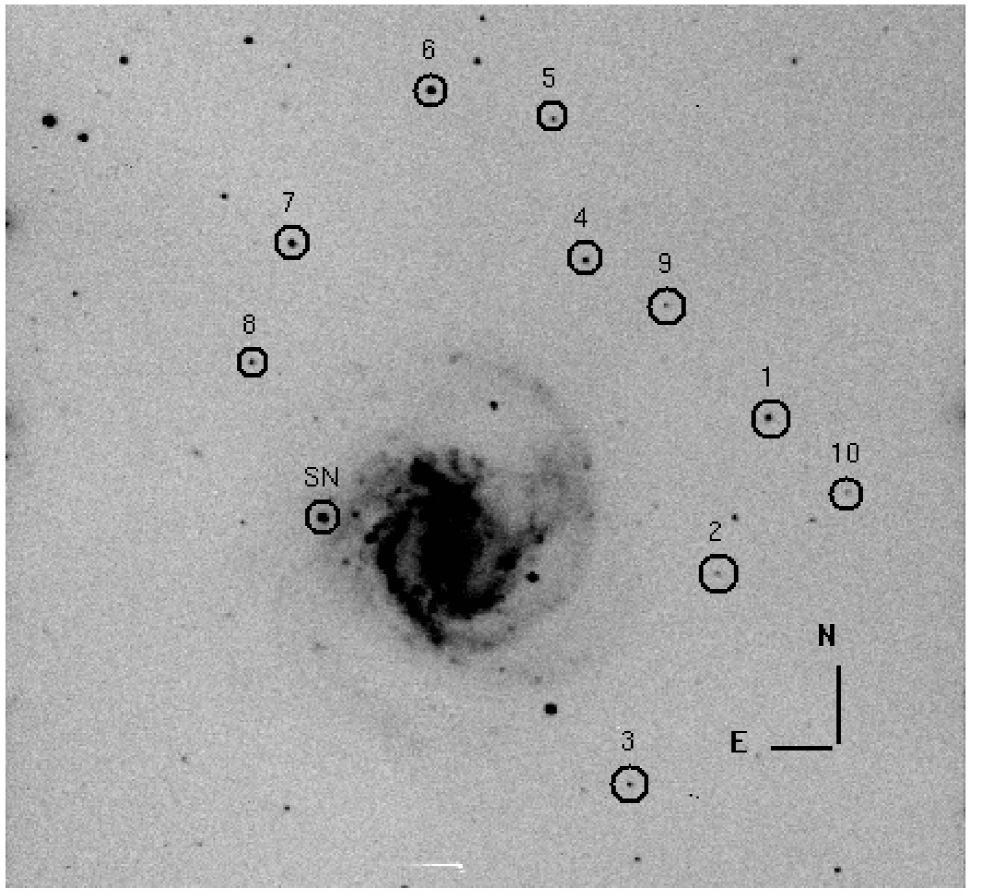
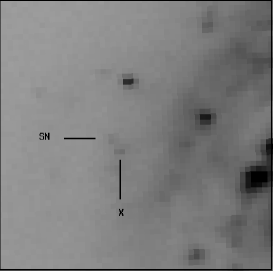
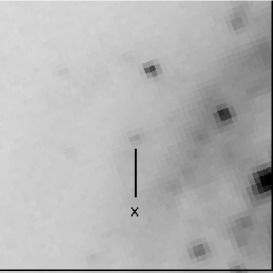
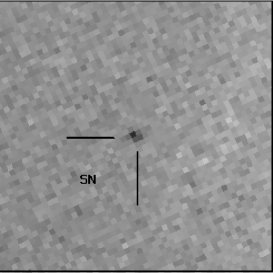
From +5d to +416d, the follow-up of SN 2008in in optical broadband Johnson and Cousins was performed with the 1-m Sampurnanand Telescope (ST) at ARIES, Nainital222 A 2048 2048 CCD camera mounted at the f/13 Cassegrain focus of the telescope, has a square pixel of 24 micron on a side, and with a plate scale of 0.38 arcsec per pixel, it covers a square area of 13 on a side in the sky. The gain and readout noise of the CCD camera are 10 electrons per analog-to-digital unit and 5.3 electrons, respectively. To improve the S/N ratio and optimize the sampling, the observations were carried out in a binned mode of 22 pixel.. An identification chart showing the field of the galaxy M61 along with the locations of SN 2008in as well as the local standards is presented in Figure 1. The photometry is performed using standard tasks of IRAF 333IRAF stands for Image Reduction and Analysis Facility distributed by the National Optical Astronomy Observatory which is operated by the Association of Universities for research in Astronomy, Inc. under co-operative agreement with the National Science Foundation and DAOPHOT 444 DAOPHOT stands for Dominion Astrophysical Observatory Photometry (Stetson, 1987) as described in the paper by Roy et al. (2011). Bias subtraction and flat fielding were performed on the raw frames and the cosmic removal was done using LACOSMIC routine (van Dokkum, 2001). As the SN lies in the outskirts of the galaxy on a relatively faint and smooth background, the photometry at the initial phases (mostly during the plateau phase when the SN is bright) is estimated using the profile fitting method. During nebular phases, when the SN becomes faint, the true SN flux is estimated using the galaxy template subtraction method following the procedures of Roy et al. (2011). As a galaxy template, we used post-explosion (+600d) images observed on 2011 January 04 under good seeing conditions. Figure 2 shows an example of this procedure applied to a late-time -band image of SN 2008in. In the template image of 2011 January 04, we can see a clear flux enhancement located approximately 5″away (a linear distance of 343pc) from the SN position. This knot is also present in a deep image from the Sloan Digital Sky Survey (SDSS) and it is identified as a H ii region in the NED catalog. The progenitor of SN 2008in may have a possible association with this star-forming region. The field of SN 2008in was calibrated using Landolt (2009) standard stars of the field SA98 observed on the same night as the SN. A sample of 10 bright and isolated non-variable stars in the field of SN 2008in was used as local standards to derive the zero points for the SN at each epoch. The location and magnitudes of these local standards are listed in Table 2. The entire time span of photometric observation is about 410 days and in Table 3, we report the photometry of the event.
From +4d to +116d, the SN 2008in was also observed in near-infrared (NIR) bands with the 0.6-m REM/REMIR at La Silla (Zerbi et al., 2004). The object was clearly visible in the and passbands, while it remained undetected in . The instrumental magnitudes were standardized using the 2MASS standards available in the field of SN 2008in. The calibrated magnitudes are listed in Table 4.
2.2. X-ray Observations
The Swift XRT observations were obtained simultaneously with the UVOT observations. To search for X-ray emission from SN 2008in , we extracted X-ray counts from a circular region with a 10 pixel radius (, corresponding to the XRT on-axis 90% encircled energy radius) centered on the optical position of the SN. The background was extracted locally from a source-free region of radius to account for the detector, sky background, and the diffuse emission from the host galaxy.
No X-ray source is detected in the merged 27.1 ks XRT data obtained in photon-counting mode. The upper limit to the XRT net count rate is , corresponding to an unabsorbed (0.2–10 keV band) X-ray flux of and a luminosity of for an adopted thermal plasma spectrum with a temperature of (see Fransson et al. 1996 and references therein), a Galactic foreground column density of (Dickey & Lockman, 1990) and a distance of 13.19 Mpc (§5).
| Star | |||||||
|---|---|---|---|---|---|---|---|
| ID | (h m s) | (° ′ ″) | (mag) | (mag) | (mag) | (mag) | (mag) |
| 1 | 12 21 38 | 04 30 26 | 16.990.03 | 17.690.03 | 17.330.05 | 16.960.06 | 16.590.05 |
| 2 | 12 21 40 | 04 28 18 | 19.490.05 | 18.380.04 | 17.850.01 | 17.400.02 | |
| 3 | 12 21 44 | 04 25 24 | 17.910.04 | 18.090.02 | 17.650.01 | 17.300.02 | 16.940.01 |
| 4 | 12 21 48 | 04 32 27 | 18.380.11 | 17.610.01 | 16.020.01 | 15.100.01 | 14.340.01 |
| 5 | 12 21 50 | 04 34 20 | 19.100.21 | 18.450.04 | 17.250.01 | 16.550.01 | 15.990.01 |
| 6 | 12 21 57 | 04 34 38 | 16.060.01 | 15.720.00 | 14.880.00 | 14.360.01 | 13.940.00 |
| 7 | 12 22 04 | 04 32 30 | 16.660.02 | 16.300.00 | 15.480.01 | 15.000.01 | 14.610.01 |
| 8 | 12 22 05 | 04 30 51 | 18.050.06 | 18.170.01 | 17.600.04 | 17.250.03 | 16.930.01 |
| 9 | 12 21 43 | 04 31 54 | 19.560.41 | 19.200.05 | 17.550.01 | 16.530.01 | 15.510.01 |
| 10 | 12 21 33 | 04 29 29 | 19.110.43 | 18.960.02 | 18.550.02 | 18.210.05 | 17.890.02 |
Note. — Errors in magnitude represent RMS scatter of the night-to-night repeatability over entire period of SN monitoring.
| UT Date | JD | PhaseaaWith reference to the explosion epoch JD 2454825.6. | SeeingccFWHM of the stellar PSF at band. The nights for which we do not have any observation in band, PSF is found through interpolation. | |||||
|---|---|---|---|---|---|---|---|---|
| (yy/mm/dd) | 2454000+ | (day) | (mag) | (mag) | (mag) | (mag) | (mag) | (″) |
| 2008/12/30.00 | 830.50 | 5 | 14.230.01 | 15.330.01 | 15.070.01 | 14.860.01 | 14.860.01 | 2.9 |
| 2009/01/01.98 | 833.48 | 8 | 14.390.01 | 15.540.01 | 15.170.01 | 14.650.01 | 14.980.01 | 1.3 |
| 2009/01/09.02 | 840.52 | 15 | 15.470.02 | 15.760.02 | 15.210.02 | 14.890.02 | 14.870.03 | 2.5 |
| 2009/01/23.95 | 855.45 | 30 | 16.850.04 | 16.360.01 | 15.380.02 | 15.000.01 | 14.850.01 | 2.1 |
| 2009/01/26.02 | 857.52 | 32 | 16.900.04 | 16.410.02 | 15.390.01 | 14.980.01 | 14.850.02 | 3.1 |
| 2009/01/27.01 | 858.33 | 33 | 16.810.02 | 16.410.01 | 15.390.01 | 15.000.01 | 14.830.01 | 2.8 |
| 2009/01/28.83 | 860.33 | 35 | 16.830.03 | 16.480.01 | 15.430.01 | 15.040.01 | 14.890.01 | 2.2 |
| 2009/01/30.88 | 862.38 | 37 | 17.160.04 | 16.530.01 | 15.430.01 | 15.020.01 | 14.850.01 | 2.4 |
| 2009/02/02.89 | 864.39 | 39 | 17.110.04 | 16.530.01 | 15.420.01 | 14.990.01 | 14.780.01 | 2.0 |
| 2009/02/15.82 | 878.32 | 53 | 17.580.05 | 16.870.01 | 15.430.02 | 14.760.01 | 14.820.01 | 2.8 |
| 2009/02/16.96 | 879.46 | 54 | 17.740.06 | 16.840.01 | 15.540.01 | 15.090.02 | 14.830.01 | 3.1 |
| 2009/02/17.79 | 880.29 | 55 | 17.790.05 | 16.870.01 | 15.550.01 | 15.100.02 | 14.850.01 | 3.1 |
| 2009/02/20.87 | 883.37 | 58 | 17.920.07 | 16.940.01 | 15.590.02 | 15.090.01 | 14.840.01 | 3.1 |
| 2009/02/23.77 | 886.27 | 61 | 18.050.04 | 17.080.01 | 15.130.01 | 14.890.01 | 3.1 | |
| 2009/02/25.81 | 888.31 | 63 | 18.130.05 | 17.050.01 | 15.600.01 | 15.140.01 | 14.920.01 | 2.9 |
| 2009/02/26.80 | 889.30 | 64 | 15.620.01 | 15.150.01 | 3.8 | |||
| 2009/03/02.78 | 893.28 | 68 | 17.080.01 | 15.630.01 | 15.170.01 | 14.900.00 | 4.4 | |
| 2009/03/04.77 | 895.27 | 70 | 17.150.01 | 15.660.01 | 15.180.01 | 14.940.01 | 2.4 | |
| 2009/03/09.76 | 900.27 | 75 | 18.720.14 | 17.310.02 | 15.680.01 | 15.080.01 | 2.3 | |
| 2009/03/15.27 | 905.77 | 80 | 17.200.02 | 15.210.01 | 14.920.01 | 2.2 | ||
| 2009/03/24.80 | 915.30 | 90 | 18.730.08 | 17.420.01 | 15.940.01 | 15.480.01 | 15.150.01 | 2.5 |
| 2009/04/03.75 | 925.25 | 100 | 19.280.15 | 17.660.02 | 16.100.01 | 15.570.01 | 15.310.01 | 2.2 |
| 2009/04/05.61 | 927.22 | 102 | 15.670.01 | 15.410.01 | 2.5 | |||
| 2009/04/10.67 | 932.33 | 107 | 18.380.06 | 16.760.01 | 16.200.01 | 15.840.02 | 2.7 | |
| 2009/04/17.60 | 939.25 | 114 | 19.830.06 | 17.910.01 | 17.130.01 | 16.680.01 | 2.8 | |
| 2009/04/22.68 | 944.11 | 118 | 20.300.16 | 18.100.03 | 17.210.03 | 16.850.04 | 3.5 | |
| 2009/04/28.71 | 950.17 | 125 | 20.400.09 | 17.240.01 | 16.740.01 | 2.2 | ||
| 2009/05/01.72 | 953.10 | 127 | 20.220.11 | 18.060.04 | 17.270.04 | 16.700.04 | 2.7 | |
| 2009/05/23.69 | 975.18 | 150 | 18.300.04 | 17.470.02 | 17.000.03 | 2.7 | ||
| 2009/05/25.70 | 977.21 | 152 | 20.210.12 | 18.350.02 | 17.450.01 | 2.6 | ||
| 2009/05/26.71 | 978.22 | 153 | 20.150.17 | 18.330.04 | 17.490.02 | 17.060.03 | 2.8 | |
| 2009/06/14.69 | 997.19 | 172 | 18.390.04 | 2.9 | ||||
| 2010/01/17.98 | 1214.49 | 389 | 19.690.07 | 19.270.13 | 1.9 | |||
| 2010/01/19.91 | 1216.42 | 391 | 21.470.12 | 20.340.05 | 19.760.05 | 19.520.07 | 2.3 | |
| 2010/02/13.91 | 1241.42 | 416 | 20.570.07 | 19.770.06 | 2.2 |
Note. — The photometric observations are taken with the 1-m Sampurnanand Telescope, ARIES, Nainital. Errors in magnitude denote uncertainty.
| UT Date | JD | PhaseaaWith reference to the explosion epoch JD 2454825.6. | ||
|---|---|---|---|---|
| (yy/mm/dd) | 2454000+ | (day) | (mag) | (mag) |
| 2008/12/29.85 | 830.36 | 4.78 | 14.660.054 | 14.550.064 |
| 2009/01/03.87 | 835.37 | 9.78 | 14.600.077 | 14.380.058 |
| 2009/01/09.73 | 841.23 | 15.65 | 14.390.059 | 14.160.072 |
| 2009/01/14.73 | 846.23 | 20.65 | 14.470.107 | 14.320.150 |
| 2009/01/19.78 | 851.24 | 25.66 | 14.540.150 | |
| 2009/01/24.76 | 856.26 | 30.67 | 14.250.077 | 14.110.087 |
| 2009/01/29.87 | 861.37 | 35.79 | 14.370.050 | 14.140.065 |
| 2009/02/05.66 | 868.16 | 42.58 | 14.430.067 | 14.240.107 |
| 2009/02/11.69 | 874.19 | 48.61 | 14.200.107 | 14.590.241 |
| 2009/02/16.72 | 879.22 | 53.64 | 14.430.050 | 14.350.097 |
| 2009/02/21.75 | 884.25 | 58.67 | 14.180.063 | |
| 2009/02/27.75 | 890.25 | 64.67 | 14.440.077 | |
| 2009/03/04.89 | 895.40 | 69.82 | 14.400.074 | 14.120.085 |
| 2009/03/10.74 | 901.24 | 75.66 | 14.360.190 | |
| 2009/03/21.71 | 912.21 | 86.63 | 14.500.090 | |
| 2009/03/26.73 | 917.23 | 91.65 | 14.410.073 | |
| 2009/04/05.79 | 927.29 | 101.71 | 15.000.147 | |
| 2009/04/10.80 | 932.30 | 106.71 | 14.940.171 | |
| 2009/04/15.80 | 937.30 | 111.72 | 14.860.173 | |
| 2009/04/20.52 | 942.02 | 116.44 | 15.230.232 |
| UT Date | JD | PhaseaaWith reference to the explosion epoch JD 2454825.6. | Range | TelescopebbHET : LRS on 9.2-m Hobby Eberly Telescope; IGO : IFOSC on 2-m IUCAA Girawali Observatory, India; BTA : SCORPIO on 6-m Big Telescope Alt-azimuth, Special Astrophysical Observatory, Russia; NTT : EFOSC2 on 3.6-m New Technology Telescope, ESO, Chile. | Grating | Slit width | Dispersion | Exposure | S/NccAt 0.6 . |
|---|---|---|---|---|---|---|---|---|---|
| (yy/mm/dd/hh.hh) | 2454000+ | (days) | (gr mm-1) | (″) | (Å pix-1) | (s) | (pix-1) | ||
| 2008/12/31/22.80 | 832.45 | +7 | 0.451.00 | HET | 300 | 1.0 | 5.0 | 600 | 45 |
| 2009/01/07/22.31 | 839.43 | +14 | 0.451.00 | HET | 300 | 1.0 | 5.0 | 600 | 43 |
| 2009/02/17/19.74 | 880.32 | +54 | 0.380.68 | IGO | 600 | 1.5 | 1.4 | 1800 | 34 |
| 2009/02/22/22.50 | 885.44 | +60 | 0.451.00 | HET | 300 | 1.0 | 5.0 | 600 | 35 |
| 2009/03/22/20.45 | 913.35 | +87 | 0.380.68 | IGO | 600 | 1.5 | 1.4 | 1800 | 38 |
| 2009/03/25/22.13 | 916.42 | +90 | 0.380.68 | IGO | 600 | 1.5 | 1.4 | 2700 | 35 |
| 2009/04/03/19.14 | 925.26 | +99 | 0.380.68 | IGO | 600 | 1.5 | 1.4 | 1800 | 35 |
| 2009/04/03/20.98 | 925.33 | +99 | 0.601.00 | BTA | 550 | 2.1 | 3.5 | 3900 | 60 |
| 2009/04/22/15.49 | 944.14 | +118 | 0.380.68 | IGO | 600 | 1.5 | 1.4 | 1800 | 11 |
| 2009/04/23/18.00 | 945.25 | +119 | 0.380.79 | BTA | 600 | 2.1 | 3.5 | 3900 | 65 |
| 2009/05/17/02.38 | 968.10 | +143 | 0.330.80 | NTT | 300 | 1.0 | 4.0 | 2700 | 59 |
2.3. Optical Spectroscopic Observation
Long-slit low-resolution spectra ( 6 to 14 Å ) in the optical range (0.33 1.0 ) were collected at eleven phases from +7d to +143d, including five phases from the 2-m IGO, three phases from the 9.2-m HET, two phases from the 6-m BTA and one epoch from the 3.6-m NTT 555The full names of the telescope are provided in Table 5. A journal of spectroscopic observations is given in Table 5. The spectroscopic data acquired from IGO, NTT and HET were reduced under the IRAF environment. Bias and flat-fielding were performed on all the frames. Cosmic-ray rejection was done using the Laplacian kernel detection method (van Dokkum, 2001). All the data obtained from the BTA were reduced using programs in the IDL software environment.
The instrumental FWHM resolution of 2-m IGO spectra as measured from the [O i] 5577 emission skyline was found to lie between 6 and 10Å ( 322 - 510 ). Flux calibration was done using standard spectrophotometric fluxes from Hamuy et al. (1994), assuming a mean extinction for the site. For HET, BTA and NTT, the resolution near 6000Å is about 10Å, 14Å , and 12Å respectively.
3. Light Curve Evolution
According to theoretical interpretation, the entire broadband evolution of Type II SNe can be segmented into three phases: the rising phase, the plateau phase and the nebular phase.

3.1. The Rising Phase
The rising phase of the light curve is associated with the shock breakout phenomenon having been theoretically predicted for an SN explosion, in which, the radiation-dominated shock wave, generated through the reversal of iron core-collapse, starts to propagate outward through the onion shell-like layers of the progenitor; when the shock reaches regions with an optical depth of a few tens to unity, the radiation behind the shock escapes the outer surface giving rise to a hot (T K) fireball which emits quasi-black body radiation in UV and soft-Xrays. This phenomenon is called shock breakout and depending on envelope mass, density structure and wind properties of the progenitor, the breakout light curve may last from a few hours to few a days (Grassberg et al. 1971; Chevalier 1976; Falk & Arnett 1977). Due to the short timescale, the detection of shock breakout is rare, and only recently were, the UV light curves of the entire shock breakout phase lasting several hours was reported for two Type IIP SNe SNLS-04D2dc and SNLS-06D1jd (Gezari et al. 2008; Schawinski et al. 2008). Observation of the earliest UV and optical light curves of IIP SNe is crucial to model the shock breakout light curves and constrain the properties of SN progenitors (Tominaga et al., 2009). The earliest SNe IIP optical light curves have been studied in the past for SN 2005cs by Pastorello et al. (2009) and for SN 2006bp by Quimby et al. (2007) and the optical rising phase is rarely observed.
We model the early optical (ROTSE-IIIb -band) light curves of SN 2008in using a simple model and put an observational constraint on the epoch and duration of shock breakout. Following the formulation of Waxman et al. (2007), it can be shown that just after the shock breakout, the intensity of the SN light at a fixed wavelength is proportional to the intensity of blackbody radiation at that wavelength (see Equation 1 of Cowen et al. 2010), while for the plateau phase Arnett (1980) derived an analytical expression (Equation 39 of that paper) and hence by combining these two equations one can approximate the overall intensity profile of a Type II SN during the rising phase through the plateau with the following expression :
| (1) |
Here, the first term represents the phase associated with the shock breakout while the second term represents the plateau phase. Here ‘’ is the time measured in days since 2008 December 23.95 (JD = 2454823.5), the epoch when ROTSE had a non-detection of the SN with limiting magnitude 16.16 in the band. The time of shock breakout, ‘’ along with the constants and are free parameters of the fit. The values of these constants depend on the nature of the progenitor and the kind of explosion. The above model is fitted to the ROTSE data using the minimization technique (Press et al., 1992) and the fit is shown in Figure 3. We obtained a value of the shock breakout time as day. This value of is consistent with the first data point observed from ROTSE. We shall adopt , corresponding to JD = 2454825.6 as the explosion epoch for all the phases of SN 2008in. It is noted that at and bands, the SN was detected by Nakano et al. (2008), just 2.4 d after the shock breakout. We note, however, that depending on the extent of the envelope the true core reversal marking the SN explosion would have occurred a few hours earlier (e.g., SN 1987A) or a few days earlier for a red supergiant envelope (Quimby et al., 2007).
In Figure 3, ‘’ (+5.3 d) corresponds to the peak of the ROTSE -band light curve. A similar peak in the UV light curves of the post-shock breakout phase of the Type IIP supernova SNLS-04D2dc lasting several days was identified as a secondary peak and this peak was explained as the shift of the spectral energy distribution toward longer wavelengths due to the rapid fall in temperature during free adiabatic expansion of optically thick plasma lead by a collisionless shock (Schawinski et al. 2008; Tominaga et al. 2009). For SN 2008in we identify the peak in the ROTSE -band curve as a secondary peak and also speculate that for a few other type IIP SNe such as 1999em, 1999gi and 2005cs, where very tiny peaks before the plateau light curve were observed, such features are basically the footprints of the secondary peaks which could be a consequence of shock breakout.
3.2. The Plateau and Nebular Phase
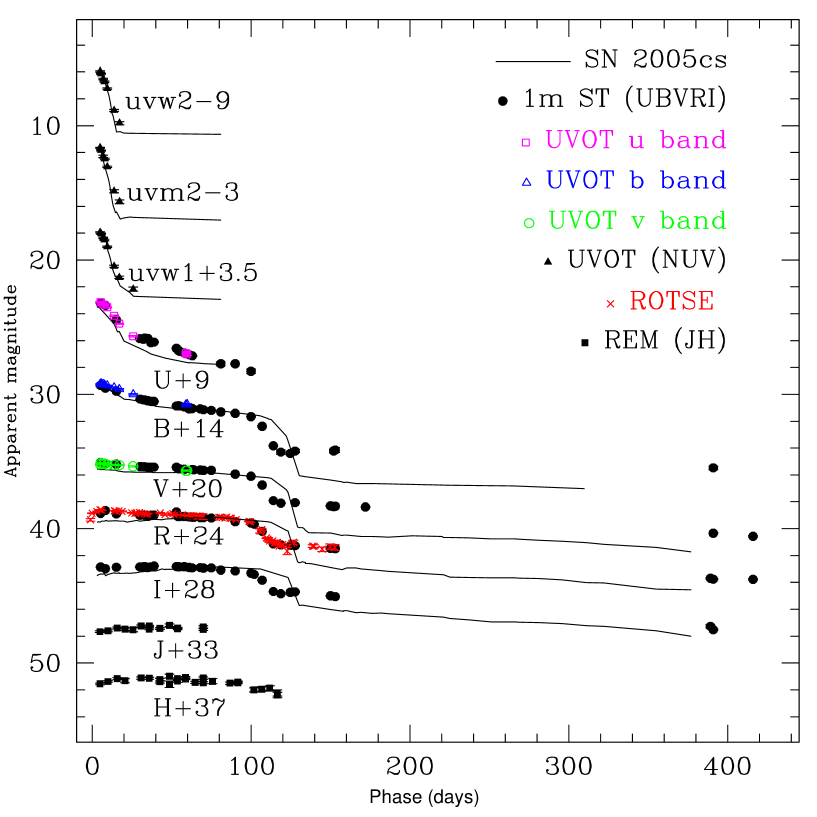
The entire UV, optical and NIR light curves of SN 2008in are shown in Figure 4 and for comparison, the light curves of the archetypal low-luminosity SN 2005cs (Brown et al., 2009; Pastorello et al., 2009) are also plotted by scaling them in magnitude to match it with the observed plateau of SN 2008in. In the early plateau phase, a rapid drop in the UV flux and a slowly declining or constant optical and NIR flux are clearly apparent. The magnitude declined from about 14.7 to 18.7 mag within 12 days. The decline rates of the SN 2008in flux in UVOT, , , and bands are almost identical with that of SN 2005cs. Starting from the until the band, the measured decline rates from shock breakout to the plateau phase are approximately 0.32, 0.34, 0.25, 0.13, 0.04, 0.01 and 0.01 mag d-1. The light curves are almost flat even at early phases of the plateau. For this SN, the plateau is well sampled in the bands, so we can accurately determine the plateau duration. As discussed in §3.1, the secondary peak ( d) in the prompt light curve is generated by the gradually cooling shock heated SN atmosphere and after that the plateau mechanism starts to dominate. On the other hand, between the plateau and the nebular phase there is another transitional state, when an inflection in the light curve can be seen (§7.1). Hence the plateau duration is precisely the time span between the secondary peak and the inflection. The inflection () in the band light curve is observed to occur nearly 103.2 days after the shock breakout. Hence the time interval between the and is assumed as the duration of the plateau i.e. days.
Once the hydrogen envelope is fully recombined and the ejecta becomes optically thin, the light curve enters into the nebular phase and it is sustained mainly by the energy output from the radioactive decays of the iron-group elements. During the plateau to nebular transition phase, the -band magnitude drops from 16.0 mag at around +90d (still in the plateau) to 18.1 mag at +122d (in the exponential light curve tail), i.e. 2 mag in about one month. This drop is remarkably smaller than that of SN 2005cs, but consistent with the 2-3 mag drop observed in normal Type IIP SNe (Olivares E. et al., 2010). A linear fit to the tail from +120d to +400d gives the following decline rates [in mag (100d)-1]: , , , at and bands which are similar to the values found in normal IIP SNe and comparable with the decay slope of 56Co to 56Fe, i.e. 0.98 mag (100d)-1.
4. Spectroscopic Evolution
The spectra of SN 2008in at 10 phases from +7d to +143d are shown in Figure 5. The spectra are corrected for the recessional velocity of the host galaxy ( )666http://leda.univ-lyon1.fr/. Spectral features are mainly identified as per previously published line identifications for IIP SNe (Leonard et al., 2002; Pastorello et al., 2004). The two earliest spectra (+7d and +14d) show the blue continuum of blackbody emission and have broad P-Cygni profiles of H , H and He i 5876. The next two spectra (+54d and +60d) represent the mid-plateau phase and are marked by a decrease in the continuum and the appearance of more number of P-Cygni profiles for the permitted metallic (Fe ii , Sc ii,, Ti ii , Ba ii , Mg ii ), O i 7773, Na i D, and Ca ii IR triplet lines similar to other normal Type IIP SNe (see Roy et al. 2011 and references therein). The spectra at phases +87d, +90d and +99d represent the end stages of the plateau and these are marked by a redder continuum and decreasing line widths of hydrogen lines. The +118d, +119d and +143d spectra represent the nebular phase having negligible continuum and are marked by pronounced emissions of forbidden lines [Ca ii] 7291, 7323, and fading of the absorption features of hydrogen and metallic lines.


In Figure 6, we compare the +99d spectrum of SN 2008in with the spectra of other Type IIP SNe observed at similar phases that is at roughly the time when the light curve changes from the photospheric plateau to the nebular phase. The phases quoted for each event are with reference to the moment of inflection (; see Figure 3). The narrow P-Cygni H profile and the presence of strong lines of Ba ii at 6142 and 6497 of SN 2008in show striking resemblance to the low-luminosity SNe 1997D, 1999br, 1999eu, 2001dc and 2005cs. On the other hand, the normal Type IIP SNe 2004et, 2008gz show broader profiles of H and weaker lines of Ba ii . It is noted that in the blue wing of H more metallic lines get resolved than that in the normal IIP SNe and this arises due to smaller line widths of hydrogen lines seen in low-luminosity IIP SNe (Fraser et al. 2010 and references therein). In addition, the Ba ii line in the low-luminosity SNe show stronger absorption components due to lower ejecta temperature than that in the normal luminosity Type IIP SNe 2004et and 2008gz (Turatto et al., 1998). In Figure 7, we have identified the spectral features in a late-plateau phase (+99d) spectrum which covers the full wavelength range from 0.4 to 0.95 . For line identification we have followed Pastorello et al. (2004), where different spectral lines were identified for the +102d spectrum of a low-luminosity SN 1999br. We are able to identify all the features and the spectral profiles of all the elements are similar to the archetypal low-luminosity IIP SNe 1997D, 2005cs and 1999br (Pastorello et al. 2004 and references therein).


Figure 8 shows the spectral evolution of H , H , Na i D, Fe ii , Ba ii , and Sc ii lines. In Figure 9 (left panel), we show the expansion velocities of the ejecta derived from Balmer and Fe ii lines. The later is a good indicator of photospheric velocity. The expansion velocities of the H-envelope are estimated using absorption minima of the P-Cygni profiles and at the two earliest phases (+7d and +14d) H and H show a broad P-Cygni profile which, with time, becomes narrower at later phases keeping the position of the emission peak centered near zero velocity. The H line velocity starts at about 7000 at +10d, reaches 4000 at +50d and flattens at a level of 1200 in the nebular phases. It can be seen from the right panel of Figure 9 that in the comparable phases, the H line velocities of low-luminosity SNe are less than half those of normal IIP SNe 1999em and 2004et, whereas the SN 2008in velocities are more like low-luminosity SN 2005cs. To estimate the photospheric velocity of the transient we have computed the velocities of different Fe ii lines 4924, 5018, and 5169 at different phases. The first marginal detection of these lines is in the +14d spectrum and they became prominent in later stages of evolution. For SN 2008in , the average velocity of these lines (and hence roughly the photospheric velocity) at +14d is about 4450 , which is comparable with that of low luminosity SNe and much less than ordinary Type IIP events (see Figure 12 of Pastorello et al. 2009).


The emergence of absorption dips in the blue wings of H is clearly seen in the post +60d spectra 777This is the first time that the rapidly changing evolution of H profiles during the late plateau to nebular phase has been so densely covered in a low-luminosity SN and the absorption dips have been marked with A, B and C in Figure 8. We distinguish ‘A’ as an absorption dip due to Ti ii and H and its equivalent width (EW) increases from 12.85 Å at +60d to 19.45 Å at +143d. This progressively stronger absorption dip requires a steep deceleration of the H emitting zone along with its depletion by inner metal shells (like Ti ii ). The broader absorption dip ‘B’ is identified as a blend of Ba ii 6497, Ba i , Ca i and Ti ii. An exceptionally strong Ba ii lines is quite typical for cooler ejecta of less energetic fain SNe. The segment ‘C’ is speculated to be a footprint of Fe ii multiplets as the evolution of its linewidths seems to be correlated with the other Fe ii lines. It is noted, however, that in a few normal Type IIP SNe 1999em, 2004et and 2008gz, the spectral feature near ’C’ at early plateau phases was also identified as a signature of high velocity H component, and in the present spectra its presence cannot be completely ruled out.
The evolution of H is similar to the evolution of H. The P-Cygni profile of H is clearly visible in the +7d spectrum, and later on, the emission component is blanketed by various metal lines, mainly due to Fe ii 4924, 5018 and 5169. Traces of H and Fe ii absorption dips indicate that from the beginning of the nebular phase H shells of ejecta and the regions containing Fe ii ions move with a comparable velocity, reaching an asymptotic value 1000 nearly 140 days after the explosion. In the +14d spectrum, Fe ii lines are marginally detected while in the spectra between +60d and +99d they are prominent. We investigate the temporal change of EW of a relatively less blended Fe ii 4924 and from the spectra normalized to the H peak value, we found that at an EW 0.67 Å at +14d, increased to 17.45 Å at +54d and to 26.53 Å in the +99d spectrum. Later on, the EW decreased to 19.07 Å in the +118d spectrum and finally reaches to 18.27 Å in the +143d spectrum. This rapid fall in the EW of inner metal-rich shells plausibly indicates a decrease in the opacity of the SN inner ejecta.
Traces of the He i 5876 line are also seen in the +7d spectrum (Figure 8). The ratio of EWs between H and He i for this spectrum is EW(H )/EW(He i ) . In the +14d spectrum, this ratio has increased to 5.36. The steep decrement in EW of He i seems to be due to a quick recombination of He i ions as a result of the rapid fall in temperature of the constantly rarefying ejecta. From +54d, the emerging P-Cygni feature of Na i D becomes prominent. This feature seems to be a perfect P-Cygni throughout our entire spectral sequence. It simply indicates an uniform spherical distribution of Na i in the SN ejecta. In the three high S/N spectra labeled with +54d, +60d and +87d, a tiny absorption dip overlaid on the emission component of the Na i D P-Cygni is seen and since these spectra are redshift corrected, these dips are impressions of intervening interstellar matter present in the host galaxy. The absence of any similar absorption dip in the blue wing of the Na i D profile, expected from the Galactic interstellar matter, confirms that there is little absorption from the Milky Way in the line of sight of SN 2008in .
The spectral evolution of Sc ii 6248 and the s-process element Ba ii 6142 is clearly seen in SN 2008in . In the +7d and +14d spectra, there is no clear evidence for the presence of these two elements; however in the +54d spectrum they are prominent. The absorption components become stronger with time and persist until the +143d spectrum. In contrast, in the normal Type IIP SNe 2004et (Sahu et al., 2006), 1999em (Elmhamdi et al., 2003) and 2008gz (Roy et al., 2011) these features disappeared at 170 day after the explosion. The ejecta of underluminous Type IIP SNe expand at a lower velocity than those of normal ones. So, the Ba lines in low luminosity events persist for a longer time just because the ejecta takes more time to cool-down. As a result it takes longer time to become optically thin.
In the nebular phase, the forbidden lines: [Ca ii] 7291, 7323, [O i] 6300, 6364 and [Fe ii] 7155 are among the strongest features visible in the spectra. Also, the line ratios of emission lines of Ca ii and the O i doublet in late nebular phases is a good indicator of the progenitor mass (Fransson & Chevalier, 1987). In Figure 10, we compare the +139d and +283d spectra of SN 19997D (Benetti et al. 2001) with the nebular phase spectra of SN 2008in. The [Ca ii] doublet is seen in the +99d, +119d and +143d spectra of SN 2008in, whereas a small footprints of the O i doublet can be seen in the +143d spectrum. Presence of [Fe ii] line is not seen in our spectra. Considering that the explosion epoch of SN 1997D was quite uncertain, it is likely that the spectral evolution of H and forbidden lines of SN 2008in is quite similar to that of SN 1997D.
5. extinction and distance toward SN 2008in
In order to determine the bolometric light curve and other physical parameters, a correct estimate of the extinction and distance toward the SN is essential. We adopt the Galactic reddening along the line-of-sight of SN 2008in as derived from the 100 all sky dust extinction map (Schlegel et al., 1998), i.e. = mag. In order to estimate reddening due to the host galaxy M61, we used the spectrum of SN 2008in taken on 2009 February 17 from the 2-m IGO telescope having good S/N ( 40) and corrected for mean heliocentric radial velocity of the host ( ). Near the zero velocity, the spectrum showed a tiny absorption feature overlaid on the emission component of the P-Cygni profile of Na i D (§ 4). The EW of this absorption feature was computed as 0.5350.713 Å. The error in EW is estimated using Equation 6 of Vollmann & Eversberg (2006). It is known that the EW of the interstellar absorption bands is well correlated with the reddening estimated from the tail of SN Ia color curve (Barbon et al., 1990; Richmond et al., 1994; Turatto et al., 2003) and hence using the empirical relation EW (EW in Å), given by Turatto et al. (2003), we obtain the host contribution as , which is considerably higher than the Galactic contribution. This is consistent with the absence of any absorption feature due to Galactic interstellar matter in the blue wing of the emission component of Na i D profile. Consequently, we adopt (estimated as a sum of Galactic and host galaxy reddening) of 0.09840.104 mag for SN 2008in. This corresponds to a visual extinction () of . Considering the uncertainty in the estimated using Na iD lines, a lower value of of 0.04480.0006 mag (twice the Galactic reddening) and the corresponding of cannot be ruled out. We will discuss its implication for the derived properties of the SN.
The Hubble flow distance of the host galaxy M 61, after correction for the Virgo infall, is estimated as 13.71.1 Mpc 888The cosmological model with = 70 Mpc-1, = 0.3 and = 0.7 is assumed throughout the paper and the uncertainty corresponds to a local cosmic thermal velocity of 208 (Terry et al., 2002).. The distance estimated through the Tully-Fisher method is Mpc999http://nedwww.ipac.caltech.edu/. Additionally, we also calculated the distance following the Standard Candle Method for Type II SNe (Hamuy & Pinto, 2002; Hamuy, 2005; Hendry et al., 2005). It is found that there is a strong correlation between the distance of Type IIP SNe along with their mid-plateau apparent and band magnitudes and the mid-plateau photospheric velocity, for a given cosmological model. For SN 2008in we estimate the mid-plateau (d) apparent magnitudes mag for and mag for the band. Considering the and band extinctions toward the SN, mag and mag respectively, we derive a distance of Mpc. The adopted value of mid-plateau photospheric velocity is (see §7.2). Combining the above three measurements, we adopt the weighted mean distance of Mpc, which corresponds to a distance modulus of .
6. Color Evolution and Bolometric Flux
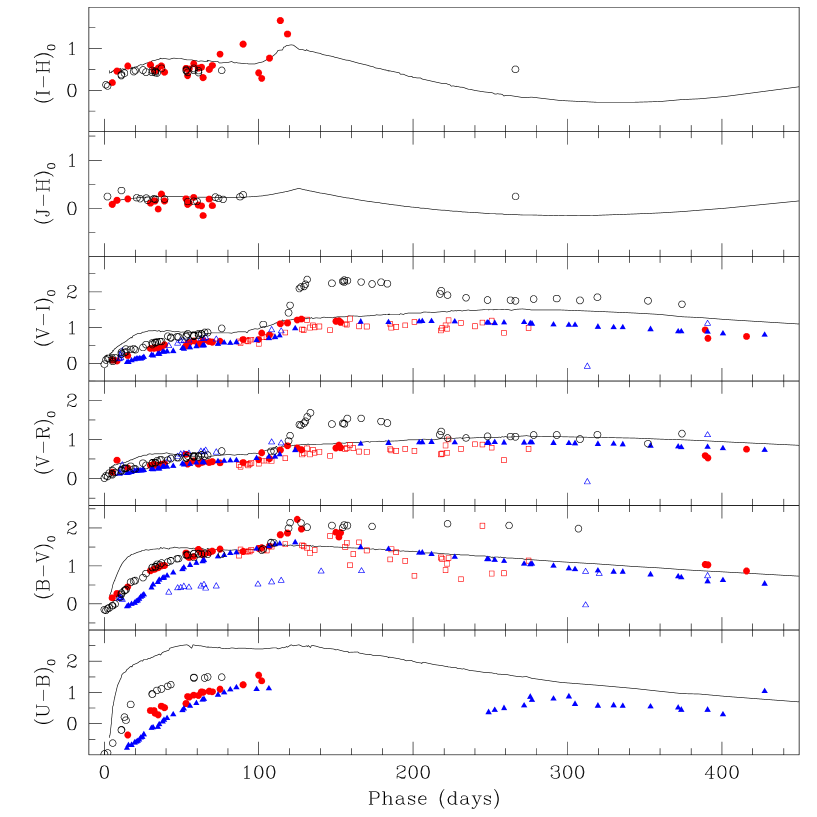
Figure 11 shows the temporal evolution of the reddening-corrected broadband colors of SN 2008in. For comparison, we overplot the color curves for well studied SNe 1987A (Suntzeff & Bouchet, 1990), 1999em (Elmhamdi et al., 2003), 2004et (Sahu et al., 2006; Maguire et al., 2010), 2005cs (Pastorello et al., 2009) and SN 2008gz (Roy et al., 2011). After small differences during the initial phases, the plateau phase color evolution of all Type II SNe is more or less similar. The and colors are blue during early photospheric phases and they become redder by about 1-2 mag in the plateau phase while the and colors evolves slowly and become red only by about 0.5 mag. The color remains constant at 0.25 mag. During the transition phase from plateau to nebular, the low luminosity SN 2005cs showed a striking red peak in the , and colors. For SN 2008in , this red peak is not present and its color evolution is found to be consistent with the normal Type IIP SNe.
The quasi-bolometric light curve estimated from the UV, optical and IR broadband () magnitudes of SN 2008in is shown in Figure 12 along with those of other Type II SNe. The extinction-corrected magnitudes are first converted into fluxes using zero-points given by Bessell et al. (1998) and then the total flux in bands is obtained after a linear interpolation and integration between 0.203 and 1.67 . The fluxes were calculated on those nights for which we had complete observations in bands. For the initial two weeks the SN was detected by Swift/UVOT in near ultraviolet bands with a significant flux density. This contribution has been accounted for while measuring the net flux. It has been assumed that contribution in the band is mainly important during the plateau and decreases rapidly to about 5% in the nebular phase (see Misra et al. 2007; Roy et al. 2011 and references therein). From the light curve it is noticeable that the near ultraviolet flux is almost negligible beyond 20 days after explosion. The contribution during the plateau is calculated from our data, whereas for the nebular phase, due to lack of data, we are not able to make any direct measurement. For most low luminosity SNe IIP, the NIR flux contribution in the nebular phase is about 50% of the total flux (Pastorello et al., 2009). We have therefore increased the net flux by 55% to account for the maximal contributions from the and NIR bands at phases later than +140d. Figure 6 and 12 clearly demonstrate that spectroscopically SN 2008in appears to be like low-luminosity SNe IIP, but photometrically it appears quite normal. In the following section, the curve is used to estimate the amount of radioactive 56Ni and other physical parameters that characterize the explosion and the progenitor star.

7. Physical Parameters
The physical entities that seem to govern the entire scenario are mainly associated with the nature of the progenitor and the radioactive elements (mainly 56Ni), generated inside the inner portion of the ejecta during the explosion. 56Ni is synthesized by the explosive burning of Si and O during the shock breakout (Arnett, 1980, 1996). Over time this material is eventually converted to 56Co and then to 56Fe by means of radioactive transitions having decay times of 8.77 and 111.3 days respectively. The -rays and neutrinos emitted during this process sustain the nebular phase light curve and consequently, the observed tail luminosity becomes a good tracer for the ejected synthesized 56Ni.
7.1. Produced Radioactive Nickel
We use different methods to estimate mass of 56Ni. Hamuy (2003) proposed a relation between bolometric tail luminosity and the synthesized 56Ni during core collapse SNe, by considering the underlying assumption that all -rays emitted during the radioactive decay make the ejecta thermalised. For SN 2008in , the time interval spanned by the observations is about 416 days, where the first 100 days are reserved for photospheric evolutionary processes. The average band magnitude during the nebular phase calculated using the data between +114d and +416d is 18.91, which corresponds to the magnitude at +222d. Taking the extinction correction as ( mag; §5), a bolometric correction of mag (Hamuy, 2001) and a distance modulus , the derived tail luminosity at this fiducial time is . Within the errors, this value is consistent with the bolometric flux at a comparable epoch, determined in §6. This implies that the amount of 56Ni produced is this process is .
All Type IIP SNe show an inflection in the light curve during the transition from the plateau to the nebular phase. Statistically it has been shown that the steepness of the -band light curve slope (defined as S=d/dt) at the inflection time () is anti-correlated with 56Ni mass (Elmhamdi et al., 2003). For SN 2008in , the band light curve with its well-sampled transition phase, shows a value of steepness mag d-1 (Figure 13) and the epoch of inflection is +101.5d with respect to date of discovery. This corresponds to . This result is consistent with the value measured using the Hamuy (2003) scheme. According to Elmhamdi et al. (2003), the amount of 56Ni can also be derived from the plateau absolute -band magnitude using the relation . Here is the absolute magnitude 35 days prior to the day of inflection. For SN 2008in , , which again corresponds to a 56Ni mass around 0.016.
Comparison of the tail luminosity with that of SN 1987A a well studied proximate event, is also used for estimation of the 56Ni mass. A linear least square fit on the nebular light curve tail shows that at +222d the luminosity of SN 2008in is about 1.54, while SN 1987A had a luminosity (Figure 12). Since the 56Ni mass produced by SN 1987A is about 0.075, the amount of 56Ni in the case of SN 2008in is .
The above estimates are consistent with each other and hence we adopt a mean value for 56Ni mass as
7.2. Explosion Energy and Mass of Progenitor Star
We use the radiation-hydrodynamical simulations of core-collapse IIP SNe by Dessart et al. (2010) to infer the explosion energy ( - kinetic plus thermal, expressed hereafter in units of erg or foe). These simulations suggest that in a given progenitor larger explosion energies yield larger ejecta velocities and this implies that the ejecta kinematics can be used to put constraint on . For SN 2008in, the expansion rate of the H-rich progenitor envelope as derived from absorption minima in H at 15d after shock breakout is about 6300 (see Figure 8), which is higher than 4700 (for SN 2005cs; Pastorello et al. 2009) and lower than 8800 (for SN 1999em; Elmhamdi et al. 2003). For the SNe 2005cs and 1999em, the simulation results (for explosion of a non-rotating solar metallicity pre-SN stars) predicted 0.3 foe and 1 foe respectively and these values are found to be consistent with that determined from the actual hydrodynamical modeling of the SN light curves, e.g. 0.4 foe (Utrobin & Chugai, 2008) and 0.3 foe (Pastorello et al., 2009) for SN 2005cs; 1.3 foe (Utrobin, 2007) and 1.25 foe (Bersten et al., 2011) for SN 1999em. For SN 2008in , the simulations suggest 0.5 foe.
Accurate determinations of explosion parameters such as , the ejected mass () and the pre-SN radius () of the progenitor require detailed hydrodynamical modeling of the light curves and spectra and this being a non-trivial task (beyond the scope of this paper) has only been attempted for a few SNe. In order to have an estimate of explosion parameters of SN 2008in here, we employ the analytical relations derived by Litvinova & Nadezhin (1985) correlating the observed parameters ( - the mid-plateau absolute magnitude at , - the mid-plateau photospheric velocity and -the plateau duration) with the physical parameters (, and ) based on a grid of hydrodynamical models for different values of physical parameter for Type IIP SNe. We note, however, that these approximate formulae have limitations owing to the poorly-measured observables and the simplified physical conditions such as non-inclusion of the effect of nickel heating, use of old opacity tables, neglecting the effect of line opacity and using outdated pre-SN models (Smartt et al. 2009; Bersten et al. 2011 and references therein). As a result, only approximate values of the physical parameters can be derived using these relations. Fortunately, the observed parameters are derived very accurately for SN 2008in. The is days (§3.2), the is 101010This is the mean value of the velocities computed from the lines of Fe ii 4924, 5018 and 5169 in the +54d spectrum. and the is estimated as mag111111These observed values of and can be compared with the estimates derived empirically between the mass of 56Ni, and the and for a larger sample of IIP SNe (see Section 8.3 of Roy et al. 2011). Using the 56Ni mass of we find and mag which are consistent with those measured observationally. Now, employing analytical relations, we estimate 0.54 foe, and . The explosion energy derived in this way is consistent with that predicted from the hydrodynamical simulations of the ejecta kinematics.
The explosion energy of SN 2008in indicates that the event was less energetic than the standard IIP SNe 1999em, 2004et and more energetic than SN 2005cs. Assuming a net mass loss M⊙ due to stellar wind 121212SN 2008in was not detected in X-ray. The lack of X-ray emission can be used to constrain the mass-loss rate of the progenitor system that could be heated by the outgoing shock to X-ray emitting temperatures. Following the discussion in Immler et al. (2007) and references therein, an upper limit to the pre-SN mass-loss rate of with an uncertainty of a factor of two to three is obtained. and accounting for a compact remnant with mass M⊙ (Sahu et al., 2006), we find that the initial mass of the progenitor to be M⊙.

8. Discussion in context of other Type IIP SNe
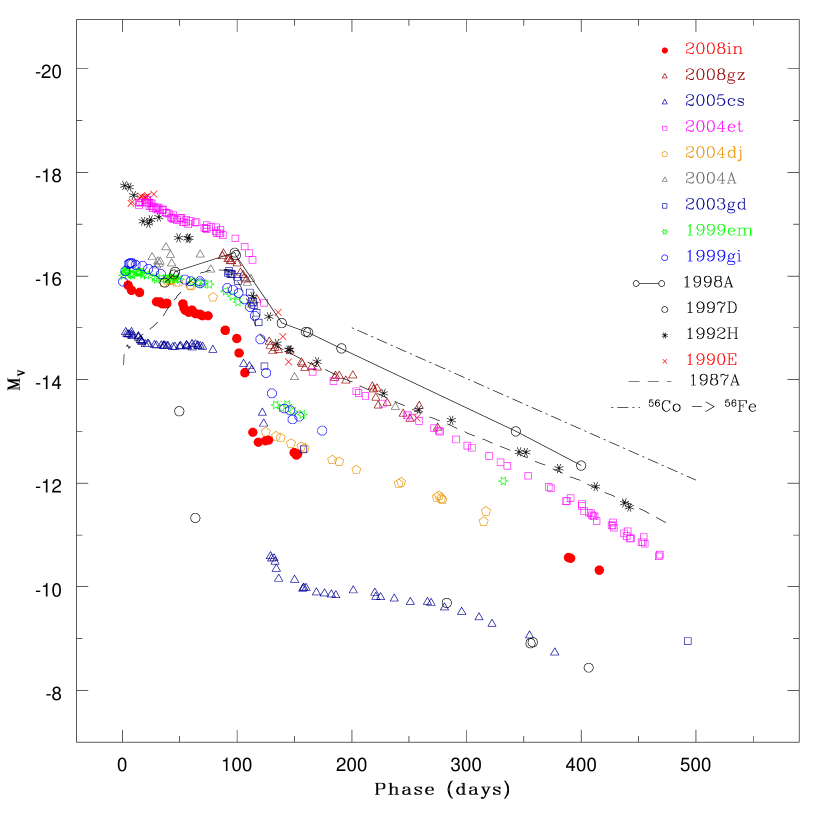
In Figure 14, we compare the light curve of SN 2008in in absolute -band magnitude with a sample of 13 other well studied Type II SNe taken from the literature (see Misra et al. 2007 and Roy et al. 2011 for the references). The sample includes two low-luminosity Type IIP SNe 1997D, 2005cs; nine normal Type IIP SNe 1990E, 1992H, 1999gi, 1999em, 2003gd, 2004A, 2004dj, 2004et, 2008gz and two peculiar Type II SNe 1987A, 1998A. It is seen that the Type II SNe show a wide range of mid-plateau luminosity, i.e. from to mag. The data on low luminosity SNe (see also Table 4 in Pastorello et al. 2006) indicate that their lie between and mag, with the only exception of SN 2002gd, whereas the other SNe are seen to lie between and mag. With the of mag131313Considering a lower value of , we get , the SN 2008in present another case which occupies the gap between a low and normal luminosity Type IIP events.
The tail luminosity is an important indication of ejected nickel mass. The average tail luminosity of SN 2008in (Mv ) is nearly 2.3 mag brighter than those of the low luminosity SNe 1997D and 2005cs ( mag), and about 1.3 mag fainter than the normal Type IIP SNe 1992H, 2004et and 2008gz ( mag). A close inspection shows that the average tail luminosity of SN 2008in is roughly similar to Type IIP SNe 2004dj in NGC 2403 and 2003gd in M74, whereas their plateau is brighter ( mag at mid-plateau) than SN 2008in . These comparison of nebular phase luminosities with other SNe are consistent with a quite modest radioactive 56Ni production for SN 2008in (§7.1).
The luminosity and shape of the tail depend on the 56Ni mass and the radiant energy per unit ejected mass (). The first parameter determines the absolute magnitude, while the second determines its decay rate (see Turatto et al. 1998 and references therein). The measured value of ejected 56Ni mass for SNe 2003gd, 2004dj and 2008in are respectively (Hendry et al., 2005), 0.017 (Vinkó et al., 2006) and 0.015 . These are more than twice the 56Ni amount synthesized by the low-luminosity SNe 1997D ( , Turatto et al. 1998) and 2005cs ( , Pastorello et al. 2009), although at least three times less than the 56Ni produced by normal Type IIP SNe such as 1992H ( , Clocchiatti et al. 1996), 2004et ( , Sahu et al. 2006; Maguire et al. 2010) and 2008gz ( , Roy et al. 2011). Similarly, the measured value of ratio for SN 2008in is larger than that for the low-luminosity SN 1997D and lower than other Type IIP events 141414 The measured value of the ratio for SN 2008in is erg -1, which is twice the E/M ratio measured for SNe 1997D (erg -1, Turatto et al. 1998), but it is half those of SN 2008gz (erg -1, Roy et al. 2011), SN 2004dj (erg -1, Vinkó et al. 2006) and SN 2004et (erg -1, Sahu et al. 2006). Finally, it is barely a third the E/M ratios of SNe 1987A (erg -1, Hamuy 2003) and 2003gd (erg -1, Hendry et al. 2005), and about seven times smaller than the luminous event like SN 1998A (erg -1, Pastorello et al. 2005)..
Though we have an approximate value of the pre-SN radius (128 ), it can be seen that the progenitor radius of SN 2008in is smaller than or comparable to that of low-luminosity SNe 1997D ( , Turatto et al. 1998), 2005cs ( , Pastorello et al. 2009, Utrobin & Chugai 2008), 1999br ( , Zampieri et al. 2003) and much smaller than that of normal Type IIP SNe like 1992H ( , Clocchiatti et al. 1996), 2004et ( , Misra et al. 2007). We also note that SN 2008in progenitor is only slightly larger than the blue supergiant progenitors of SNe 1987A and 1998A (Pastorello et al., 2005).
Information about the metallicity of the SNe location is essential to constrain the triggering mechanism of the SN explosion (Heger et al., 2003). The oxygen abundance [O/H] of SN 2008in is about 8.44 dex 151515Derived from the [O/H]()- relation given by Pilyugin et al. (2004) for a given deprojected radius and galaxy type. The host of SN 2008in is a spiral galaxy of SBbc Type and the SN location is away from the center of the host. This corresponds to a deprojected distance kpc. which is marginally lower than the solar value of 8.65 dex (Asplund et al., 2009). A comparison 161616We have taken the [O/H] value from Smartt et al. (2009), though for a few cases the values are estimated using the [O/H] relation mentioned in Pilyugin et al. (2004). The [O/H] for normal Type IIP SNe 2008gz, 1999em and low-luminosity SNe 1999eu, 2005cs is about 8.6. For the low-luminosity SNe 1994N, 1999br, 2001dc, 2003gd and 2004dj, 1997D and the normal SN 2004et, it is about 8.4. In many cases, we have adopted the [O/H] value from Smartt et al. (2009). For some cases we have estimated the value by adopting the [O/H] relation mentioned in Pilyugin et al. (2004). of [O/H] of all the events in our sample indicate that there is no clear trend in the type of event and the metallicity.
The photometric and spectroscopic comparisons of SN 2008in with some Type II SNe covering a wide range of physical parameters puts observational constraints on the nature of the progenitor of this event, pointing toward a star that was more compact than a typical M-Type red supergiants, and closer to a blue supergiant, may be an yellow supergiant. However, the direct detection of the progenitors of a few faint SNe IIP in pre-explosion archive Hubble Space Telescope images seems to contradict this conclusion (see Smartt et al. 2009 for a review). Our spectroscopic study suggests that in SN 2008in the hydrogen envelope ejected by the explosion is smaller than in most Type II events but larger than that ejected in low luminosity events (such as SN 1997D, SN 1999br and SN 1999eu). This may be due to a significant mass loss of the parent star in the latest stages of its life. This conclusion is also partially supported by the upper limit mass loss rate of the progenitor revealed from the X-ray study (§7.2). In view of the upper mass limit of 20 M⊙ progenitor, occurrence of the event in a sub-solar metallicity region and following the evolution of a single massive star as a function of metallicity (Heger et al., 2003), we rule out the possibility of “fall back of ejecta to BH” scenario in case of SN 2008in , supporting the scenario of a weak explosion of a relatively compact progenitor.
9. conclusion
Low-luminosity Type IIP SNe belong to a poorly known class of events due to the unknown nature of their progenitors as well as the explosion mechanism. Spectroscopic as well as photometric characteristics of these events are significantly different from the normal and peculiar Type IIP SNe. The number of such underluminous events discovered so far is relatively small. This could plausibly be a selection effect. If we confine the search of core-collapse SNe to a small volume, the majority of SNe discovered in the local universe are of Type IIP (, Smith et al. 2011) and probably a large fraction of them would turn out to be underluminous. Incidentally SN 1999br, SN 2005cs and SN 2009md are the only events of this group to have been discovered soon after the core-collapse and whose data are publicly available.
In this study we have reported the results of an extensive photometric and spectroscopic follow-up campaign for SN 2008in in the ultraviolet, optical and near-infrared domains. The SN was also observed (although not detected) at X-ray and radio wavelengths. The SN was observed soon after its explosion, during the fast rise of the light curve to the optical maximum. Evidence for a shock breakout in SN 2008in was primarily derived through the analysis of the ROTSE-IIIb -band light curve. An upper limit of 16.16 mag in the -band was estimated about two days before the discovery.
Modeling the -band light curve allowed us to estimate a reliable epoch of the shock breakout, with an uncertainty of about two days. The plateau phase in SN 2008in lasts about 98 days which is marginally shorter than in normal Type IIP SNe. The evolution of the bolometric light curve indicate that the event is somewhat in between the normal and faint Type IIP event. The luminosity of the nebular phase light curve indicates an ejected 56Ni mass of , a factor two higher than that derived for low-luminosity IIP SNe. The spectroscopic evolution of SN 2008in is similar to those of low-luminosity IIP SNe (1997D, 1999br and 1999eu), indicated particularly by the strong presence of Ba ii lines, the narrow line widths of H lines, and the expansion velocities of SN during the photospheric phases ( ) and the nebular phases ( 1200 ). The ejecta kinematics of SN 2008in are consistent with less-energetic ( erg) Type IIP SNe.
Spectroscopically SN 2008in appears to be like low-luminosity SNe IIP, but photometrically it appears close to a normal type IIP event.
From the light curve and spectra of SN 2008in , we could determine quite accurate values of the observed properties such as plateau duration, mid-plateau luminosity as well as the photospheric velocity and this has helped us to comment on the properties of the explosion and the progenitor star. Using semi-analytical formulae by Litvinova & Nadezhin (1985), we could estimate approximate values of the explosion energy erg, the ejected mass and the pre-SN radius . The explosion energy of SN 2008in is smaller than the normal ( erg) Type IIP events, although higher than that estimated in underenergetic ( erg) SNe IIP. We could provide an upper limit to the mass loss rate of the progenitor as whereas the upper limit for the main-sequence mass of the progenitor star is estimated as 20 .
References
- Akerlof et al. (2003) Akerlof, C. W., et al. 2003, PASP, 115, 132
- Alard (2000) Alard, C. 2000, A&AS, 144, 363
- Arnett (1996) Arnett, W. D. 1996, Supernovae and nucleosynthesis. an investigation of the history of matter, from the Big Bang to the present, ed. Arnett, D.
- Arnett (1980) Arnett, W. D. 1980, ApJ, 237, 541
- Asplund et al. (2009) Asplund, M., Grevesse, N., Sauval, A. J., & Scott, P. 2009, ARA&A, 47, 481
- Barbon et al. (1990) Barbon, R., Benetti, S., Rosino, L., Cappellaro, E., & Turatto, M. 1990, A&A, 237, 79
- Benetti et al. (2001) Benetti, S., et al. 2001, MNRAS, 322, 361
- Bersten et al. (2011) Bersten, M. C., Benvenuto, O., & Hamuy, M. 2011, ApJ, 729, 61
- Bessell et al. (1998) Bessell, M. S., Castelli, F., & Plez, B. 1998, A&A, 333, 231
- Brown (2009) Brown, P. J. 2009, Ph.D. thesis, The Pennsylvania State University
- Brown et al. (2009) Brown, P. J., et al. 2009, AJ, 137, 4517
- Burrows et al. (2005) Burrows, D. N., et al. 2005, Space Sci. Rev., 120, 165
- Chakraborti et al. (2008) Chakraborti, S., Prabhu, T., Anupama, G. C., Kaur, A., Uday Kumar, G., & Ray, A. 2008, Central Bureau Electronic Telegrams, 1638, 1
- Chevalier (1976) Chevalier, R. A. 1976, ApJ, 207, 872
- Chugai & Utrobin (2000) Chugai, N. N., & Utrobin, V. P. 2000, A&A, 354, 557
- Clocchiatti et al. (1996) Clocchiatti, A., et al. 1996, AJ, 111, 1286
- Cowen et al. (2010) Cowen, D. F., Franckowiak, A., & Kowalski, M. 2010, Astroparticle Physics, 33, 19
- Dessart et al. (2010) Dessart, L., Livne, E., & Waldman, R. 2010, MNRAS, 408, 827
- Dickey & Lockman (1990) Dickey, J. M., & Lockman, F. J. 1990, ARA&A, 28, 215
- Eldridge et al. (2007) Eldridge, J. J., Mattila, S., & Smartt, S. J. 2007, MNRAS, 376, L52
- Eldridge & Tout (2004) Eldridge, J. J., & Tout, C. A. 2004, MNRAS, 353, 87
- Elmhamdi et al. (2003) Elmhamdi, A., Chugai, N. N., & Danziger, I. J. 2003, A&A, 404, 1077
- Elmhamdi et al. (2003) Elmhamdi, A., et al. 2003, MNRAS, 338, 939
- Falk & Arnett (1977) Falk, S. W., & Arnett, W. D. 1977, ApJS, 33, 515
- Foley (2008) Foley, R. J. 2008, Central Bureau Electronic Telegrams, 1638, 2
- Fransson & Chevalier (1987) Fransson, C., & Chevalier, R. A. 1987, ApJL, 322, L15
- Fransson et al. (1996) Fransson, C., Lundqvist, P., & Chevalier, R. A. 1996, ApJ, 461, 993
- Fraser et al. (2010) Fraser, M., et al. 2010, ArXiv e-prints, 1011.6558
- Gezari et al. (2008) Gezari, S., et al. 2008, ApJL, 683, L131
- Grassberg et al. (1971) Grassberg, E. K., Imshennik, V. S., & Nadyozhin, D. K. 1971, Ap&SS, 10, 28
- Hamuy (2003) Hamuy, M. 2003, ApJ, 582, 905
- Hamuy (2005) Hamuy, M. 2005, in IAU Colloq. 192: Cosmic Explosions, On the 10th Anniversary of SN1993J, ed. J.-M. Marcaide & K. W. Weiler, 535
- Hamuy & Pinto (2002) Hamuy, M., & Pinto, P. A. 2002, ApJL, 566, L63
- Hamuy et al. (1994) Hamuy, M., Suntzeff, N. B., Heathcote, S. R., Walker, A. R., Gigoux, P., & Phillips, M. M. 1994, PASP, 106, 566
- Hamuy (2001) Hamuy, M. A. 2001, Ph.D. thesis, The University of Arizona
- Heger et al. (2003) Heger, A., Fryer, C. L., Woosley, S. E., Langer, N., & Hartmann, D. H. 2003, ApJ, 591, 288
- Hendry et al. (2005) Hendry, M. A., et al. 2005, MNRAS, 359, 906
- Immler et al. (2007) Immler, S., et al. 2007, ApJ, 664, 435
- Landolt (2009) Landolt, A. U. 2009, AJ, 137, 4186
- Leonard et al. (2002) Leonard, D. C., et al. 2002, PASP, 114, 35
- Litvinova & Nadezhin (1985) Litvinova, I. Y., & Nadezhin, D. K. 1985, Soviet Astronomy Letters, 11, 145
- Maguire et al. (2010) Maguire, K., et al. 2010, MNRAS, 404, 981
- Maund & Smartt (2005) Maund, J. R., & Smartt, S. J. 2005, MNRAS, 360, 288
- Maund et al. (2005) Maund, J. R., Smartt, S. J., & Danziger, I. J. 2005, MNRAS, 364, L33
- Misra et al. (2007) Misra, K., Pooley, D., Chandra, P., Bhattacharya, D., Ray, A. K., Sagar, R., & Lewin, W. H. G. 2007, MNRAS, 381, 280
- Nadyozhin (2003) Nadyozhin, D. K. 2003, MNRAS, 346, 97
- Nakano et al. (2008) Nakano, S., Kadota, K., & Wells, W. 2008, Central Bureau Electronic Telegrams, 1636, 1
- Olivares E. et al. (2010) Olivares E., F., et al. 2010, ApJ, 715, 833
- Pastorello et al. (2005) Pastorello, A., et al. 2005, MNRAS, 360, 950
- Pastorello et al. (2006) Pastorello, A., et al. 2006, MNRAS, 370, 1752
- Pastorello et al. (2009) Pastorello, A., et al. 2009, MNRAS, 394, 2266
- Pastorello et al. (2004) Pastorello, A., et al. 2004, MNRAS, 347, 74
- Pilyugin et al. (2004) Pilyugin, L. S., Vílchez, J. M., & Contini, T. 2004, A&A, 425, 849
- Poole et al. (2008) Poole, T. S., et al. 2008, MNRAS, 383, 627
- Press et al. (1992) Press, W. H., Teukolsky, S. A., Vetterling, W. T. and Flannery, B. P. 1992, Numerical recipes in C. The art of scientific computing, ed. Press, W. H., Teukolsky, S. A., Vetterling, W. T., & Flannery, B. P.
- Quimby et al. (2007) Quimby, R. M., Wheeler, J. C., Höflich, P., Akerlof, C. W., Brown, P. J., & Rykoff, E. S. 2007, ApJ, 666, 1093
- Richmond et al. (1994) Richmond, M. W., Treffers, R. R., Filippenko, A. V., Paik, Y., Leibundgut, B., Schulman, E., & Cox, C. V. 1994, AJ, 107, 1022
- Roming et al. (2005) Roming, P. W. A., et al. 2005, Space Sci. Rev., 120, 95
- Roy et al. (2011) Roy, R., et al. 2011, MNRAS, 414, 167
- Sahu et al. (2006) Sahu, D. K., Anupama, G. C., Srividya, S., & Muneer, S. 2006, MNRAS, 372, 1315
- Schawinski et al. (2008) Schawinski, K., et al. 2008, Science, 321, 223
- Schlegel et al. (1998) Schlegel, D. J., Finkbeiner, D. P., & Davis, M. 1998, ApJ, 500, 525
- Smartt et al. (2009) Smartt, S. J., Eldridge, J. J., Crockett, R. M., & Maund, J. R. 2009, MNRAS, 395, 1409
- Smith et al. (2011) Smith, N., Li, W., Filippenko, A. V., & Chornock, R. 2011, MNRAS, 412, 1522
- Stetson (1987) Stetson, P. B. 1987, PASP, 99, 191
- Stockdale et al. (2008) Stockdale, C. J., et al. 2008, The Astronomer’s Telegram, 1883, 1
- Stockdale et al. (2009) Stockdale, C. J., et al. 2009, The Astronomer’s Telegram, 1912, 1
- Stritzinger (2008) Stritzinger, M. 2008, Central Bureau Electronic Telegrams, 1638, 3
- Suntzeff & Bouchet (1990) Suntzeff, N. B., & Bouchet, P. 1990, AJ, 99, 650
- Terry et al. (2002) Terry, J. N., Paturel, G., & Ekholm, T. 2002, A&A, 393, 57
- Tominaga et al. (2009) Tominaga, N., Blinnikov, S., Baklanov, P., Morokuma, T., Nomoto, K., & Suzuki, T. 2009, ApJL, 705, L10
- Turatto et al. (2003) Turatto, M., Benetti, S., & Cappellaro, E. 2003, in From Twilight to Highlight: The Physics of Supernovae, ed. W. Hillebrandt & B. Leibundgut, 200
- Turatto et al. (1998) Turatto, M., et al. 1998, ApJL, 498, L129
- Utrobin (2007) Utrobin, V. P. 2007, A&A, 461, 233
- Utrobin & Chugai (2008) Utrobin, V. P., & Chugai, N. N. 2008, A&A, 491, 507
- Utrobin et al. (2010) Utrobin, V. P., Chugai, N. N., & Botticella, M. T. 2010, ApJL, 723, L89
- van Dokkum (2001) van Dokkum, P. G. 2001, PASP, 113, 1420
- Van Dyk et al. (2010) Van Dyk, S. D., et al. 2010, ArXiv e-prints, 1011.5873
- Vinkó et al. (2006) Vinkó, J., et al. 2006, MNRAS, 369, 1780
- Vollmann & Eversberg (2006) Vollmann, K., & Eversberg, T. 2006, Astronomische Nachrichten, 327, 862
- Waxman et al. (2007) Waxman, E., Mészáros, P., & Campana, S. 2007, ApJ, 667, 351
- Weiler et al. (2002) Weiler, K. W., Panagia, N., Montes, M. J., & Sramek, R. A. 2002, ARA&A, 40, 387
- Yuan (2010) Yuan, F. 2010, PhD thesis, University of Michigan, USA
- Zampieri et al. (2003) Zampieri, L., Pastorello, A., Turatto, M., Cappellaro, E., Benetti, S., Altavilla, G., Mazzali, P., & Hamuy, M. 2003, MNRAS, 338, 711
- Zampieri et al. (1998) Zampieri, L., Shapiro, S. L., & Colpi, M. 1998, ApJL, 502, L149
- Zerbi et al. (2004) Zerbi, F. M., et al. 2004, in Presented at the Society of Photo-Optical Instrumentation Engineers (SPIE) Conference, Vol. 5492, Society of Photo-Optical Instrumentation Engineers (SPIE) Conference Series, ed. A. F. M. Moorwood & M. Iye, 1590