The [Fe/H], [C/Fe], and [/Fe] distributions of the Boötes I Dwarf Spheroidal Galaxy66affiliation: Indian Institute of Astrophysics, 2nd block Koramangala, Bangalore 560034, India; sivarani@iiap.res.in
Abstract
We present the results of a low-resolution spectral abundance study of 25 stars in the Boötes I dwarf spheroidal (dSph) galaxy. The data were obtained with the LRIS instrument at Keck Observatory, and allow us to measure [Fe/H], [C/Fe], and [/Fe] for each star. We find both a large spread in metallicity (2.1 dex in [Fe/H]) as well as the low average metallicity in this system, [Fe/H], matching previous estimates. This sample includes a newly discovered extremely metal-poor star, with [Fe/H]=, that is one of the most metal-poor stars yet found in a dSph. We compare the metallicity distribution function of Boötes I to analytic chemical evolution models. While the metallicity distribution function of Boötes I is best fit by an Extra Gas chemical evolution model, leaky-box models also provide reasonable fits. We also find that the [/Fe] distribution and the carbon-enhanced metal-poor fraction of our sample (12%) are reasonable matches to Galactic halo star samples in the same metallicity range, indicating that at these low metallicities, systems like the Boötes I ultra-faint dSph could have been contributors to the Galactic halo.
Subject headings:
galaxies: abundances, galaxies: dwarf, galaxies: individual Boötes I, stars:abundances1. Introduction
In the last few years, numerous ultra-faint dwarf spheroidal (dSph) galaxy companions to the Galaxy have been discovered based on the Sloan Digital Sky Survey imaging (e.g, Willman et al. 2010, and references therein). Recent studies have shown that these galaxies contain stars that are generally very metal poor; the mean [Fe/H] values of the ultra-faint dSphs is consistent with an extension of the luminosity-metallicity relationship found in their more luminous counterparts (e.g, Norris et al. 2010b; Kirby et al. 2011b). Systems such as these may thus have been important contributors to the most metal-poor populations of the Galactic stellar halo.
This paper presents a chemical abundance analysis of stars in the Boötes I dSph galaxy based on low-resolution spectroscopy. Originally discovered by Belokurov et al. (2006), Boötes I has been the subject of a number of previous studies. For example, Muñoz et al. (2006) and Martin et al. (2007) measured , making this one of the most dark-matter-dominated galaxies in the Local Group, a result consistent with the N-body simulations of Fellhauer et al. (2008).
The metallicity of Boötes I has been estimated by several studies as well. Belokurov et al. (2006) noted the similarity of its color-magnitude diagram (CMD) to the fiducial of M92, a globular cluster with [Fe/H]. Using RR Lyrae periods, Siegel (2006) reported a range in [Fe/H] of to . Hughes et al. (2008) used Washington photometry to estimate [Fe/H], while Martin et al. (2007), using the calcium triplet (CaT) method, obtained a mean metallicity of [Fe/H] based on a sample of 30 stars. However, it has been shown that previous calibrations of the CaT estimator are unreliable at lower metallicities (e.g., Battaglia et al. 2008; Kirby et al. 2008). Norris et al. (2008) find a mean [Fe/H] of for a sample of 16 stars, using the Ca II K line-strength index approach.
High-resolution spectroscopic studies of Boötes I members have also been carried out. Norris et al. (2010c) presented a study of a member star with [Fe/H], and Norris et al. (2010b) updated their previous work with high-resolution determinations of [Fe/H] and [C/Fe] for six stars (as well as deriving [C/Fe] from their original moderate-resolution data). Feltzing et al. (2009) presented a high-resolution spectroscopic study for seven Boötes I stars, finding one star with an anomously high [Mg/Ca] ratio as compared with the rest of their sample. This signature is rarely found in metal-poor halo stars (Aoki et al., 2007b; Cohen et al., 2007), However, this may be a more common feature among dSph stars, as evidenced from abundance studies of stars in Hercules (Koch et al., 2008) and Draco (Fulbright et al., 2004).
In this study we present an abundance analysis for 25 stars in the Boötes I system, based on low-resolution spectra obtained with the LRIS multi-object spectrometer on the Keck I telescope. Section 2 summarizes details of these observations and reductions. Section 3 describes an automated analysis approach used to determine estimates of [Fe/H], [/Fe], and [C/Fe] for each star. In Section 4 we combine our results with those of Feltzing et al. (2009) and Norris et al. (2010b), comparing the Boötes I metallicity distribution to both other dSph galaxies and with chemical evolution models, and also the [/Fe], and [C/Fe] distributions to the stellar abundances of Galactic halo stars.
2. Observation and Reduction Details
Our Boötes I targets were selected from the radial velocity study of Martin et al. (2007). The stars with confirmed radial velocity membership in Boötes I were observed using the blue side of the LRIS multi-object spectrometer on the Keck I telescope (Oke et al., 1995; Steidel et al., 2004). For all of our targets we used the 600/4000 Grism, with a slit width of 0.7”, yielding a resolving power of R 1800 at 5100 Å. We were able to observe 4 masks, giving us a total of 25 stars in the Boötes I system. The stars range from near the center to ’ of center, all inside of the Boötes I half-light radius of 13’ (Belokurov et al., 2006). The only criteria used in selecting Boo members was the radial velocity membership from Martin et al. (2007), so our sample should provide an unbiased view of the nature of the stars in this galaxy. We also observed one mask each for the globular clusters M5 and M15, in order to validate our abundance measurements and characterize their uncertainties. There is no widely accepted naming scheme for the stars in Boötes I, so we employ the scheme from Table 1.
Standard IRAF111IRAF is distributed by the National Optical Astronomy Observatories, which are operated by the Association of Universities for Research in Astronomy, Inc., under cooperative agreement with the National Science Foundation. routines were used to remove instrumental signatures from the data, extract spectra from the two-dimensional images, and wavelength calibrate the spectra. Due to flexure in LRIS, we could not obtain reliable independent radial velocity estimates from our measurements.
| Star | R.A. | Decl. | SNR | log | [Fe/H] | [/Fe] | [C/ Fe] | |
|---|---|---|---|---|---|---|---|---|
| ID | (J2000.0) | (J2000.0) | (@5180Å) | (K) | (cgs) | (dex) | (dex) | (dex) |
| Boo01 | 14 00 10.49 | +14 31 45.50 | 130 | 4716 | 1.65 | 2.34 | 0.12 | 0.50 |
| Boo02 | 14 00 12.92 | +14 33 11.80 | 47 | 5114 | 2.00 | 2.37 | 0.28 | 0.36 |
| Boo03 | 14 00 33.08 | +14 29 59.70 | 45 | 5127 | 1.99 | 3.09 | 0.43 | 0.79 |
| Boo04 | 14 00 03.08 | +14 30 23.60 | 25 | 5210 | 2.68 | 2.39 | 0.35 | 0.34 |
| Boo05 | 13 59 44.27 | +14 32 41.20 | 18 | 5077 | 2.55 | 2.89 | 0.05 | 0.00 |
| Boo06 | 13 59 52.33 | +14 32 45.70 | 23 | 5404 | 2.40 | 2.20 | 0.32 | 0.64 |
| Boo07 | 14 00 05.34 | +14 30 23.30 | 38 | 5200 | 2.54 | 2.49 | 0.16 | 0.39 |
| Boo08 | 13 59 44.96 | +14 32 30.10 | 22 | 5178 | 2.30 | 2.48 | 0.18 | 0.32 |
| Boo09 | 14 00 23.38 | +14 32 45.30 | 13 | 5563 | 2.44 | 2.65 | 0.37 | 0.90 |
| Boo10 | 13 59 51.08 | +14 30 49.80 | 11 | 5086 | 2.42 | 2.59 | 0.00 | |
| Boo11 | 13 59 50.76 | +14 31 14.20 | 14 | 5199 | 2.65 | 2.43 | 0.05 | 0.05 |
| Boo12 | 14 00 27.29 | +14 32 19.60 | 44 | 5168 | 2.19 | 2.48 | 0.04 | 0.24 |
| Boo13 | 14 00 22.45 | +14 33 26.90 | 41 | 5631 | 2.35 | 2.49 | 0.23 | 0.00 |
| Boo14 | 13 59 48.34 | +14 32 03.60 | 32 | 5971 | 2.56 | 2.57 | 0.34 | 0.00 |
| Boo15 | 13 59 57.85 | +14 28 02.50 | 23 | 5117 | 2.31 | 2.89 | 0.30 | 0.00 |
| Boo18 | 14 00 03.33 | +14 28 51.50 | 22 | 5287 | 2.27 | 2.51 | 0.13 | 0.44 |
| Boo19 | 14 00 05.61 | +14 26 18.90 | 35 | 5141 | 2.38 | 3.29 | 0.28 | 0.40 |
| Boo20 | 13 59 47.07 | +14 28 52.60 | 12 | 4931 | 2.44 | 2.42 | 0.13 | 0.35 |
| Boo21 | 14 00 09.85 | +14 28 23.00 | 125 | 4775 | 1.48 | 3.79 | 0.27 | 2.20 |
| Boo22 | 13 59 50.63 | +14 29 11.10 | 36 | 4866 | 1.93 | 2.87 | 0.12 | 0.16 |
| Boo23 | 14 00 11.54 | +14 25 56.10 | 20 | 5475 | 2.83 | 2.90 | 0.16 | 1.86 |
| Boo24 | 14 00 25.83 | +14 26 07.60 | 80 | 4798 | 1.63 | 1.65 | 0.46 | 0.80 |
| Boo25 | 14 00 21.84 | +14 25 53.40 | 24 | 5141 | 2.02 | 2.76 | 0.25 | 1.34 |
| Boo28 | 14 00 02.29 | +14 26 53.40 | 20 | 5449 | 3.29 | 2.31 | 0.06 | 0.27 |
| Boo30 | 14 00 23.34 | +14 26 08.00 | 17 | 5449 | 3.29 | 1.86 | 0.51 | 0.38 |
3. Stellar Parameters and Analysis
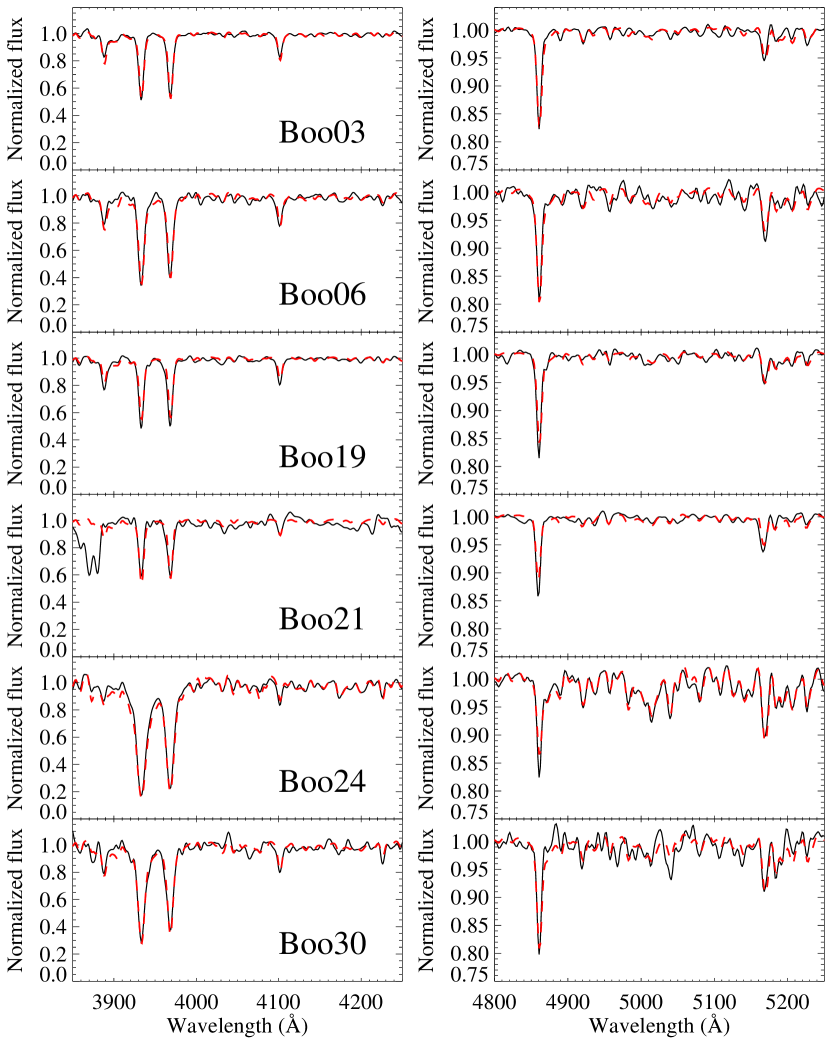
We employed a newly developed version of the SEGUE Stellar Parameter Pipeline (SSPP; Lee et al. 2008a, b; Allende Prieto et al. 2008), called the n-SSPP (indicating its use for non-SEGUE data). This code is suitable for application to spectra other than those taken by the SDSS/SEGUE that are of approximately the same resolution (R), and cover a wavelength range of (ideally) at least 3900 to 5500 Å. In conjuction with the spectra, the n-SSPP also uses colors when available (as is the case with our program stars). Otherwise it makes use of Johnson magnitude and colors, and/or a 2MASS (Skrutskie et al., 2006) magnitude and color, when available, in order to predict magnitudes and colors on the SDSS photometric system. The n-SSPP then determines the primary atmospheric parameters (, log , [Fe/H], and [/Fe]), based on a subset of the procedures described in Lee et al. (2008a) and Lee et al. (2011). Lee et al. (2011) describes the calibration and validation of the techniques used for estimating [/Fe], to which we refer the interested reader. Examples of observed spectra matched to synthetic spectra produced with the n-SSPP derived parameters are shown in Figure 1.
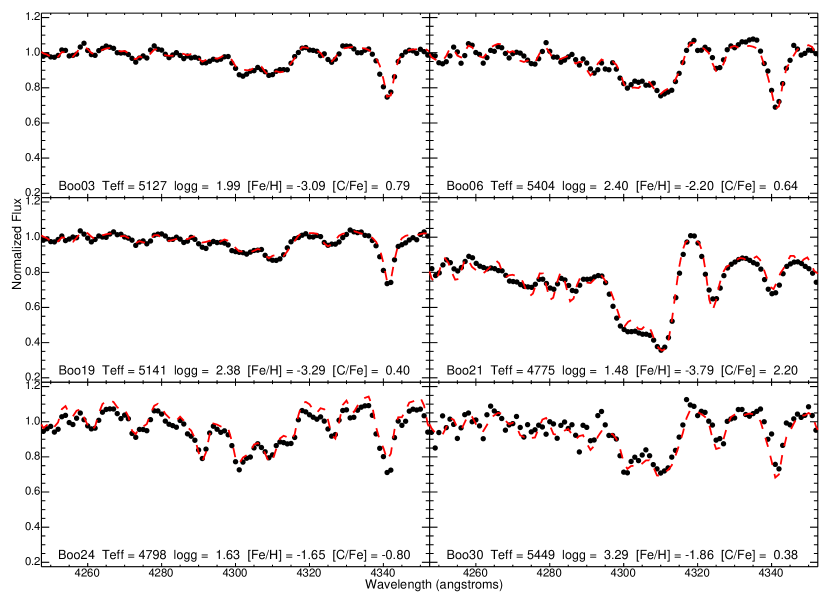
Carbon abundances, with accuracies on the order of 0.3 dex, were estimated from the CH G band at Å by matching the observed spectra near this feature with an extensive grid of synthetic spectra. The determination of carbon abundance can be affected by the oxygen abundance because of molecular equilibrium. Since no independent [O/Fe] can be determined from our spectra, the grid assumes [O/Fe] for metallicities below solar, and [O/Fe] for solar and above. In Figure 2, we show examples of the synthetic fits of the G band region used to determine [C/Fe] ratios. Details of this procedure are described by Beers et al. (2007), as extended by Carollo et al. (2011). The final adopted stellar parameters and abundances are presented in Table 1.
3.1. Comparisons to Previous Results: Verification of the Pipeline and Accuracy Estimates
3.1.1 [Fe/H] comparisons
The SSPP has already been verified to work well with SDSS spectra (Smolinski et al., 2011). However, we also checked the accuracy of the n-SSPP pipeline using our particular setup, with observations of stars in two globular clusters M5 and M15. Table 2 lists the atmospheric parameters and abundances derived using the n-SSPP for stars from the two clusters. Table 1 and 2 also list the final signal-to-noise ratios (SNRs) of the spectra as estimated from the total counts of each extracted spectrum (at 5180Å). While it was not possible to exactly match the SNR range between the cluster data and the Boötes I stars, due to varying observing conditions and magnitude differences, the SNR range is comparable between the cluster spectra and the Boötes I spectra.
| Star | SNR | log | [Fe/H] | [/Fe] | [C/Fe] | log | [Fe/H] | [/Fe] | ||
|---|---|---|---|---|---|---|---|---|---|---|
| ID | (@5180Å) | (K) | (cgs) | (dex) | (dex) | (dex) | lit. | lit. | lit. | lit. |
| M5 I-2 | 30 | 4359 | 2.06 | 1.36 | 0.00 | 4540 | 1.52 | 1.15 | 0.31 | |
| M5 I-4 | 35 | 4638 | 2.22 | 1.19 | 0.33 | 0.27 | ||||
| M5 I-50 | 29 | 4581 | 2.39 | 1.25 | 0.29 | 0.66 | 4590 | 1.55 | 1.18 | 0.28 |
| M5 I-58 | 37 | 4571 | 2.10 | 1.01 | 0.09 | 0.72 | 4400 | 1.60 | 1.10 | 0.28 |
| M5 I-61 | 35 | 4567 | 1.89 | 1.36 | 0.23 | 0.39 | 4425 | 1.27 | 1.17 | 0.28 |
| M5 I-68 | 50 | 4000 | 1.81 | 1.04 | 0.00 | 4066 | 0.63 | 1.17 | 0.29 | |
| M5 I-71 | 41 | 4373 | 2.05 | 1.01 | 0.52 | 4360 | 1.12 | 1.08 | 0.26 | |
| M5 II-50 | 29 | 4980 | 2.23 | 0.88 | 0.06 | 0.15 | 4590 | 1.57 | 1.18 | 0.24 |
| M5 II-59 | 37 | 4541 | 2.06 | 1.27 | 0.11 | 0.71 | 4450 | 1.27 | 1.08 | 0.27 |
| M15 K144 | 138 | 4706 | 1.15 | 2.20 | 0.11 | 0.52 | 4425 | 0.75 | 2.26 | 0.29 |
| M15 K169 | 92 | 4527 | 1.42 | 2.29 | 0.21 | 0.90 | 4400 | 0.65 | 2.37 | 0.32 |
| M15 K255 | 31 | 4571 | 1.43 | 2.38 | 0.19 | 0.74 | 4640 | 1.40 | 2.30 | 0.18 |
| M15 K341 | 37 | 4333 | 1.35 | 2.04 | 0.98 | 4275 | 0.45 | 2.28 | 0.51 | |
| M15 K431 | 45 | 4939 | 1.89 | 2.05 | 0.29 | 0.48 | 4375 | 0.50 | 2.36 | 0.43 |
| M15 K553 | 53 | 4925 | 2.35 | 2.43 | 0.21 | 0.00 | 4855 | 2.00 | 2.30 | 0.27 |
| M15 K64 | 39 | 4764 | 1.77 | 2.67 | 0.30 | 0.00 | 5100 | 2.25 | 2.30 | |
| M15 K875 | 20 | 5268 | 2.28 | 2.09 | 0.05 | 0.00 | 4775 | 1.65 | 2.30 | 0.40 |
Most of the cluster stars were selected because they had previous abundance determinations based on high-resolution spectra. The literature information listed in Table 2 come from the high-spectral resolution studies of Ivans et al. (2001) for M5, and Sneden et al. (2000), or when available, Sneden et al. (1997), for M15 (the [Fe/H] have been adjusted using a solar log(Fe) , to match this study). Using these high-resolution studies as benchmarks the M5 stars have , and the M15 stars have (the notation, here and elsewhere, refers to a straight average unless otherwise noted). For our purposes, we assume that these values are the true metallicities for each cluster, and that the true intrinsic spread of metallicities is no greater than the standard deviation from the high-resolution determinations. The respective values derived from the LRIS observations are for M5 and for M15. We take the much larger s as an indication of the error in the [Fe/H] measurements from this study.
We have two Boötes I stars in our sample which were previous analyzed in the study of Norris et al. (2010b). One of these was also part of the study of Feltzing et al. (2009). The [Fe/H] abundances in these two studies are derived from analysis of high-resolution spectra. The stars in common are Boo01 (Boo-117 in Norris et al. 2010b and Feltzing et al. 2009) and Boo24 (Boo-041 in Norris et al. 2010b). For Boo01, we find [Fe/H], in very good agreement with the values of [Fe/H] and [Fe/H] reported by Feltzing et al. (2009) and Norris et al. (2010b), respectively. We find Boo24 to have [Fe/H], also in reasonable agreement with the [Fe/H] value reported by Norris et al. (2010b) given the cluster comparison s.

The difference between this study’s [Fe/H] determinations and the previous literature determinations ([Fe/H]) for the M5, M15 and Boötes I stars is summarized in the top panels of Figure 3. Overall, there is only a very small ( dex) offset, in the sense of this study minus literature values. Figure 3 plots this difference as a function of (in the sense of our values minus literature values), , and [Fe/H]. The clear correlation with [Fe/H] with show that some of the differences in [Fe/H] may be related to the adopted values of this study. However, there is a spread in [Fe/H] even when the values are in agreement. There is also no significant correlation with either or [Fe/H] of a star, indicating that we are free from systematic offsets, at least over the range defined by the comparison-star parameters. Therefore, we estimate the final random individual [Fe/H] errors as the standard deviation of [Fe/H] for the entire comparison sample, . This agrees well with the individual s found for the M5 and M15 stars.
3.2. [/Fe] comparisons
Figure 3 also compares the difference between determinations of [/Fe] from this study with previous literature estimates ([/Fe]). This is not an exact comparison, as the previous literature studies measure different individual -elements, including Mg, Si, Ca, and Ti. To calculate the average literature [/Fe] values, we simply averaged whichever of the -elements listed above were available in each star’s respective high-resolution study. While not a perfect comparison, this gives a good handle on our errors and any possible offsets in interpreting the Boötes I sample.
The ([/Fe]) from the comparisons is 0.10 dex. We take this value as the estimate on the random error of the [/Fe] determinations. However, note that this study’s [/Fe] values are offset by an average of dex from literature measurements. A very similar offset was found when comparing high-resolution M15 abundances from the same sources as used here to SDSS-derived values by Lee et al. (2011), who pointed out that some of the offset could be due to the observational errors on [Si/Fe] and [Ti/Fe] reported in Sneden et al. (1997). However, because we calculate the average offset including the M5 and Boötes I high-resolution determinations, we caution that this average offset in [/Fe] is a potential systematic error in our analysis.
3.3. [C/Fe] comparisons
There are no independent measurements of [C/Fe] from high-spectral-resolution studies for any one of our individual cluster stars. However, we can compare the we derive from this study to the high spectral-resolution study of Lai et al. (2011) for 17 stars in M5. In this study, we find and , as compared to and found by Lai et al. A caution is that [C/Fe] can vary greatly in individual globular cluster stars, so not being able to compare star-to-star values of [C/Fe] has its limitations. However, we can also directly compare the [C/Fe] derived in the overlapping Boötes I stars with the values found by Norris et al. (2010b). For Boo01 and Boo24, Norris et al. (2010b) derive [C/Fe] values of and , respectively. These compare reasonably well with this study’s values of and for the same stars.
Carollo et al. (2011) have compared determinations of [C/Fe] employing the same techniques for carbon abudundance estimates as the present study, but for a sample of very low-metallicity halo stars from SDSS with high-resolution spectroscopic determinations reported by W. Aoki et al., in preparation (covering the same metallicity range as the Boötes I sample). They find a very small offset (+0.03 dex) and rms scatter of 0.3 dex from this exercise.
In summary, we find good agreement between our [Fe/H] values and those derived by previous high-resolution studies. A reasonable estimate of our individual errors comes from and ([/Fe]) dex. We caution that a systematic offset on the order dex for [/Fe] may also be present. It is more difficult to quantify the individual errors in [C/Fe], however the general agreement of our values with previous studies provides confidence in the values derived here.
4. Results
Table 1 presents the [Fe/H], [/Fe], and [C/Fe] abundance results for the Boötes I sample. Overall we find an average [Fe/H], and dex. To take into account the estimated errors on [Fe/H] and calculate an intrinsic spread of [Fe/H] we use Equation 8 from Kirby et al. (2011b). The intrinsic spread we find in our sample is . Figure 4(a) shows the metallicity distribution function (MDF) of our Boötes I sample. It is apparent that the Boötes I MDF has a wide range of metallicities (2.1 dex in [Fe/H]), but is sharply peaked at the average metallicity of [Fe/H]. Also plotted in Figure 4(a) are our measurements of the MDF in our M5 and M15 sample. The spread at their respective metallicities is an indication of the error on [Fe/H] from this study.

One star in our sample, Boo21, stands out as exceptionally metal poor, [Fe/H]. This is one of the more Fe-poor stars known in any dSph galaxy, matching the [Fe/H] star found in the Sculptor dSph (Frebel et al., 2010a). This is also the second extremely Fe-poor star known in Boötes I. A [Fe/H] star was discovered by Norris et al. (2008) and subsequently verified by Norris et al. (2010c). Given the rather low number of stars with [Fe/H] presently known in the Galactic halo, these results suggest that the ultra-faint dSph like systems were an important source of stars in this low range of metallicity.
4.1. The Boötes I metallicity distribution
The detailed properties of the Boötes I metallicity distribution are important constraints for its past evolution. For example, where the of Boötes I falls on the metallacity-luminosity relationship can be indicitave of whether dwarf galaxies follow evolutionary trends of their more luminous counterparts, or are actually stripped versions of these luminous counterparts. Additionaly, measuring its intrinsic metallicity spread can inform the nature of its chemical enrichment and duration of star formation.
Finally the actual shape of the MDF can be also be used to more carefully constrain its chemical evolution history. For example, effective yield could decrease with decreasing stellar mass because fo the increasing importance of outflows and supernova feedback. However, Prantzos (2008) assumes that the effective yield in lower mass systems (i.e. accreted satellites that formed the halo) should have even lower values than what would be predicted from more massive systems because of the lack of Type Ia contributions in these systems. Boötes I is a low stellar mass system which shows no sign of Type Ia contribution with its constant [/Fe] (see Section 4.2), indicating that its star formation history is truncated enough to test this idea.
4.1.1 Average and Intrinsic Spread in Metallicity
To get a more detailed understanding of these properties, we expand the our Boötes I [Fe/H] sample to include the non-overlapping stars from Norris et al. (2010b) (with [Fe/H] taken from Feltzing et al. (2009) if a high-resolution derivation was not available), and compare to the dSph findings of Kirby et al. (2011b). In the case of here, we employ a weighted average using the inverse square of the errors because of the different methods used to determine metallicity. For simplicity, we assume [Fe/H] errors of 0.1, 0.2, and 0.3 dex, for high-resolution determinations, our present determinations, and the Ca II K determinations, respectively.
For this expanded sample of 41 stars we find and intrinsic spread of . The value is very close to the Norris et al. (2010b) result, and as such seems to extends the metallicity-luminosity relationship in this regime. In the sense that Boötes I is representative of a normal galaxy, one natural explanation for this low metallicity is that the effective yield decreases with decreasing stellar mass, reflecting the increasing importance of outflows from supernova feedback in lower mass galaxies (e.g., Tremonti et al. 2004; Prantzos 2008).
In more detail, we can compare with the relationships derived for dSphs by Kirby et al. (2011b) (their Equation 10) and for Local Group dwarf galaxies by Woo et al. (2008) (as recast by Kirby et al. 2011b in their Equation 12). Using the Boötes I luminosity derived by Martin et al. (2008), the metallicities predicted by these relationships are [Fe/H] and [Fe/H] for the Woo et al. (2008) and Kirby et al. (2011b) samples, respectively. Interestingly, our is closer to the relationship derived from the Woo et al. (2008) sample that uses no ultra-faint dSphs.
The intrinic spread of metallicity of our expanded sample is also very similar to the value found by Norris et al. (2010b) for their Boötes I stars. The intrinsic spread is in the lower end of the ultra-faint dSph distribution (Norris et al., 2010b; Kirby et al., 2011b). By itself, this may indicate a less stochastic chemical enrichment history, more in line with the classic dSphs than the ultra-faint dSphs. An alternative way to understanding the intrinsic spread in metallicity can be had by converting [Fe/H] to Z, and comparing intrinsic log values (Kirby et al., 2011b). Using this metric, we find log. This is much lower than the log that would be predicted from the relationship with luminosity that Kirby et al. (2011b) derives from other dSphs. This could be from having a relatively short star formation duration caused by an inability to retain gas, even when compared to other ultra-faint dSphs.
4.1.2 The Boötes I MDF
To get a more detailed understanding of the Boötes I star formation history, we fit the combined MDF from the expanded sample using the simple analytic chemical evolution models and maximum likelihood fitting technique as described in Kirby et al. (2009, 2011b) (shown in Figure 5). The models include two leaky-box models, one of which is assumed to start with metal-free gas (the Pristine Model) and one with pre-enriched initial gas (the Pre-Enriched Model). We also fit their Extra Gas Model, which assumes that some new form of gas becomes available for star formation through either infall or an extra internal source of cooling gas, as adopted from Lynden-Bell (1975).
In all three models the effective nucleosynthetic yield, , is a free parameter. This parameter encompasses both metals produced by supernova that are released back into the ISM as well as gas loss from the system. The Pre-Enriched Model also has an extra free parameter, the initial metallicity of the gas, designated by [Fe/H]o. For simplicity the Extra Gas Model assumes that the additional gas has zero metallicity. The amount of extra gas, (where represents no extra gas and therefore reduces to the Pristine Model), is the extra free parameter.
The results of performing the maximum likelihood fit to each model are shown as the curves in Figure 5. The best Pre-Enriched model has a [Fe/H]. The best Extra Gas model has ; i.e., 84% of the stars formed from an extra reservoir of metal-free gas. These final models can be compared by the logarithm of the ratio of the maximum likelihoods (Kirby et al., 2011b). Using this description, the fits give and . So while the Extra Gas and Pre-Enriched models both fit the distribution better than the Pristine model, all three actually fit the MDF reasonably well.
The very low [Fe/H] for the Pre-Enriched model shows that assuming pristine gas for the simple model is an excellent assumption in the case of Boötes I, and there is very little difference in the model fits as a result. This is in contrast to the dSphs studied by Kirby et al. (2011b), with only Sculptor coming close to this low of a [Fe/H]o. Qualitatively, the Pristine and Pre-Enriched model are very similar, while the Extra Gas model does the best at fitting the peak of the MDF. The Extra Gas model improves the fit to the peak of the MDF by mainataining a low metallicity for period of time in the galaxy thanks to the infall of pristine gas. However, it does a poorer job of fitting the low-metallicity tail.
Not suprisingly, given the similarity of the fits, the effective yields are also similar. The values for the Pristine Model, the Pre-Enriched Model, and the Extra Gas Model are 0.0040, 0.0035, and 0.0033, respectively. These low and roughly comparable values in are in agreement with the idea that the effective yield decreases with mass of the galaxy, through a mechanism such as supernova feedback having a greater affect on the gas of the gas due to heating or mass loss. In particular, the value in Boötes I continues the monotonic decrease with decreasing luminosity as found in classic dSphs studied by Kirby et al. (2011b). However, comparing the predicted value from the relationship assumed by Prantzos (2008) by their Equation 4, our most likely values are a factor of two higher (assuming the stellar mass measured by Martin et al. 2008). At least for the case of Boötes I, the effective yield is actually better represented by the relationship defined by more massive local group galaxies (Dekel & Woo, 2003).
4.2. The distribution
Figure 4(b) shows a very similar distribution of [/Fe] for the Boötes I stars as for the cluster stars. As this is a relative comparison, this takes into account systematic and random errors. The average and standard deviation for all of the Boötes I stars are [/Fe] and dex. For M5 these measurements are [/Fe] and dex, and for M15, [/Fe] and dex. Given the error in measuring [/Fe], the Boötes I distribution is consistent with the measured cluster distributions. In particular, because both M5 and M15 show no signs of [/Fe] variations in high-resolution studies, our Boötes I sample is consistent with showing no spread in [/Fe].
Since it is well known that the globular cluster and halo [Fe/H] distributions are very similar, we conclude that, on average, the Boötes I stars are also a good match to the halo [/Fe]. We find a flat distribution of [/Fe] in the metallicity range of our Boötes I stars, which is typically attributed to having mainly contributions from Type II SN, and none to very little from Type Ia events. This flat trend is in contrast to the nearly constant decline of [/Fe] found in classic dSphs by Kirby et al. (2011a). However, as they note, their data are sparse for [Fe/H], where most of the Boötes I stars lie.
We interpret this flat trend in a similar manner to halo metal-poor stars, an indication that Type Ia SN have had little to no contribution to the Boötes I chemical composition. If we assume we have a systematic offset in our [/Fe] measurements (section 3.1), we estimate that the true value for [/Fe] in Boötes I is 0.36.
4.3. [C/Fe] in Boötes I
Figure 4(c) shows the distribution of [C/Fe] for our sample. While the cluster stars show a clear subsolar average in [C/Fe], the Boötes I sample has a much larger spread, which includes many carbon-enhanced metal-poor (CEMP) stars. This is typically defined by stars with [Fe/H] and [C/Fe]. Using this traditional definition (but relaxing the [Fe/H] constraint to include the two stars with slightly higher metallicities in this particular Boötes I data set), the CEMP fraction of this sample is 12% 7%. Even with the relatively large error due to small numbers, this is in line with estimates of the halo fraction of CEMP stars that range from 9 to 25 % (see, e.g. Cohen et al. 2005; Lucatello et al. 2006; Lai et al. 2007). One of these CEMP stars includes the most Fe-poor star of our sample, Boo21, which has [C/Fe]. The metallicity and carbon enhancment for this star matches the measurements of another dSph star found by Norris et al. (2010a) in the Segue 1 dSph system. However, the resolution of the spectrum is too low to determine if it is a CEMP-no star (carbon-rich, metal-poor, and not enhanced in neutron-capture elements) like the Segue 1 star.
Our carbon-enhanced star fractions are in contrast with the sample of Norris et al. (2010b), where no CEMP stars were discovered in Boötes I. Including these stars in the calculation, the CEMP fraction drops to 8% 4%. However, even this lower figure is still consistent with at least the lower bound of the estimates CEMP fractions measured in the halo.
Alternative definitions for CEMP stars has been proposed by Aoki et al. (2007a) and by Norris et al. (2010b). The Aoki et al. (2007a) definition is dependent on luminosity and takes into account an expected reduction of [C/Fe] due to mixing events as a star evolves up the red giant branch. Norris et al. (2010b) suggests a definition of carbon richness that is dependent on [Fe/H], utilizing the same set of data presented in Aoki et al. (2007a).


Both of these situations are plotted in Figure 6. In the luminosity dependent case, the CEMP fraction increases to 20% 9% and 12% 5%, for this study’s data and for this study’s combined with the Norris et al. (2010b) study’s results, respectively. For the [Fe/H] dependent definition, the percentages remain the same with respect to the traditional CEMP definition. So regardless of the definition adopted, the CEMP fraction of Boötes I appears consistent with the halo fraction.
5. Discussion
Boötes I is a very metal poor system; the average found here agrees with previous studies of this system. We have discovered a star with [Fe/H], which is essentially identical to lowest discovered in any dSph system, either classic or ultra-faint, and is the second such star discovered in Boötes I. There is a large total range in [Fe/H] of 2.1 dex. This is larger than the range found by Norris et al. (2010b), 1.7 dex, but the two values are consistent within errors. In particular, the intrinsic spread in metallicity , is almost identical to the value measured by Norris et al. (2010b).
Combining the MDF from this study with previously measured values and comparing them to simple analytic chemical evolution models indicates that the stellar content of Boötes I may be dominated by stars formed from a fresh supply of gas distinct from the initial star forming gas (either externally through infall/accretion or an internal gas that cools between episodes of star formation). However, leaky-box models assuming initially zero-metallicity and pre-enriched gas also fit the MDF comparably well. Consistently from all three models, we find Boötes I has an effective yield that follows the monotonically decreasing trend of effective yield with lumonisity as found in the classic dSphs measured by Kirby et al. (2011b). The actual value, , is about a factor of two higher than the trend assumed by Prantzos (2008) when working with assumption of no Type Ia SN contributions.
Overall, the bulk metallicity properties (, , and ) of Boötes I point to a system that falls in more in line with trends from more luminous counterparts (Woo et al., 2008; Kirby et al., 2011b). However, given the general spread found in these quantities found for other ultra-fain dSph galaxies, Boötes I is not so much of an outlier, but is likely more of an indication that even at these low luminosities there can be appreciable variations in chemical evolution histories.
We also find that, on average, our [/Fe] matches the halo pattern at the same metallicites, showing no signs of Type Ia SN contributions. The CEMP fraction we calculate, 12 % for just this sample and 8 % including the Norris et al. (2010b) results, also matches the halo CEMP fraction. These combined results place Boötes I in a very interesting position. On average the abundance patterns we find are good matches to those seen in metal-poor halo stars in the same low metallicity regime of Boötes I ([Fe/H] and lower). However, Feltzing et al. (2009) finds variations in [Mg/Ca] in Boötes I, which match similar findings in other dSphs Hercules (Koch et al., 2008) and Draco (Fulbright et al., 2004) for stars that are in the same low metallicity range as defined by Boötes I stars. Given the rarity of finding this type of abundance signature in the halo, this might indicate a disimilarity of populations between low metallicity stars in the halo and dSphs.
Furthermore, careful comparison of the MDF of the Sculptor dSph by Kirby et al. (2009) with the metal-poor tail of the halo field from Schörck et al. (2009) also demonstrates another possible disconnect between metal-poor dSph populations and the halo field; too many extremely metal-poor (EMP; [Fe/H] stars), relative to the halo, being found in Sculptor. On the other hand, this study finds a CEMP fraction similar to that found in the halo field. Also, others have found that abundance patterns for some stars in both the ultra-faint and classic dSph systems match the detailed abundance patterns of halo EMP stars (Frebel et al., 2010b, a; Norris et al., 2010a).
As has been previously pointed out (e.g., Kirby et al. 2009), some of these disimilarities should actually be expected from formation models (e.g, Robertson et al. 2005; Font et al. 2006), where only a few dwarf systems more massive than current day dSph systems formed the majority of the halo population. This is further supported by the differing -element abundance patterns found in dSph stars with metallicitities higher than those found in Boötes I (see Geisler et al. 2007 and references therein).
However, this is true for the inner-halo population. Farther out into the halo, there is evidence for a dichotomy in the populations (Carollo et al., 2007, 2010). This may be because the history of the outer halo region is more dominated by recent accretion and smaller mass systems (Bullock & Johnston, 2005). In this same regard, Carollo et al. (2011) have recently shown that the fraction of CEMP stars at a given (low) metallicity that can be kinematically associated with the outer-halo population is roughly twice that of the frequency associated with the inner-halo population, and took this as strong evidence for multiple additional sources of carbon production beyond the canonical AGB-star mechanism that may dominate in the inner halo.
Considering that most halo stars that have been studied are members of the inner-halo population, the diversity of abundance signatures found in dSph systems compared to what has been found so far in halo stars is not surprising. The similarities in both average properties as found here for Boötes I, and in detailed chemical abundance patterns found in individual dSph stars with halo stars, do seem to indicate some commonality in chemical evolution in dSphs with Galactic halo progenitors. However, at least in the inner-halo population, the more unique chemical signatures found in some individual dSph stars may be washed out by stars contributed from the larger progenitor systems predicted by Robertson et al. (2005) and Font et al. (2006).
Given all of the above, the growing body of abundance results for both classic and ultra-faint dSph systems such as Boötes I points to the outer-halo population of the Galaxy as being a promising hunting ground for validation of the hierarchical formation scenario as described in Bullock & Johnston (2005). There is already evidence of a more diverse outer halo, in both chemically unique individual stars (Lai et al., 2009) and in chemical diversity as a whole (Roederer, 2009). Further tests of this picture will require measuring abundances for both a significantly larger number of dSph stars and for additional in situ studies of the outer halo.
References
- Allende Prieto et al. (2008) Allende Prieto, C., et al. 2008, AJ, 136, 2070
- Aoki et al. (2007a) Aoki, W., Beers, T. C., Christlieb, N., Norris, J. E., Ryan, S. G., & Tsangarides, S. 2007a, ApJ, 655, 492
- Aoki et al. (2007b) Aoki, W., et al. 2007b, ApJ, 660, 747
- Battaglia et al. (2008) Battaglia, G., Irwin, M., Tolstoy, E., Hill, V., Helmi, A., Letarte, B., & Jablonka, P. 2008, MNRAS, 383, 183
- Beers et al. (2007) Beers, T. C., Sivarani, T., Marsteller, B., Lee, Y., Rossi, S., & Plez, B. 2007, AJ, 133, 1193
- Belokurov et al. (2006) Belokurov, V., et al. 2006, ApJ, 647, L111
- Bullock & Johnston (2005) Bullock, J. S., & Johnston, K. V. 2005, ApJ, 635, 931
- Carollo et al. (2011) Carollo, D., Beers, T. C., Bovy, J., Sivarani, T., Norris, J. E., Freeman, K. C., Aoki, W., & Lee, Y. S. 2011, ArXiv e-prints, 1103.3067
- Carollo et al. (2010) Carollo, D., et al. 2010, ApJ, 712, 692
- Carollo et al. (2007) —. 2007, Nature, 450, 1020
- Cohen et al. (2007) Cohen, J. G., McWilliam, A., Christlieb, N., Shectman, S., Thompson, I., Melendez, J., Wisotzki, L., & Reimers, D. 2007, ApJ, 659, L161
- Cohen et al. (2005) Cohen, J. G., et al. 2005, ApJ, 633, L109
- Dekel & Woo (2003) Dekel, A., & Woo, J. 2003, MNRAS, 344, 1131
- Fellhauer et al. (2008) Fellhauer, M., Wilkinson, M. I., Evans, N. W., Belokurov, V., Irwin, M. J., Gilmore, G., Zucker, D. B., & Kleyna, J. T. 2008, MNRAS, 385, 1095
- Feltzing et al. (2009) Feltzing, S., Eriksson, K., Kleyna, J., & Wilkinson, M. I. 2009, A&A, 508, L1
- Font et al. (2006) Font, A. S., Johnston, K. V., Bullock, J. S., & Robertson, B. E. 2006, ApJ, 646, 886
- Frebel et al. (2010a) Frebel, A., Kirby, E. N., & Simon, J. D. 2010a, Nature, 464, 72
- Frebel et al. (2010b) Frebel, A., Simon, J. D., Geha, M., & Willman, B. 2010b, ApJ, 708, 560
- Fulbright et al. (2004) Fulbright, J. P., Rich, R. M., & Castro, S. 2004, ApJ, 612, 447
- Geisler et al. (2007) Geisler, D., Wallerstein, G., Smith, V. V., & Casetti-Dinescu, D. I. 2007, PASP, 119, 939
- Hughes et al. (2008) Hughes, J., Wallerstein, G., & Bossi, A. 2008, AJ, 136, 2321
- Ivans et al. (2001) Ivans, I. I., Kraft, R. P., Sneden, C., Smith, G. H., Rich, R. M., & Shetrone, M. 2001, AJ, 122, 1438
- Kirby et al. (2011a) Kirby, E. N., Cohen, J. G., Smith, G. H., Majewski, S. R., Sohn, S. T., & Guhathakurta, P. 2011a, ApJ, 727, 79
- Kirby et al. (2009) Kirby, E. N., Guhathakurta, P., Bolte, M., Sneden, C., & Geha, M. C. 2009, ApJ, 705, 328
- Kirby et al. (2008) Kirby, E. N., Guhathakurta, P., & Sneden, C. 2008, ApJ, 682, 1217
- Kirby et al. (2011b) Kirby, E. N., Lanfranchi, G. A., Simon, J. D., Cohen, J. G., & Guhathakurta, P. 2011b, ApJ, 727, 78
- Koch et al. (2008) Koch, A., McWilliam, A., Grebel, E. K., Zucker, D. B., & Belokurov, V. 2008, ApJ, 688, L13
- Lai et al. (2007) Lai, D. K., Johnson, J. A., Bolte, M., & Lucatello, S. 2007, ApJ, 667, 1185
- Lai et al. (2009) Lai, D. K., Rockosi, C. M., Bolte, M., Johnson, J. A., Beers, T. C., Lee, Y. S., Allende Prieto, C., & Yanny, B. 2009, ApJ, 697, L63
- Lai et al. (2011) Lai, D. K., Smith, G. H., Bolte, M., Johnson, J. A., Lucatello, S., Kraft, R. P., & Sneden, C. 2011, AJ, 141, 62
- Lee et al. (2011) Lee, Y. S., et al. 2011, AJ, 141, 90
- Lee et al. (2008a) —. 2008a, AJ, 136, 2022
- Lee et al. (2008b) —. 2008b, AJ, 136, 2050
- Lucatello et al. (2006) Lucatello, S., Beers, T. C., Christlieb, N., Barklem, P. S., Rossi, S., Marsteller, B., Sivarani, T., & Lee, Y. S. 2006, ApJ, 652, L37
- Lynden-Bell (1975) Lynden-Bell, D. 1975, Vistas in Astronomy, 19, 299
- Martin et al. (2008) Martin, N. F., de Jong, J. T. A., & Rix, H. 2008, ApJ, 684, 1075
- Martin et al. (2007) Martin, N. F., Ibata, R. A., Chapman, S. C., Irwin, M., & Lewis, G. F. 2007, MNRAS, 380, 281
- Muñoz et al. (2006) Muñoz, R. R., Carlin, J. L., Frinchaboy, P. M., Nidever, D. L., Majewski, S. R., & Patterson, R. J. 2006, ApJ, 650, L51
- Norris et al. (2008) Norris, J. E., Gilmore, G., Wyse, R. F. G., Wilkinson, M. I., Belokurov, V., Evans, N. W., & Zucker, D. B. 2008, ApJ, 689, L113
- Norris et al. (2010a) Norris, J. E., Gilmore, G., Wyse, R. F. G., Yong, D., & Frebel, A. 2010a, ApJ, 722, L104
- Norris et al. (2010b) Norris, J. E., Wyse, R. F. G., Gilmore, G., Yong, D., Frebel, A., Wilkinson, M. I., Belokurov, V., & Zucker, D. B. 2010b, ApJ, 723, 1632
- Norris et al. (2010c) Norris, J. E., Yong, D., Gilmore, G., & Wyse, R. F. G. 2010c, ApJ, 711, 350
- Oke et al. (1995) Oke, J. B., et al. 1995, PASP, 107, 375
- Prantzos (2008) Prantzos, N. 2008, A&A, 489, 525
- Robertson et al. (2005) Robertson, B., Bullock, J. S., Font, A. S., Johnston, K. V., & Hernquist, L. 2005, ApJ, 632, 872
- Roederer (2009) Roederer, I. U. 2009, AJ, 137, 272
- Schörck et al. (2009) Schörck, T., et al. 2009, A&A, 507, 817
- Siegel (2006) Siegel, M. H. 2006, ApJ, 649, L83
- Skrutskie et al. (2006) Skrutskie, M. F., et al. 2006, AJ, 131, 1163
- Smolinski et al. (2011) Smolinski, J. P., et al. 2011, AJ, 141, 89
- Sneden et al. (1997) Sneden, C., Kraft, R. P., Shetrone, M. D., Smith, G. H., Langer, G. E., & Prosser, C. F. 1997, AJ, 114, 1964
- Sneden et al. (2000) Sneden, C., Pilachowski, C. A., & Kraft, R. P. 2000, AJ, 120, 1351
- Steidel et al. (2004) Steidel, C. C., Shapley, A. E., Pettini, M., Adelberger, K. L., Erb, D. K., Reddy, N. A., & Hunt, M. P. 2004, ApJ, 604, 534
- Tremonti et al. (2004) Tremonti, C. A., et al. 2004, ApJ, 613, 898
- Willman et al. (2010) Willman, B., Geha, M., Strader, J., Strigari, L. E., Simon, J. D., Kirby, E., & Warres, A. 2010, ArXiv e-prints, 1007.3499
- Woo et al. (2008) Woo, J., Courteau, S., & Dekel, A. 2008, MNRAS, 390, 1453