Electron doped Ca10(Pt3As8)(Fe2As2)5 and Ca10(Pt4As8)(Fe2As2)5 - High superconductors with skutterudite intermediary layers
Abstract
It has been argued that the very high transition temperatures of the highest cuprate superconductors are facilitated by enhanced CuO2 plane coupling through the (Bi,Tl,Hg)-O intermediary layers. Whether enhanced coupling through intermediary layers can also influence in the iron arsenide superconductors has never been tested due the lack of appropriate systems for study. Here we report the crystal structures and properties of two iron arsenide superconductors, Ca10(Pt3As8)(Fe2As2)5 (the “10-3-8 phase”) and Ca10(Pt4As8)(Fe2As2)5 (the “10-4-8 phase”). Based on -Ca-(PtnAs8)-Ca-Fe2As2- layer stacking, the most important difference in the structures lies in the structural and electronic characters of the intermediary platinum arsenide layers. Electron doping through partial substitution of Pt for Fe in the Fe2As2 layers leads to of 11 K in the 10-3-8 phase and 25 K in the 10-4-8 phase. Using the chemical concepts of Zintl ion electron counting and the stability of Pt in the 5 configuration we argue that the dramatic difference in arises because the intermediary layer is semiconducting in the 10-3-8 phase but metallic in the 10-4-8 phase, leading to enhanced interlayer coupling in the 10-4-8 phase. The results suggest that metallic intermediary layers may offer a new road to higher in iron arsenide superconductors.
I Introduction
Since the report of superconductivity near 26 K in LaFeAsO0.9F0.1 in early 2008 jacs , several new families of high pnictide superconductors have been discovered rotter ; 111 ; 42622b . All of these materials are based on layers of edge-sharing FeAs4 and FeSe4 tetrahedra fese . The intermediary layers range from simple alkali or alkaline earth ions 111 ; rotter to more complex but still chemically trivial perovskite layers such as Sr4V2O6 42622b . Recently, Kudo et al., reported new superconductors with -Ca-(Fe, Pt, As)-Ca-(Fe2As2)- stacking in the Ca-Fe-Pt-As system conference . The crystal structures and the character of the intermediary layers were not defined. This report is intriguing because Fe 122 arsenides, such as BaFe2As2rotter , form in the ThCr2Si2 structure type while Pt 122 arsenides, such as SrPt2As2 pt122 , form in the CaBe2Ge2 structure type, reflecting a fundamental incompatibility between FeAs and PtAs layers. Here we identify and characterize the crystal structures and physical properties of two superconductors in the Ca-Pt-Fe-As system. These materials raise the chemical complexity of the superconducting pnictides to a new level. The first, Ca10(Pt3As8)(Fe2As2)5 (10-3-8), has triclinic symmetry, which is extremely rare among superconductors. The second, Ca10(Pt4As8)(Fe2As2)5 (10-4-8), is a higher symmetry tetragonal phase. These two superconductors have novel structure types with platinum arsenide intermediary layers based on the skutterudite structure, with formulas Pt3As8 and Pt4As8 respectively. As-As dimers are present in these layers and are critical to understanding the electronic state of the superconductors.
For the triclinic 10-3-8 phase, we find that can be tuned from 0 to 11 K through 6% to 13% of Pt substitution on the Fe site in the (Fe2As2)5 layers, which dopes the layers with electrons. For the tetragonal 10-4-8 phase, 13% Pt on the Fe sites stabilizes superconductivity at a much higher temperature, 25 K. Although the ground states of the undoped 10-3-8 and 10-4-8 phases remain unclear, our Pt doping study on the 10-3-8 phase provides evidence for similarities between this new superconducting family and the 122 as well as 1111 families of arsenide superconductors. The Zintl concept and the stability of Pt allow us to conclude that the former phase, with a lower superconducting , has a semiconducting intermediary layer, while the latter, with a 2–3 times higher , has a metallic intermediary layer. The difference in metallicity of the intermediary layers in two arsenide superconductors that are otherwise very similar suggests that this is the factor that determines the difference in their . Bearing in mind that doping the FeAs layers in Fe pnictide superconductors leads to lower than doping the intermediary layers, it may be that can be pushed even higher in these systems through doping on the Ca or PtnAs4 (n=3, 4) layers exclusively.
II Methods
To prepare the crystals, CaAs, FeAs, Fe, Pt and As were mixed in an argon-filled glovebox, pressed into pellets, and put into alumina crucibles. The crucibles were then sealed in quartz tubes under 1/3 atmosphere of Ar. For heating temperatures between 700 ∘C and 950 ∘C, a polycrystalline mixture of one or both superconducting phases together with a considerable amount of PtAs2 was obtained. For heating temperatures above 1100 ∘C, single crystalline 10-3-8 or 10-4-8 phases intergrown with PtAs2 were obtained. For the 10-3-8 phase, mm-sized single crystals with no intergrown impurities could be obtained when excess CaAs was added to the mixture, with the Pt doping concentration manipulated by tuning the Fe to Pt ratio; starting material ratios are summarized in Table I. The crystal growth tubes were heated to 1100 ∘C - 1180 ∘C, held for one week, furnace-cooled or cooled by 5 ∘C/h to 975 ∘C, and then water quenched. The plate-like 10-3-8 single crystals were then separated by washing in distilled water. For the 10-4-8 phase, the tubes were heated to 1100 ∘C - 1180 ∘C, held for one week, furnace-cooled to 900 ∘C, held for one day, and then water quenched. We were not able to separate the 10-4-8 phase as sizeable crystals free from PtAs2; growth details for the 10-4-8 phase are also summarized in Table I. The sample used for single crystal structure refinement of the 10-4-8 phase was grown from Ru-containing melt. This led to improved crystallinity and approximately 9% Ru and 7% Pt substituted on Fe sites.
Crystal structure determination for both new phases was performed on single crystals at 100 K using a Bruker Apex II single crystal X-ray diffractometer with graphite-monochromated Mo Kα radiation ( = 0.71073 Å ). Unit cell refinement and data integration were performed with Bruker APEX2 software package. Unit cell determination was aided by the CELL NOW program ShelX . The crystal structures were refined using SHELXL-97 ShelX implemented through WinGX WinGX . X-ray powder diffraction patterns were collected on a Bruker D8 Focus diffractometer employing Cu ( ) radiation and a graphite diffracted beam monochromator. Rietveld refinement was carried out using the FULLPROF program suite fullprof . The Bragg peaks were refined using the Thompson-Cox-Hastings pseudo-Voigt function convoluted with an axial divergence asymmetric peak shape; [001] preferred orientation was included in the powder refinements. The elemental analysis was made using energy dispersive X-ray spectroscopy (EDS) in FEI Quanta 200 FEG Environmental-SEM.
DC magnetization, and , were measured in a Quantum Design (QD) Magnetic Properties Measurement System (MPMS) superconducting quantum interface device (SQUID) magnetometer. Heat capacity (relaxation method), AC susceptibility, resistivity and Hall coefficient measurements were performed in a QD Physical Properties Measurement System (PPMS). The standard four-probe technique was employed for the resistivity measurements (I=1 ). A four-wire geometry was used in the Hall coefficient measurements. To remove the magnetoresistive components, the polarity of the magnetic field () was switched. In both resistivity and Hall effect measurements, the four thin platinum wires employed were attached to the sample with Epotek H20E silver epoxy. Seebeck coefficient measurements were performed with a modified MMR Technologies SB100 Seebeck measurement system.
III Results
III.1 Crystal Structure
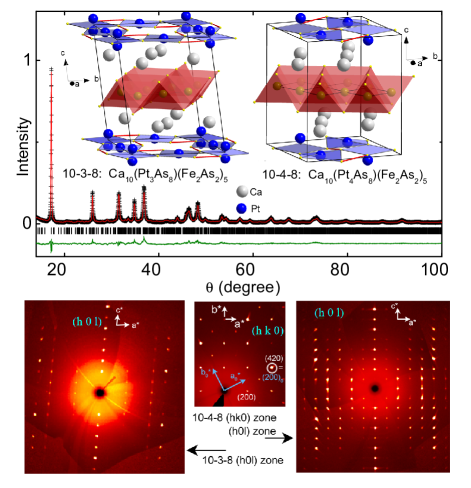
The crystal structures of the Ca10(Pt3As8)(Fe2As2)5 (10-3-8) and Ca10(Pt4As8)(Fe2As2)5 (10-4-8) superconducting phases, which have -Ca-(PtnAs8)-Ca-(Fe2As2)- stacking, as well as selected single crystal and powder X-ray diffraction patterns, are shown in Fig. 1. The detailed crystallographic data determined from the single crystal structure refinements are summarized in Table II and III; crystals with minimal twinning were chosen for the structure determinations, and the appropriate twin laws were incorporated into the structure model. The top panel of Fig. 1 shows that the powder X-ray pattern for the 10-3-8 phase can be described well by the determined crystal structure. For both compounds, the strongest reflections reveal a simple tetragonal basal plane subcell with 3.91 Å as shown in the single crystal X-ray diffraction pattern. However, weaker superlattice reflections, which correspond to a square structural supercell in the real space basal plane, oriented in the (210) direction, are also observed and lead to . This unusual superlattice condition is mathematically equivalent to that seen in K0.8Fe2-δSe2 Green , but arises from a completely different chemical mechanism — the commensurability condition of the (Pt3As8) or (Pt4As8) skutterudite layers with the Fe2As2 layers, rather than partial vacancy ordering. Inspection of the single crystal diffraction patterns in the direction indicates that 10-4-8 phase has a primitive tetragonal cell, while the 10-3-8 phase shows significant shifting of the stacking between neighboring layers. This layer shift results in a triclinic unit cell, despite the fact that the basal plane cell is essentially square, i.e., with and .
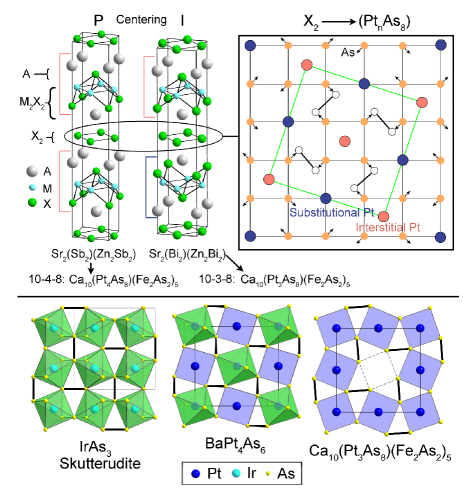
The 10-3-8 and 10-4-8 phases are new structure types that can be classified as derivatives of the SrZnBi2 and SrZnSb2 structures respectively hoffman , as shown in the top left panel of Fig. 2. As variants of the more common ThCr2Si2 structure, which accounts for many of the high Fe pnictide superconductors, the SrZnSb2 and SrZnBi2 structure types have every other M2X2 tetrahedral layer in AM2X2 replaced with a square X2 layer of the same size, as shown in Fig. 2. The only difference between the SrZnSb2 and SrZnBi2 structures is that one is body centered while the other is primitive. This difference in centering is allowed chemically because the X2 layer is not sensitive to the adjacent A cation arrangement, resulting in the fact that both staggered and nonstaggered stackings can form around this layer. The difference in stacking has a profound effect in the superconducting phases, in which the X2 layer is replaced by a more complex Pt-As layer that is very sensitive to the stacking difference.
The X2 layers are transformed to Pt3As8 and Pt4As8 layers in Ca10(Pt3As8)(Fe2As2)5 and Ca10(Pt4As8)(Fe2As2)5 respectively. This transformation is illustrated schematically in the top left panel in Fig. 2. Starting from the square lattice of As atoms, the substitution of 1/5 of the As with Pt and the insertion of interstitial Pt leads to strong displacements of the As from their ideal positions. This occurs so that intralayer As-As dimers are formed and new PtnAs8 (n=3, 4) skutterudite-like layers emerge. The periodicity of these layers is based on the size of the the Pt sublattice, which matches the FeAs lattice size with . Thus, the Fe2As2 and PtnAs8 layers become commensurate in the (210) Fe2As2 direction (Fig. 2 upper right). The resulting Pt3As8 intermediary layer for the 10-3-8 superconductor is illustrated in the right bottom panel of Fig. 2. The layer consists of a square lattice of corner-sharing PtAs4 squares with a rotation of about an axis perpendicular to the plane, governed by the formation of intraplanar As-As dimers. This arrangement of atoms is unique in the superconducting iron pnictides, but is fairly common in platinum group pnictides. A simple example of a compound where such rotations of corner shared MX4 squares is dictated by the formation of pnictide-pnictide bonds is skutterudite IrAs3 iras3 , shown in the lower panel of Fig. 2. In this compound the arrangement of As atoms has the same projected in-plane structure but all the Ir atoms are octahedrally coordinated rather than having the lower coordination observed for Pt in the 10-3-8 and 10-4-8 phases. Platinum-based compounds with very similar structures have also been observed, such as BaPt4As6 baas , shown in Fig. 2, where 1/2 of the Pt are octahedrally coordinated and the rest are square planes. In both cases the rotations have an out of plane component, which causes the spacing between Pt atoms to contract. The As-As bond distance in the dimers is quite similar in these two compounds, 2.47 Å - 2.54 Å in IrAs3 and 2.41 Å - 2.42 Å in BaPt4As6. These distances are comparable to very similar distances in the new Ca-Fe-Pt-As superconductors where they are 2.48 Å - 2.49 Å in the 10-3-8 phase and 2.49 Å in the 10-4-8 phase.
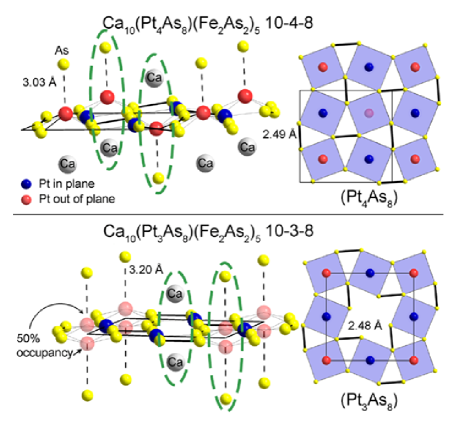
The limited range of the As-As bond lengths present in the new superconductors indicates that the size of the Pt sublattice is constrained by both the As-As dimer size and the Fe2As2 sublattice size. The net result of these strong constraints is that only 1/2 of the total number of square sites in the plane are large enough to contain a Pt atom in a simple square planar coordination with As. This means that Pt cannot sit exactly in the middle of the remaining squares, but instead must be displaced to a position about 0.5 Å above or below the plane to have favorable Pt-As bond lengths. This displacement causes a conflict with the Ca ions that are adjacent to the Pt-As layers, resulting in the difference in symmetry and formula for the primitive and body centered superconducting phases. This situation is illustrated in Fig. 3, which compares the Pt3As8 and Pt4As8 layers in detail. The Pt atoms shown in blue are present in both Pt3As8 and Pt4As8 layers and are the ones called substitutional Pt atoms in Fig. 2. The Pt atoms shown in red (the ones called interstitial Pt atoms in Fig. 2) are critical to the Pt stoichiometry of the layers. The differences can be seen by focusing on the parts of the structures that are encircled by the dashed ovals in the figure. In the primitive 10-4-8 case (top panel), for each interstitial Pt site, only one side of the plane is blocked by Ca, resulting in rooms for a single Pt atom above the plane on one site and below the plane on the other. In the 10-3-8 case, on the other hand (bottom panel), one of the potential interstitial Pt sites is blocked on both sides of the plane by the presence of Ca ions, and thus no Pt atoms can sit on these sites; for the other potential interstitial sites, however, Ca does not interfere, and Pt can occupy a position on either side of the plane. Pt cannot occupy both sides of the plane at once, however, because then the Pt-Pt separations would be too small; thus the above-plane and below-plane sites are randomly occupied with a 50% probability. We do not have any evidence that there is any long range ordering to lift this disorder. This difference in the blocking of the interstitial Pt sites, due to the different arrangements of neighboring Ca, accounts for the difference in formulas of the two new superconductors because the 10-3-8 structure can only accommodate filling of 1/2 of the interstitial Pt sites while the 10-4-8 structure allows filling of all of them.
III.2 Physical Properties
In all preparations of the 10-3-8 and 10-4-8 superconductors, we found some fraction of Pt doped on the Fe site in the Fe2As2 layers. EDS (Energy dispersive X-ray spectroscopy) measurements were used to determine the Pt doping concentrations on the Fe sites through measuring the percentages of elements present in the resistivity sample. Structure refinements confirm the Pt doping in the layers and the fact that Fe is not found in the Pt-As intermediary layers. (To easily compare the physical properties of the new superconductors with the other Fe pnictide superconductors, which have much simpler formulas, the units of molar susceptibility, magnetization and heat capacity presented are normalized to one (Fe1-xPtx)2 per formula unit.) The EDS measured values are summarized in Table I.
| phase | starting ratio | EDS | (K) | (K) | |
|---|---|---|---|---|---|
| Ca:Fe:Pt:As | Ca:Fe:Pt:As | ||||
| 10-3-8 | 2 : 2 : 0.4 : 4 | 2 : 1.93(3) : 0.70(1) : 3.86(5) | 0.06(1) | 0 | 0 |
| 2 : 2 : 0.5 : 4 | 2 : 1.89(3) : 0.73(1) : 3.83(5) | 0.07(1) | 5.9 | 4.9 | |
| 4.3 : 2 : 0.7 : 6.3 | 2 : 1.86(2) : 0.77(1) : 3.88(2) | 0.09(1) | 9.6 | 8.2 | |
| 3 : 2 : 1 : 4 | 2 : 1.79(4) : 0.88(2) : 3.7(1) | 0.13(1) | 9.9 | 10.6 | |
| 10-4-8 | 2 : 1.5 : 1.5 : 4 | 2 : 1.77(4) : 1.08(1) : 3.77(6) | 0.13(1) | 22.5 | 24.6 |
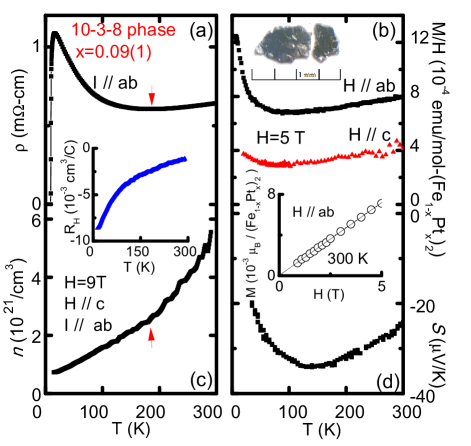
As a representative of the 10-3-8 phase, the picture of the mm-size single crystals and the physical properties of the sample are shown in Fig. 4. Figure 4 (a) shows the electrical resistivity, , from 2 to 300 K. As temperature decreases, the resistivity slowly decreases from 0.7 m-cm at 300 K to 0.61 m-cm near 190 K, indicated with the red arrow, and then increases monotonically to 1.1 m-cm at 12 K, followed by a sharp decrease to zero at the superconducting transition. The magnitude of the normal state resistivity is similar to that seen in other Fe pnictide superconductors, an indication of the “poor metal” nature of the phase. Figure 4 (b) presents the normal-state magnetic properties. At 300 K, the magnetization is linearly proportional to H, indicating that no ferromagnetic impurities are present in the single crystal sample. Thus the temperature dependent susceptibility, , was measured at 5 T and calculated as . Magnetic anomalies, such as are often associated with structural or magnetic phase transitions in the pnictide superconductors, were not observed for the 10-3-8 compound, with either H or H . The upturn in below 80 K may be attributed to paramagnetic impurities in the sample. From 80 to 300 K, increases approximately linearly with temperature. The ratio of over at 300 K is 2. This value is larger than the ratio of 1.6 observed in CaFe2As2, indicating higher anisotropy in the 10-3-8 superconductor. The Hall coefficient, , shown in the inset of Fig. 4 (c), is negative at all temperatures, indicating that electron carriers are dominant in this compound. If a single band model is assumed, then the carrier concentration can be estimated as . This is plotted as a function of temperature in Fig. 4 (c). decreases from 5.5 at 300 K (3.2 times of that of LaFeAsO0.89F0.11) to 0.74 at 12 K. A slope change is observed in at around 190 K, indicated by the red arrow, at the same temperature where the minimum normal-state resistivity is found (Fig. 4 (a)). The Seebeck coefficient, shown in Fig. 4 (d), is negative throughout the measured temperature range, with a room temperature value of -24.3 V/K and minimum value of -34.3 V/K near 150 K; this again indicates the dominant role of electrons in the transport.
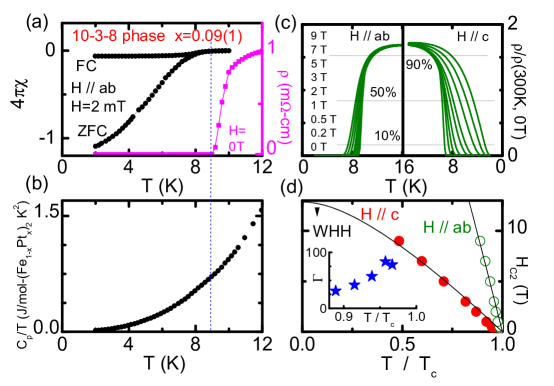
Figure 5 presents the physical properties of the superconducting state for the triclinic 10-3-8 phase. The zero-field-cooled (ZFC) and field-cooled (FC) DC susceptibility measurements were performed at 2 mT with so that the demagnetization effect could be minimized. The diamagnetic signal observed below 9 K in both ZFC and FC measurements confirms the bulk superconductivity in this compound, and is consistent with the resistivity measurements. The shielding fraction estimated from the ZFC data is around 120%, similar to what is observed in transition metal doped BaFe2As2 nico . The Meissner fraction inferred from the FC data is only about 6% due to the flux pinning, which is the usual case in the Fe pnictide superconductors nico . The temperature dependent data is presented in Fig. 4 (b). A subtle heat capacity jump associated with the superconducting transition is observed near 9 K, confirming the bulk superconductivity. , measured at 9, 7, 5, 3, 2, 1, 0.5, 0.2, 0 T with and is presented in Fig. 5 (c). With applied field, is suppressed to lower temperatures and the resistive transition broadens, indicating the presence of strong thermal fluctuation of the vortices. This is different from what is observed in the Ba(Fe1-xCox)2As2 superconductors, where no broadening was observed nico , but is reminiscent of that in RFeAs(O1-xFx) and cuprates naturehc2 . To determine at each field, 90%, 50% and 10% of the normal-state resistance at 16 K are used as the criteria. At 0 T, = 11.31 K, = 9.64 K and = 9.22 K. For all three criteria, the curves show roughly linear behavior. The curve, however, changes from a concave shape for the 90% criterion to a convex shape for the 10% criterion. As a compromise, we focus on the Hc2 values inferred from the 50% criterion, shown in Fig. 5 (d). With 9 T applied field, the was suppressed to 0.9 with and 0.5 with . The single band WHH theory, without taking into account the effects of spin paramagnetism and spin-orbit scattering is used to fit the curves WHH . This fit is shown as the solid curve in the panel. The resulting = 55 T, and = 13 T. The anisotropy parameter decreases from 100 near to 25 at 0.9, as shown in the inset of Fig. 5 (d). In accordance with the Ginzburg-Landau theory, and , the coherence lengths are estimated to be = 50 Å and = 12 Å .
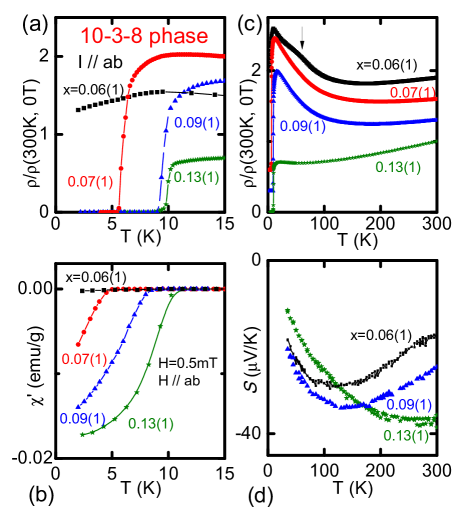
We have been successful in tuning the ground state of the 10-3-8 phase from normal to superconducting by controlling the Pt concentration. The effect of Pt doping in the 10-3-8 phase is summarized in Fig. 6. Because the samples are easily exfoliated, and thus the direct comparison of the resistivities among them are not suitablenico ; tanatar (the resistivities at 300 K are all in the 1 m-cm range), the normalized resistivity, , is employed in the figure. The enlarged near is shown in Fig. 6 (a). Zero resistivity was not observed in sample, but does appear at higher Pt concentrations; superconductivity shows up in the sample with = 5.9 K, and increases to = 9.6 K in the sample, = 9.9 K in sample. The nature of the bulk superconductivity in these samples is confirmed by the AC susceptibility data, presented in Fig. 6 (b), which shows large diamagnetic throws with similar magnitudes. The s inferred from both types of measurements are consistent with each other and summarized in Table I. Figure 6 (c) shows the evolution of from 2 to 300 K with doping (From x=0.06(1) to 0.13(1), each subsequent data set is shifted upward by 0.3 for clarity). With decreasing temperature, the resistivity of the sample slowly decreases to a minimum around 170 K, and then monotonically increases, a slope break is observed around 60 K. This resistivity shape is reminiscent of the one in underdoped Ba(Fe1-xCox)2As2 nico which is associated with the structural and magnetic phase transitions. No magnetic anomaly was observed from 2 to 300 K for this compound, however. For and 0.09(1) compounds, upon cooling, the resistivity decreases slowly first and then increases before dropping to zero; no slope break is observed. The sample shows a quite different resistivity shape, which decreases continuously from 300 to 50 K, followed by a subtle increase and then a drop to zero. This shape is reminiscent of the nearly-optimally doped Ba(Fe1-xCox)2As2 nico . The Seebeck coefficient data from 40 to 300 K is presented in Fig. 6 (d). are all negative in measured temperature, implying the dominant role of the electron carriers. At 300 K, decreases from -17 for to -37 for , indicating that the Pt doping is electron doping.
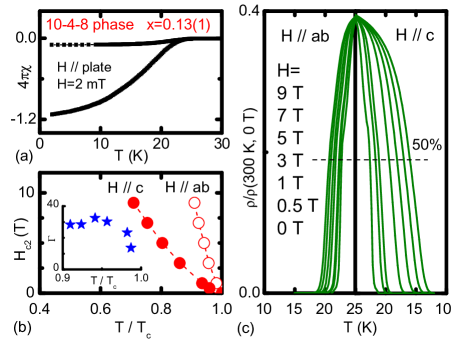
Intergrowth between the PtAs2 and the 10-4-8 phases was detected in a area using EDS. Since we were not able to separate these two phases, neither detailed physical property measurements nor doping studies were systematically performed. Here we show only the ZFC and FC DC susceptibility data (Fig. 7 (a)) and the anisotropic measurement (Fig. 7 (b) and (c)) for the 10-4-8 compound. The sample used in the measurement was cut into a plate-like shape and the magnetic field was applied along the plate to minimize the demagnetization effect. is inferred as 22.5 K. The estimated shielding fraction is around 120% (assuming no PtAs2 impurity), indicating the bulk superconductivity. A thin plate around was chosen for the anisotropic measurement. The normalized resistivity, , with field along plane and axis is shown in Fig. 7 (b). At 0 T, is 24.6 K. Compared with the 10-3-8 phase, less broadening was observed under the field. The data was inferred using the 50% criterion and summarized in Fig. 7 (c). Upon cooling, concave curves were obtained with and . Unlike the 10-3-8 phase, this concave shape is criterion-free. This non-traditional WHH shape is the feature of a two-band superconductor, such as MgB2 mgb2 and LaFeAsO89F0.11 naturehc2 . The was only suppressed to 0.9 with and 0.7 with at 9 T. Comparing with the 10-3-8 phase, less anisotropy was observed. The anisotropic parameter shown in the inset is 30 at 0.9 and 15 near while this value is 25 at 0.9 and 100 near in 10-3-8 phase.
IV Discussion
Although systematic composition dependent physical properties measurements of the 10-4-8 phase are currently not available, the lower triclinic 10-3-8 phase can be readily compared to the other Fe pnictides: 1) from 80 to 300 K, a linear temperature dependence of has also been observed in all the 1111 and 122 Fe pnictide superconductors, such as LaFeAs(O1-xFx) and Ba(Fe1-xCox)2As2 nico ; wang1 . In the latter case, the linear temperature dependence persists up to 700 K, the highest temperature measured. It has been suggested that the linear temperature dependence of is related to antiferromagnetic spin fluctuations lineartheo . 2) upon doping, the resistivity changes from a “semiconducting” appearance in the underdoped region to a “metallic” appearance near the optimal doping concentration. This systematic change is reminiscent of what is seen in other Fe pnictides, where the “semiconducting” appearance comes from the formation of a SDW gap jacs ; nico . However, no magnetic anomalies implying a magnetic phase transition were observed from 2 to 300 K in the 10-3-8 phase. It is possible that the doping level is still too high, even in the lowest Pt-content samples, and that the SDW transition has already been fully suppressed. Further investigation is needed to clarify the ground state of the undoped or very underdoped phase. 3) The anisotropy parameter ranges from 100 near to 25 at 0.9. This is much larger than the 1 to 4 in (Ba0.55K0.45)Fe2As2 mielke and even larger than the ones in RFeAsO0.8F0.2 naturehc2 , and indicates a highly anisotropic 2D nature for the 10-3-8 superconductor.
The in the 10-4-8 phase is almost twice the highest we observed in the 10-3-8 phase. Although we have not yet successfully overdoped the 10-3-8 phase, the almost linear normal-state resistivity of the 10-3-8 compound, indicates that this compound is very close to the optimal doping, and thus represents the nearly maximum obtainable in the triclinic 10-3-8 phase in the Ca-Pt-Fe-As system. Although we never observed a higher than 25 K in the 10-4-8 phase, a of 36 K was reported by Kudo et al., for a phase of unreported formula with a crystallographic cell corresponding to our tetragonal 10-4-8 phase conference , suggesting that can be even higher in the 10-4-8 phase when an optimal doping condition is obtained.
These two chemically and structurally similar compounds provide a particularly interesting platform for studying superconductivity in the pnictides. From the chemical point of view, we can straightforwardly model the effective charges in these compounds. The common assignments of Fe2+ and As3- ions in the iron arsenic layer gives the chemical formula [(Fe2As2)5]10-. In the platinum arsenide layer, due to the formation of strong As-As dimers in both compounds, the As in PtnAs8 layer contributes 1 electron to the As-As bond, forming As24-. For reduced compounds such as skutterudites and those studied here the stability of the d8 configuration for Pt rules, and the only oxidation state observed for platinum is +2; this configuration is consistent with the observed Pt-As coordination polyhedra in the superconductors. This yields an intermediary layer of (Pt3As8)10- for the 10-3-8 phase and (Pt4As8)8- for the 10-4-8 phase. This results in a major chemical and electronic difference between the two superconductors: Ca10(Pt3As8)(Fe2As2)5 is a valence satisfied compound through the Zintl concept - the negative charge on the Pt and Fe layers is perfectly balanced by the 20+ charge from the ten electropositive Ca2+ ions. In its undoped form the Pt-As layer in the 10-3-8 phase is perfectly charge balanced and therefore will be semiconducting (i.e., it will not contribute density of states at ). Ca10(Pt4As8)(Fe2As2)5 on the other hand has one more Pt atom in the Pt-As intermediary layer, thus exceeding its valence satisfaction requirements, indicating that this layer will have states at and is therefore metallic in character. Thus, given the overall highly similar structures and chemistry, we argue that the higher in the 10-4-8 phase arises because the metallic nature of its intermediary layer leads to a stronger interlayer coupling. Enhanced coupling through intermediary layers has been suggested as the origin of the very high transition temperatures in the highest Tc cuprates cup , but in the iron arsenide superconductors this is the first system where this possibility can be tested.
Structural differences may also have an impact on the superconductivity, but the usual considerations in the arsenide superconductors do not explain the observations in the present materials. With a few exceptions, an empirical rule between and , the As-Fe-As bond angle, or height, the distance between the adjacent Fe and As layer, has been observed the Fe arsenides angle ; johnston ; height . This empirical rule implies that is enhanced for As-Fe-As bond angles near that of an ideal tetrahedron, 109.47∘, or for particular values of Å . For our compounds, in the 10-3-8 phase has an average value of 108.99∘ while in the 10-4-8 phase has an average value of 107.52∘. Since the 10-4-8 phase has a higher than the 10-3-8 phase, our compounds do not follow the empirical rule of angles. Similarly, the average is 1.40 Å in the 10-3-8 phase and 1.43 Å in the 10-4-8 phase, which also does not follow the empirical rule of heights. Thus the structural differences usually credited with governing the in the arsenide superconductors cannot be operating in our phases, supporting our argument that it is the metallicity and resulting enhanced intralayer coupling in the 10-4-8 phase that determines its higher .
Significant differences in the Pt-As interactions between Pt3As8 / Pt4As8 intermediary layers and the neighboring Fe2As2 layers are also present, further strengthening our argument about the importance of the interlayer coupling in determining the s. In the 10-3-8 phase there is only one such interlayer Pt-As interaction per unit cell, and it appears to be random whether the Pt-As bond points “up” or “down”. This helps to electronically isolate intermediary layer in the 10-3-8 phase from the Fe2As2 layers, reinforcing the perfectly satisfied Zintl valence electron count in this layer, making it more electronically blocking. In the 10-4-8 compound, on the other hand, the metallic Pt4As8 layer electron count is reinforced by stronger coupling to the (Fe2As2) layers due to two rather than one bridging Pt-As interactions, and the overall tetragonal symmetry of the phase, which promotes good orbital overlap between layers. The anisotropy of the properties in the superconducting state, which show the 10-3-8 phase to be much more anisotropic than the 10-4-8 phase support the chemical picture. Thus though one can infer that although both compounds should show strong 2D character in their electronic structures, the 10-4-8 compound will exhibit more and better hybridized electronic states associated with interlayer interactions and will have an intrinsically metallic intermediary layer, which we propose leads to its much higher Tc. This suggests that further searches for superconducting iron arsenide phases with metallic intermediary layers rather than the commonly found insulating intermediary layers may be a fruitful path for obtaining higher Tcs in the pnictide superconductor family.
Acknowledgments
The authors would like to thank E. Climent-Pascual, S. Jia, S. Dutton, M. Bremholm, M. Fuccillo, M. Ali, J. Krizan, K. Baroudi and H. W. Ji for helpful discussions. This work was supported by the AFOSR MURI on superconductivity.
References
- (1) Yoichi Kamihara, Takumi Watanabe, Masahiro Hirano, and Hideo Hosono, J. Am. Chem. Soc., 130, 3296 (2008)
- (2) Marianne Rotter, Marcus Tegel, and Dirk Johrendt, Phys. Rev. Lett., 101, 107006 (2008)
- (3) X. C. Wang, Q .Q. Liu, Y .X. Lv, W. B. Gao, L. X. Yang, R. C. Yu, F. Y. Li, C. Q. Jin, Solid State Commun.,148 538 (2008).
- (4) Xiyu Zhu, Fei Han, Gang Mu, Peng Cheng, Bing Shen, Bin Zeng, and Hai-Hu Wen, Phys. Rev. B 79, 220512(R) (2009)
- (5) F. C. Hsu et al., Proc. Natl. Acad. Sci., 105, 14262 (2008)
- (6) K. Kudo et al., International workshop on novel superconductors and super materials, March 6-8, Tokyo, Japan, (2011)
- (7) Kazutaka Kudo, Yoshihiro Nishikubo, and Minoru Nohara, J. Phys. Soc. Jpn. 79, 123710 (2010)
- (8) G. M. Sheldrick, Acta Cryst., A64, 112 (2008)
- (9) L. J. Farrugia, J. Appl. Cryst., 32, 837 (1999)
- (10) J.Rodríguez-Carvajal, Physica B, 192, 55 (1993)
- (11) P. Zavalij, W. Bao, X.F. Wang, J.J. Ying, X.H. Chen, D.M. Wang, J.B. He, X.Q. Wang, G.F Chen, P.Y Hsieh, Q. Huang, M.A. Green, Unpublished, arXiv:1101.4882 (2011)
- (12) C. Zheng and R. Hoffmann, J. Am. Chem. Soc., 108, 3078 (1986)
- (13) A. Kjekshus, T. Rakke, Acta Chemica Scandinavica, Series A, 28, 99 (1974)
- (14) G. Wenski, A. Mewis, Zeitschrift fuer Naturforschung, Teil B. Anorganische Chemie, Organische Chemie, 42, 507 (1987)
- (15) N. Ni, M. E. Tillman, J.-Q. Yan, A. Kracher, S. T. Hannahs, S. L. Bud’ko, and P. C. Canfield, Phys. Rev. B, 78, 214515 (2008)
- (16) F. Hunte, J. Jaroszynski, A. Gurevich, D. C. Larbalestier, R. Jin, A. S. Sefat, M. A. McGuire, B. C. Sales, D. K. Christen and D. Mandrus, Nature 453, 903, (2008)
- (17) N. R.Werthamer, E. Helfand, and P. C. Hohenberg, Phys. Rev., 147, 295 (1966)
- (18) M. A. Tanatar, N. Ni, C. Martin, R. T. Gordon, H. Kim, V. G. Kogan, G. D. Samolyuk, S. L. Bud’ko, P. C. Canfield, and R. Prozorov, Phys. Rev. B 79, 094507 (2009)
- (19) A. Gurevich, Physica C, 456, 169 (2007)
- (20) X. F. Wang, T. Wu, G. Wu, H. Chen, Y. L. Xie, J. J. Ying, Y. J. Yan, R. H. Liu, and X. H. Chen, Phys. Rev. Lett., 102, 117005 (2009)
- (21) M. M. Korshunov, I. Eremin, D. V. Efremov, D. L. Maslov, and A. V. Chubukov, Phys. Rev. Lett. 102, 236403 (2009)
- (22) M. M. Altarawneh, K. Collar, and C. H. Mielke, N. Ni, S. L. Bud’ko, and P. C. Canfield, Phys. Rev. B, 78, 220505(R) (2008)
- (23) P. A. Sterne and C. S. Wang, J. Phys. C: Solid State Phys. 21, 949 (1988)
- (24) C. H. Lee, A. Iyo, H. Eisaki, H. Kito, M. T. Fernandez-Diaz, T. Ito, K. Kihou, H. Matsuhata, M. Braden and K. Yamada, J. Phys. Soc. Jpn., 77, 83704 (2008)
- (25) David C. Johnston, Adv. in Phys., 59, 803 (2010)
- (26) Y. Mizuguchi, Y. Hara, K. Deguchi, S. Tsuda, T. Yamaguchi, K. Takeda, H. Kotegawa, H. Tou and Y. Takano, Supercond. Sci. Technol., 23, 54013 (2010)
| The 10-3-8 phase ∗ | ||||
|---|---|---|---|---|
| Crystal system | Triclinic | Sample size | mm3 | |
| Space group | (# 2) | Total reflection | 2229 | |
| 1 | Absorption coefficient | 39.203 / mm | ||
| Unit cell parameters | =8.759(4) Å , =8.759(4) Å , =10.641(5) Å , =788.1(6) Å3 | |||
| =94.744(5)∘, =104.335(5)∘, =90.044(3)∘ | ||||
| Atomic position | ||||
| site | Wyck | |||
| Ca1 | 2i | 0.3655(4) | 0.1218(4) | 0.2330(4) |
| Ca2 | 2i | 0.7745(4) | -0.0751(4) | 0.2352(4) |
| Ca3 | 2i | 0.4386(4) | 0.4798(4) | 0.7947(4) |
| Ca4 | 2i | 0.0284(4) | 0.6810(4) | 0.7658(4) |
| Ca5 | 2i | 0.1688(4) | 0.7278(4) | 0.2336(4) |
| Fe1 | 2i | 0.1521(7) | 0.5495(8) | 0.5001(6) |
| Fe2 | 2i | 0.2521(7 | 0.2518(7) | 0.4986(6) |
| Fe3 | 2i | 0.3494(5) | -0.0501(6) | 0.5004(4) |
| Fe4 | 2i | 0.0498(7) | -0.1517(7) | 0.4977(5) |
| Fe5 | 2i | 0.4516(8) | 0.6481(9) | 0.5012(8) |
| Pt1 | 2i | 0 | 1/2 | 0 |
| Pt2 | 2i | 1/2 | 0 | 0 |
| Pt3 | 2i | -0.01687(17) | -0.00552(17) | -0.05612(16) |
| As1 | 2i | 0.11089(19) | 0.03715(19) | 0.36734(18) |
| As2 | 2i | 0.50913(19) | -0.16606(19) | 0.36329(18) |
| As3 | 2i | 0.70762(19) | 0.23873(19) | 0.36320(18) |
| As4 | 2i | 0.68943(19) | 0.56295(19) | 0.63737(17) |
| As5 | 2i | 0.09241(19) | 0.36517(19) | 0.63661(18) |
| As6 | 2i | 0.7344(2) | 0.40095(19) | 0.00012(19) |
| As7 | 2i | 0.4011(2) | 0.2652(2) | -0.00063(19) |
| As8 | 2i | 0.2432(2) | 0.8819(2) | -0.0001(2) |
| As9 | 2i | 0.1184(2) | 0.2435(2) | -0.0001(2) |
| The 10-4-8 phase∗ | ||||
|---|---|---|---|---|
| Crystal system | Tetragonal | Sample size | mm3 | |
| Space group | (# 85) | Total reflection | 823 | |
| 1 | Absorption coefficient | 42.222 / mm | ||
| Unit cell parameters | =8.7257(18) Å =8.7257(18) Å , =10.4243(22) Å , =793.7(2) Å3 | |||
| =90∘, =90∘, =90∘ | ||||
| Atomic position | ||||
| site | Wyck | |||
| Ca1 | 2c | 1/4 | 1/4 | 0.7736(5) |
| Ca2 | 8g | 0.3454(2) | 0.9520(2) | 0.2417(3) |
| Fe1 | 2b | 3/4 | 1/4 | 1/2 |
| Fe2 | 8g | 0.457(2) | 0.155(3) | 0.502(3) |
| Pt1 | 2c | 1/4 | 1/4 | 0.06923(9) |
| Pt2 | 2a | 1/4 | 3/4 | 0 |
| As1 | 8g | 0.54824(10) | 0.34999(11) | 0.63637(13) |
| As2 | 2c | 1/4 | 1/4 | 0.3603(2) |
| As3 | 8g | 0.50954(14) | 0.85900(12) | 0.01687(12) |