STAR AND DUST FORMATION ACTIVITIES IN AzTEC-3,
A STARBURST GALAXY AT z = 5.3
Abstract
Analyses of high-redshift ultraluminous infrared (IR) galaxies traditionally use the observed optical to submillimeter spectral energy distribution (SED) and estimates of the dynamical mass as observational constraints to derive the star formation rate (SFR), the stellar mass, and age of these objects. An important observational constraint neglected in the analysis is the mass of dust giving rise to the IR emission. In this paper we add this constraint to the analysis of AzTEC–3. Adopting an upper limit to the mass of stars and a bolometric luminosity for this object, we construct different stellar and chemical evolutionary scenarios, constrained to produce the inferred dust mass and observed luminosity before the associated stellar mass exceeds the observational limit. We use the PÉGASE population synthesis code and a chemical evolution model to follow the evolution of the galaxy’s SED and its stellar and dust masses as a function of galactic age for seven different stellar initial mass functions (IMFs). We find that the model with a Top Heavy IMF provided the most plausible scenario consistent with the observational constraints. In this scenario the dust formed over a period of Myr, with a SFR of yr-1. These values for the age and SFR in AzTEC–3 are significantly higher and lower, respectively, from those derived without the dust mass constraint. However, this scenario is not unique, and others cannot be completely ruled out because of the prevailing uncertainties in the age of the galaxy, its bolometric luminosity, and its stellar and dust masses. A robust result of our models is that all scenarios require most of the radiating dust mass to have been accreted in molecular clouds. Our new procedure highlights the importance of a multiwavelength approach, and of the use of dust evolution models in constraining the age and the star formation activity and history in galaxies.
Subject headings:
galaxies: evolution, high-redshift, starburst: individual: (AzTEC3) - infrared: galaxies1. INTRODUCTION
The origin of the dust in ultraluminous high redshift galaxies with redshifts is still unresolved, with supernovae (SNe), evolved AGB stars, the winds around active galactic nuclei (AGN), or growth in molecular clouds as possible sources (Elvis et al., 2002; Morgan & Edmunds, 2003; Maiolino et al., 2004; Dwek et al., 2007; Valiante et al., 2009; Dwek & Cherchneff, 2011; Michałowski et al., 2010a; Gall et al., 2011a, b). Further complicating the origin of dust in some objects is the energy source powering the IR emission. An IR luminosity powered by luminous massive stars will suggest a high present SFR, favoring a SN origin for the dust. An IR luminosity that is powered by an active galactic nucleus (AGN) suggests a low present SFR and may favor the delayed injection of dust by AGB stars that may have formed during an earlier phase of much higher star formation activity (Valiante et al., 2009; Dwek & Cherchneff, 2011).
No such ambiguity exists for AzTEC–3, an ultraluminous IR galaxy located at redshift , that was first detected at submillimeter wavelengths by Scott et al. (2008). It is a radio-dim source (Younger et al., 2007) with no X-ray counterpart (Capak et al., 2011), and part of a young cluster, representing an overdensity of early massive galaxies at the same redshift (Capak et al., 2011). Optical to submillimeter observations summarized in Capak et al. (2011) show that the energy output is dominated by its far-infrared (IR) emission with luminosities between . The lack of any radio or X-ray counterparts suggests that this luminosity is powered by a 1800 yr-1 starburst (Riechers et al., 2010; Capak et al., 2011). The total CO-inferred gas mass is , which will be depleted in less than Myr at this SFR. Such energy output suggests the presence of a large amount of dust, which had to be created (at least) in less than Gyr, the age of the universe at that redshift. AzTEC–3 therefore falls in the category of extreme starburst galaxies with large dust masses ( ) described by Michałowski et al. (2010b) and Robson et al. (2004).
In this paper we present a new comprehensive approach for studying the star formation properties and the origin of dust in AzTEC–3. The approach is quite general and can be applied to any local or high-redshift galaxy. We first use the UV to far-IR SED of the galaxy to determine its bolometric luminosity and dust mass. Its SFR depends on the adopted IMF, and we generate a series of models relating the bolometric luminosity to the stellar mass and galactic age for different stellar IMFs (Section 2). In Section 3 we use the observed UV-optical (UVO) spectrum, the UVNIR SED, and dynamical limits on the stellar mass to constrain the age of the galaxy from observations. We then generate different scenarios for the evolution of the dust, characterized by different IMFs, and examine which scenario is capable of producing the inferred dust mass in AzTEC–3 within the allowed age limit, that is, before the concurrent stellar mass production exceeds the stellar mass limit (Section 4). Our results are discussed and summarized in Section 5.
In all our calculations we adopt a flat CDM cosmology, with a baryonic density parameter , a total matter (dark+baryonic) density parameter of , a vacuum energy density , and a Hubble constant of km s-1 Mpc-1 (Spergel et al., 2007).
2. PROPERTIES OF AzTEC–3
2.1. Bolometric Luminosity and Dust Mass
Figure 1 depicts the visible to far-IR flux, , from the galaxy calculated for a redshift of . The observed fluxes were taken from Capak et al. (2011).
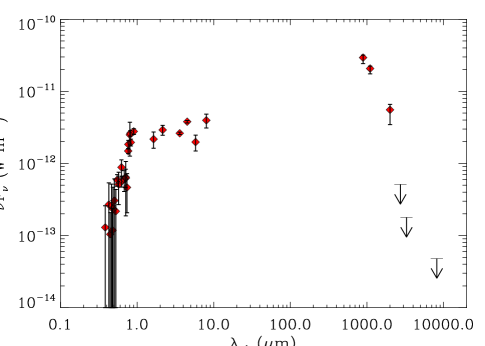
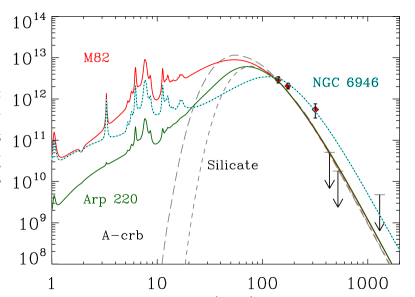
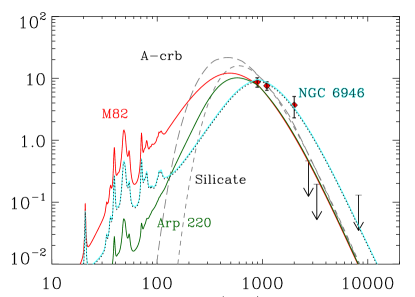
The figure shows that the energy output from the galaxy is dominated by the stellar radiation that is absorbed and reradiated by dust at IR wavelengths. Observed IR flux densities and their 1 uncertainties are listed in Table 1. Figure 2 shows the far-IR galaxy’s SED in its rest frame (left panel) and the observer’s frame (right panel). Also shown in the Figure are fits of the spectra of individual dust species to the observations. In order to determine the uncertainties in the derived dust temperatures, dust masses, and IR luminosities, we constructed 1000 realizations of the observed spectrum. The flux at each wavelength was randomly chosen from a normal distribution centered around the nominal flux. The derived quantities for the different dust compositions are listed in Table 2. The Fe and graphite dust spectra are similar to that of the silicate dust, and were left out of the figure for sake of clarity. Dust masses vary greatly from , if all the dust in AzTEC–3 is in the form of amorphous carbon, to , if it consists of only silicate dust. Because of the skin effect, the absorptivity of metallic Fe depends on the the grain radius, and the mass presented in the table was calculated for a radius of 0.33 m for which the mass absorption coefficient, , was maximum at the wavelength of 174.6 m. This choice of minimizes the mass of Fe dust required to fit the observed fluxes. Since AzTEC–3 is not likely to contain only pure Fe, silicate, or carbon-type dust, any dust consisting of a mixture of these elements will vary between between these mass estimates.
| (m) | (mJy) | (mJy) | (m)11Restframe wavelengths and specific luminosities were calculated for a redshift of . | Hz |
|---|---|---|---|---|
| 890 | 8.7 | 1.5 | 141.3 | 1.158 |
| 1100 | 7.6 | 1.2 | 174.6 | 1.011 |
| 2000 | 3.7 | 1.4 | 317.5 | 0.492 |
| 2730 | 0.47223- upper limits. | 433.3 | 0.0412 | |
| 3280 | 0.20223- upper limits. | 520.6 | 0.0173 | |
| 8165 | 0.087223- upper limits. | 1296.0 | 0.0116 |
| Composition | (K) | (cm2 g11The mass absorption coefficient at wavelength m. | ||
|---|---|---|---|---|
| Fe22Fe mass was calculated for a grain radius of 0.33 m. See text for details. | 32.4 6.1 | 16.5 | ||
| Graphite | 27.54.5 | 17.6 | ||
| Silicate | 28.5 4.3 | 10.5 | ||
| A-carbon | 46.914.8 | 28.0 | ||
| M 82 template | ||||
| Arp 220 template | ||||
| NGC 6946 template |
To get a more realistic presentation of the mixture of dust compositions and size distribution in AzTEC–3 we also fitted its spectrum with that of two local starburst galaxies: M82, and Arp220, and a normal star forming galaxy NGC6946. The spectra of these galaxies were obtained by using population synthesis models to derive their stellar emission, chemical evolution models to derive their metallicity and dust composition, and radiative transfer models including the stochastic heating of dust to derive their IR spectrum and dust mass (Galliano et al., 2008). Transferred to a redshift of , the IR luminosities and dust masses for all three galaxies were derived from their normalization factors, obtained from the least-squares fit of their spectra to the AzTEC–3 observations. The spectra depicted in the Figure represent the total IR emission from dust residing in HII and photodissociation regions. Both starburst galaxies, M82 and Arp220, provided a very good fit to the data. Dust masses varied from 1.4 to , and IR luminosities ( m) from 0.79 to . In contrast, the dust in NGC6946 is too cold, and its far-IR emission exceeds the 3- upper limits on the underlying continuum of the detected CO() and CO() lines (Riechers et al., 2010). This is evident in the inferred dust mass for this galaxy, which is in excess of .
For sake of being definitive we adopt throughout this paper a dust mass, , of , representing the average value between M82 and Arp220. Our choice of average dust mass derived from these template galaxies is more realistic than any choice based on the assumption that all the IR emission is produced by a single dust specie. The average IR luminosity of these two galaxies is and since the bolometric luminosity of AzTEC–3 is dominated by the IR emission component we adopt a bolometric luminosity, , that is equal to .
2.2. The Star Formation Rate
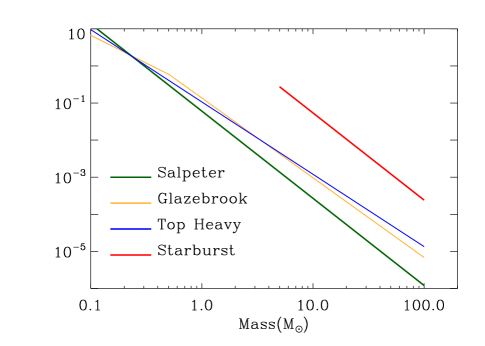
The far-IR luminosity provides a good measure of the star formation activities in galaxies (Kennicutt, 1998). In a galaxy with ongoing star formation the bolometric luminosity and stellar mass increase with time because of the cumulative contribution from long-lived low-mass stars. Derived star formation rates depend therefore on the assumed star formation history of the galaxy. Furthermore, the relation between the luminosity and star formation rate depends on the adopted stellar IMF. Massive stars radiate much more efficiently than low mass ones (, in solar units) so that an IMF weighted more heavily towards massive stars will require a lower SFR for a given observed luminosity. To explore the dependence of the SFR on the stellar IMF, we used seven different functional forms to characterize the latter. The parameters characterizing the IMFs are given in Table 3, and Figure 3 depicts the functional form of 4 select IMFs. Table 3 also includes two characteristic values of the different IMFs: , which is the IMF-averaged mass, and , which is the mass of stars that need to be formed to produce one Type II SN event. With these definitions, the stellar birthrate (yr-1) is given by SFR/, and the SN rate by SFR/.
for ;
for ; and
for
| IMF | M1 | M2 | M3 | M4 | 22The IMF averaged stellar mass. | m⋆33The mass of all stars born per SN event (Dwek & Cherchneff, 2011) | |||
|---|---|---|---|---|---|---|---|---|---|
| Glazebrook | 1.5 | 2.15 | 0.1 | 0.5 | 100 | 0.72 | 70.0 | ||
| Kroupa | 1.3 | 2.3 | 0.1 | 0.5 | 100 | 0.64 | 89.6 | ||
| Mass Heavy | 2.35 | 1.0 | 100 | 3.1 | 52.7 | ||||
| Paunchy | 1.0 | 1.7 | 2.6 | 0.1 | 0.5 | 4 | 100 | 1.1 | 66.4 |
| Salpeter | 2.35 | 0.1 | 100 | 0.35 | 134.7 | ||||
| Starburst | 2.35 | 5.0 | 100 | 12.8 | 24.4 | ||||
| Top Heavy | 1.95 | 0.1 | 100 | 0.78 | 55.4 |
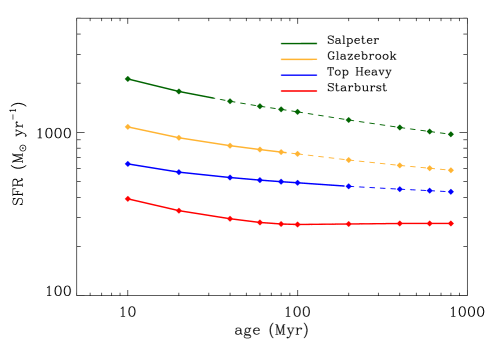
To determine the SFR and the mass of stellar objects as a function of galactic age we ran the PÉGASE population synthesis code developed by Fioc & Rocca-Volmerange (1997) for the seven different stellar IMFs, listed in Table 3, for a constant SFR of 1 yr-1. Table 4 list the corresponding bolometric luminosities and stellar masses at different galactic ages. For example, for the adopted , the table shows that for a Glazebrook IMF the SFR is yr-1 and the total mass of stars is when the galaxy reaches an age of 100 Myr. At the same age, a starburst IMF will require a SFR of only yr-1 to produce the same luminosity, and will have created of stars. Figure 4 depicts these results in graphic form, showing the constant SFR required to produce a bolometric luminosity of at a given age for 4 different IMFs. The bold section in each line depicts the allowed range of galaxy ages before the model violates the constraint on the stellar mass, a topic discussed in detail in Section 3.3 below. We emphasize that this figure does not represent the evolution of the SFR with time. For each stellar IMF, it depicts the value of the constant SFR needed to produce a bolometric luminosity of at the assumed galactic age. The required SFR is lower for older systems because a larger fraction of arises from the accumulation of lower mass stars over the galaxy’s lifetime.
| Starburst age (yr) | 107 | 108 | 109 | 1010 |
|---|---|---|---|---|
| Glazebrook | ||||
| 9.26e+09 | 1.36e+10 | 1.74e+10 | 2.20e+10 | |
| 1.03e+07 | 7.61e+07 | 5.89e+08 | 4.50e+09 | |
| Kroupa | ||||
| 7.33e+09 | 1.13e+10 | 1.54e+10 | 2.08e+10 | |
| 1.05e+07 | 8.06e+07 | 6.40e+08 | 4.92e+09 | |
| Mass Heavy | ||||
| 1.20e+10 | 1.90e+10 | 2.65e+10 | 3.25e+10 | |
| 1.02e+07 | 6.70e+07 | 3.80e+08 | 1.15e+09 | |
| Paunchy | ||||
| 7.83e+09 | 1.43e+10 | 2.05e+10 | 2.53e+10 | |
| 1.05e+07 | 7.64e+07 | 4.92e+08 | 3.08e+09 | |
| Salpeter | ||||
| 4.71e+09 | 7.49e+09 | 1.06e+10 | 1.49e+10 | |
| 1.07e+07 | 8.76e+07 | 7.56e+08 | 6.46e+09 | |
| Starburst | ||||
| 2.55e+10 | 3.67e+10 | 3.62e+10 | 3.41e+10 | |
| 9.20e+06 | 2.76e+07 | 3.17e+07 | 7.18e+07 | |
| Top Heavy | ||||
| 1.56e+10 | 2.04e+10 | 2.34e+10 | 2.56e+10 | |
| 9.72e+06 | 6.23e+07 | 4.45e+08 | 3.32e+09 |
3. THE AGE OF AzTEC–3
3.1. Spectral Constraints on the Age
The preceding section illustrated the importance of knowing the galactic age for determining the star formation, and the stellar and elemental enrichment histories of a galaxy. The UVO spectrum can contain important information for determining this age. Figure 1 in Capak et al. (2011) presents the full resolution spectrum of AzTEC–3, obtained with the Keck II telescope. The spectrum shows Si II and C IV stellar absorption features which are indicative of the presence of a population of young O and B stars. In a single burst of star formation the spectral contribution from young stars should diminish with time. The presence of these features therefore led them to the conclusion that AzTEC–3 should be less than Myr old. However, in an ongoing star formation scenario, the stellar population will always contain young O and B stars, and their spectral features will only fade at much later times as they are gradually overwhelmed by the featureless continuum from the less massive stars.
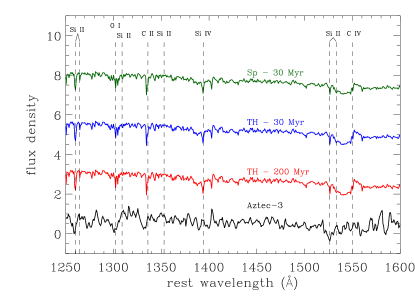
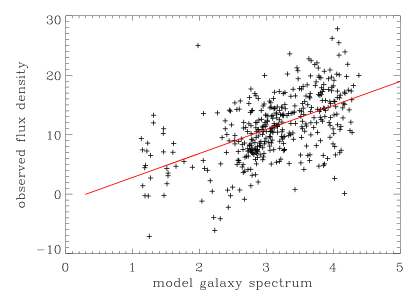
To examine if the observed spectrum can be used to determine the age of the galaxy we constructed synthetic UV spectra for constant star formation scenarios and different stellar IMFs (TH=Top Heavy; Sp=Salpeter) using Starburst99 (Leitherer et al., 1999; Vázquez & Leitherer, 2005; Leitherer et al., 2010). Figure 5 compares the synthetic spectra with the observed one. The figure shows that the TH model spectra have not evolved significantly in shape between the ages of 30 and 200 Myr. Their total intensity has, of course evolved, an effect not shown in the figure because of the offset. They are also identical to the Sp model at 30 Myr. The simulations show that when star formation is an ongoing process, the spectrum does not evolve significantly because even a very small number of O/B stars will dominate the UV emission. The AzTEC–3 spectrum shows some of the same stellar absorption features present in the synthetic spectra, but contains in addition features caused by interstellar absorption, a process that is not included in the Starburst99 models. The right panel of the figure shows the correlation between the observed spectrum and that of one of the models. Except for a constant offset caused by the evolution of the total intensity of the spectrum, the correlation plot is identical for all models.
The similarity of the AzTEC–3 spectrum to the model spectra, and the fact that the model spectra are essentially identical even though they represent different epochs and were generated with different IMFs, shows that the observed Å spectrum cannot be used to constrain the age of the galaxy when star formation is an ongoing process.
3.2. SED Contraints on the Age: The Age Degeneracy
The UVNIR SED of a galaxy can provide independent constraints on its age. Using the results of the previous section we created a library of intrinsic stellar SEDs for the seven IMFs and for a grid of galaxy ages, ranging up to to 800 Myr. The results are shown in Figures 6 and 7 for 4 select IMFs and for ages between 10 and 400 Myr. Each panel in the figure presents the intrinsic SED (black line) generated by a distinct evolutionary sequence that is terminated at the assumed galactic age presented in the panel. Each evolutionary sequence is characterized by a constant SFR which is distinct from other sequences and determined by the stellar IMF and the galactic age for the adopted bolometric luminosity of (see Table 4 and Figure 4). So the Salpeter 20 Myr panel represents the SED of a galaxy that underwent a constant SFR of yr-1 for that length of time. In each panel, the intrinsic SED is clearly in excess of the observed stellar flux (red diamonds), which has been significantly attenuated by dust. Lacking a definitive dust model for the IR emission, we used the Calzetti law (Calzetti et al., 2000) to characterize the extinction. For each evolutionary sequence we calculated the visual optical depth, , that provided the best least-squares fit to the observations. Values of ranged from . The attenuated stellar spectra are presented by violet lines in the figures.
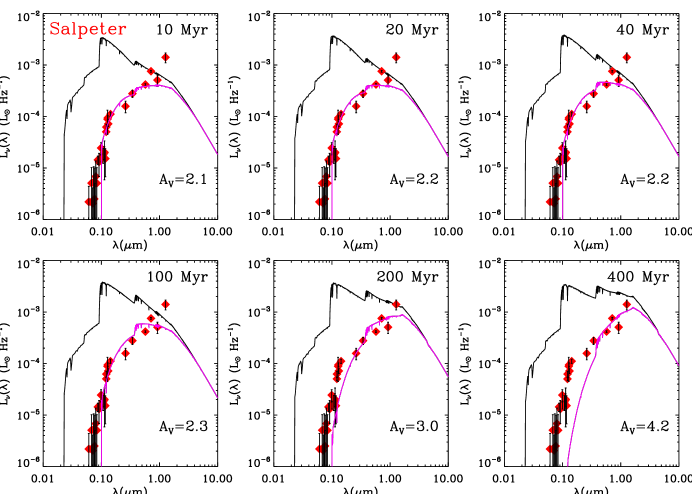
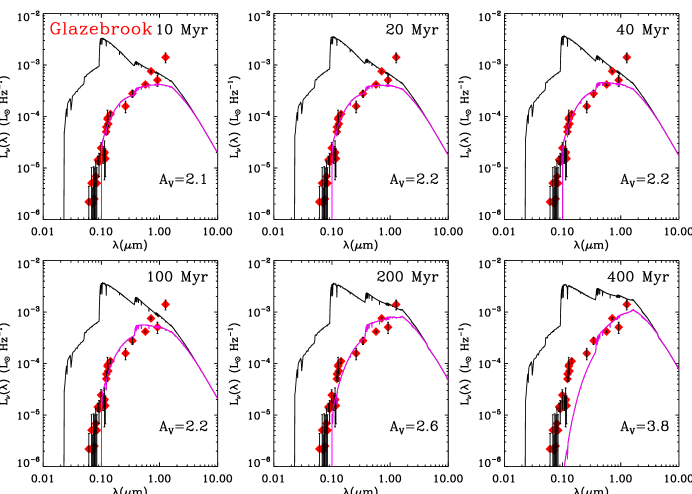
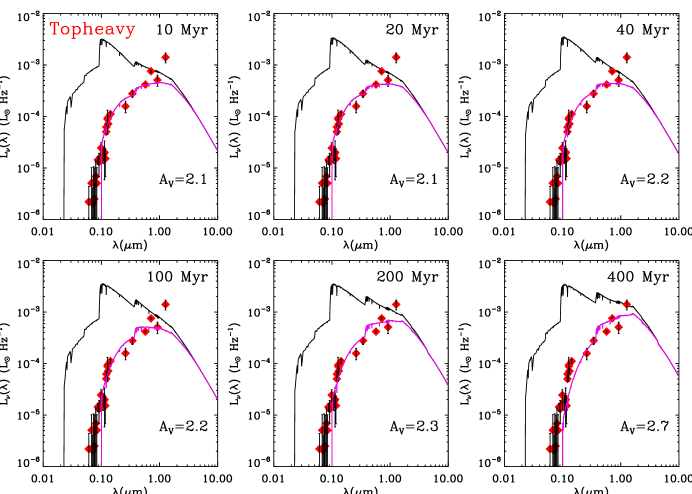
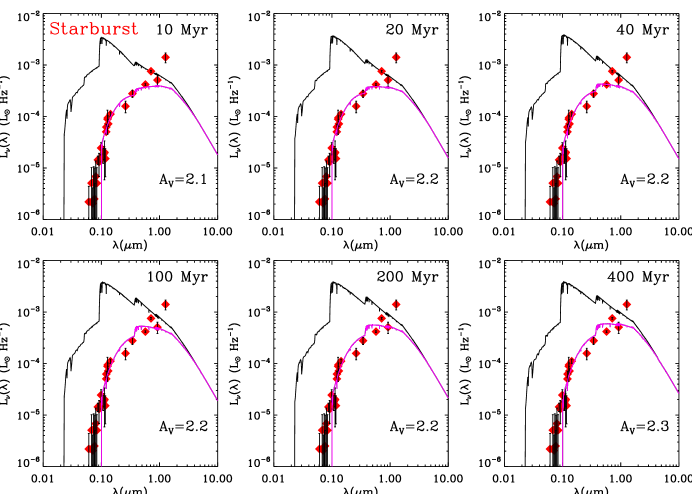
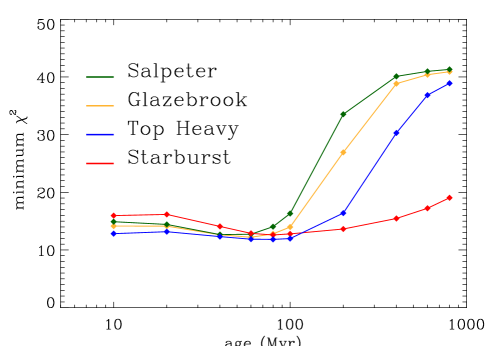
Figure 8 depicts the minimum of the fit of the attenuated spectra to the data as a function of galaxy age and stellar IMF. The figure shows that for each IMF there exists an age degeneracy for which the value of is essentially unchanged. This degeneracy is caused by the fact that the galaxy’s SED changes very little with time for the first Myr. The small changes that do occur are compensated for with small changes in the magnitude of the attenuation. This effect is exhibited in both the figures of the SEDs and that depicting the value with galactic age. For example, Figure 8 shows that the Salpeter and Glazebrook IMFs provide equally good fits to the observed UVNIR SED for ages up to Myr, and the Top Heavy IMF for ages up to Myr. The fits become significantly worse thereafter, an effect that is also clearly seen in Figures 6 and 7. The Starburst IMF provides an equally good fit to the observed spectrum at all epochs. Better fits to the observed spectra at later epochs can probably be obtained if we adopted a different extinction law, or a time-dependent extinction law that reflects the changing dust composition with time. Such changes would need to be consistent with the far-IR emission as well. Such detailed investigation into the extinction law (i.e. optical properties of the dust, and the physical distribution of the dust with respect to the radiation sources) is currently beyond the scope of this paper.
3.3. Stellar Mass Constraints of the Age: A Partial Lifting of the Degeneracy.
The ambiguity in stellar age can be partially lifted by considering the upper limits on the stellar mass in the galaxy. Capak et al. (2011) derived a stellar mass of , using the Maraston library of stellar SEDs (Maraston, 2005) and a galactic age of Myr. This age was inferred from the Keck II spectrum, assuming that all the star formation occurred in a single burst. Since we have shown that the UV spectrum cannot constrain the age of AzTEC–3, we prefer to use a weaker, but observationally determined, constraint on the stellar mass. Using kinematic CO data and limits on the angular size of the galaxy, Riechers et al. (2010) derived the values of , the mass of the gas (dominated by the molecular component), and , the dynamical mass of the galaxy. The dynamical mass is given by + , where and are, respectively, the mass in stars and dark matter. The dynamical mass offers therefore a strict upper limit on the stellar mass. Adopting a gas fraction ( /) of 0.5 (Riechers et al., 2010), we adopt an upper limit of on the stellar mass of the galaxy.
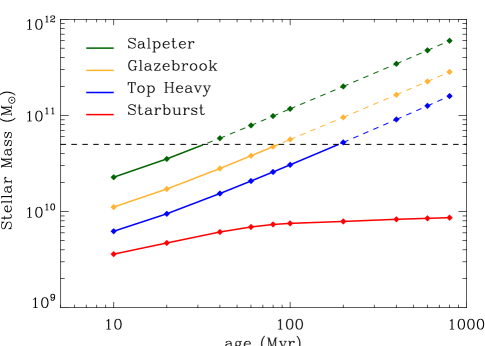
Since the mass of stars builds up at different rates for the different IMFs, this upper limit can provide useful constraints on the age of the galaxy. This effect is shown in Figure 9, which depicts the derived mass of stars as a function of the assumed age of AzTEC–3 for different stellar IMFs. Each symbol represents a distinct evolutionary sequence in which the SFR proceeded at a constant rate determined by the assumed galactic age and stellar IMF (see Figure 4). The Salpeter IMF requires the largest SFR, and is therefore the first to exceed this mass limit after Myr. The Glazebrook IMF exceeds this mass limit after Myr, and the Top Heavy IMF after Myr. The Starburst IMF is the most efficient one in producing the observed bolometric luminosity with a low SFR, and does not have a large population of low mass stars. Consequently, it does not exceed the adopted stellar mass limit within Gyr, the approximate age of the universe at that redshift.
4. DUST EVOLUTION: A NEW CONSTRAINT
ON GALACTIC PROPERTIES
The presence of of dust provides new additional constraints on the star formation rate and history of AzTEC–3. To demonstrate this effect we used the chemical evolution model described in Dwek & Cherchneff (2011) to follow the evolution of the dust for the four different astrophysical scenarios determined by the stellar IMFs and the upper limit of the mass of stars in the galaxy. For each IMF we adopted a galactic age, , taken to be equal to the last epoch before the mass of stars produced by the model violates the stellar mass limit. The ages are , 80, and 200 Myr for the Salpeter, Glazebrook, and Top Heavy IMFs, respectively (see Fig. 9). For the Starburst IMF we chose, quite arbitrary, a value of = 800 Myr. The models then assume that star formation proceeds at a constant rate of , 700, 500, and 300 yr-1, repectively (see Fig. 4).
We used a closed box model to follow the chemical evolution of AzTEC–3. The initial gas mass was chosen so that each model reproduced the inferred gas mass of at age . The chemical evolution model follows the changes in metallicities over timescales that are comparable to the main sequence lifetimes of the massive SN progenitors. Consequently, in addition to the delayed recycling of matter by long-lived AGB stars, the model also includes the delayed recycling of matter by massive stars. AGB yields for stars with masses below 8 were taken from Karakas & Lattanzio (2007) for a metallicity of . SN dust yields of massive stars were taken as an average between the zero and solar metallicity yields given by Heger & Woosley (2010) and Woosley & Heger (2007), respectively (see Table 5 for select stellar masses). Dust condensation efficiencies were chosen to be unity for AGB stars, and 0.5 for Type II SNe.
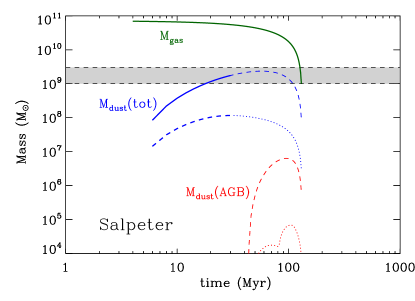
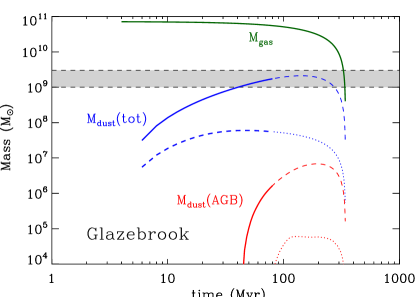
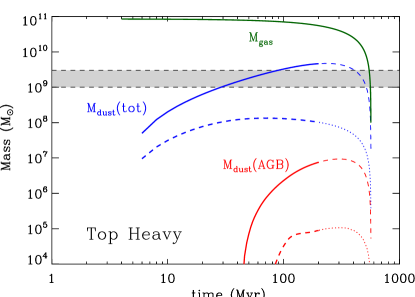
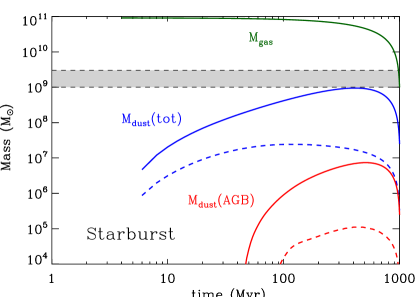
The results of our model calculations are shown in Figure 10. The green curve depicts the evolution of the gas mass which plummets when the constant SFR depletes all the gas (and dust) into stars. The blue curves depict the evolution of the total dust mass, which is the sum of the contribution from SNe and AGB stars. The AGB contribution is a small fraction of the total dust mass, and is shown separately by red curves. Models were run for two cases: the first ignores the effect of grain destruction, and is depicted by the solid blue curves; and the second takes the effect of grain destruction into account and is depicted by the dashed blue curves. The grain destruction rate was calculated by integrating the mass of dust destroyed as a function of shock velocity (Jones, 2004), over the evolution of a supernova remnant. The mass of dust destroyed by a single SN remnant during its lifetime is about (Dwek et al., 2007) and the grain destruction rate is given by . The bold section of each curve depicts the evolution over the time span allowed before the galaxy violates the upper limit on the stellar mass (see Fig. 9). The shaded region depicts the range of dust masses inferred from the far-IR observations.
The figure shows that when grain destruction is taken into account, none of the models is capable of producing the required dust mass at any time. With no grain destruction, all models depicted in the figure are capable of producing the required dust mass, albeit at different quantities. These idealized models can be considered as representatives of models in which rapid accretion in molecular clouds compensates for the mass of dust that is destroyed in the ISM. So the models show that rapid grain growth in clouds is an essential process for producing the inferred dust mass in AzTEC–3.
The model that is clearly most capable of producing the inferred dust mass is the one with the Top Heavy IMF. At the age of 200 Myr it produces more than the inferred upper range of the dust mass, thus allowing for a modest amount of grain destruction. It therefore does not require that the accretion in molecular clouds reconstitute all the dust that was destroyed in the more diffuse ISM. The Starburst model is just capable of producing the lower range of inferred dust mass at Myr, and requires that all the refractory elements returned by grain processing into the gas are quickly reaccreted onto surviving grains in molecular clouds. The models with a Salpeter or Glazebrook IMF fall in between these two models.
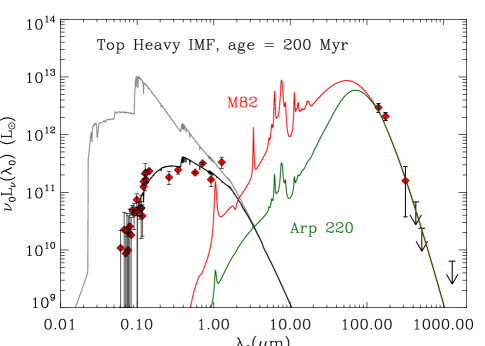
Figure 11 depicts the spectrum produced by stars generated by the most plausible scenario that satisfies both the stellar mass and the dust mass constraints of AzTEC–3: a galaxy with a Top Heavy IMF undergoing a constant SFR at a rate of 300 yr-1 over a timespan of 200 Myr, and allowing for over half of its dust to be destroyed. The stellar SED is attenuated by a Calzetti extinction law with . The intrinsic stellar spectrum is shown as the gray curve, and has a luminosity of , which lies between the luminosity of the two galactic templates, M82 and Arp 220 (see Table 2). This scenario is not unique, but the most plausible one among the models. A Top Heavy IMF was also the preferred scenario for the rapid and efficient production of dust in the early universe by Gall et al. (2011a) and Dunne et al. (2010).
5. A POPULATION III ORIGIN FOR THE DUST?
| Element/ | 20 | 50 | ||||
|---|---|---|---|---|---|---|
| Metallicity | ||||||
| 12C | 0.21 | 0.23 | 1.86 | 1.61 | ||
| 16O | 1.34 | 1.38 | 11.2 | 9.7 | ||
| 24Mg | 0.065 | 0.065 | 0.31 | 0.33 | ||
| 28Si | 0.0025 | 0.19 | 0.27 | 0.21 | ||
| 56Fe | 0.12 | 0.41 | 0.28 | |||
| Carbon dust | 0.21 | 0.23 | 1.86 | 1.61 | ||
| Silicate dust22The silicate dust mass was calculated assuming that all the Mg and Si are locked up in MgO and SiO2 dust precursors. | 0.11 | 0.52 | 1.10 | 1.00 | ||
| Iron dust | 0.0 | 0.12 | 0.41 | 0.28 | ||
| Total dust33Total dust masses listed assume a 100 percent condensation efficiency. | 0.32 | 0.87 | 3.4 | 2.9 | ||
Population III (Pop III) stars, the first population of stars being born out of a pristine, zero metallicity gas, may also be important contributors to the dust in these young galaxies (Nozawa et al., 2003, 2009; Todini & Ferrara, 2001; Cherchneff & Dwek, 2010). They are believed to be massive (Bromm & Larson, 2004), and supported by radiation pressure at the Eddington luminosity:
| (1) |
Consider a population of massive Pop III stars all of identical mass , and let be the total bolometric output of this stellar population. To maintain a steady abundance of such stars, they have to be created at a rate given by:
| (2) |
where , their main sequence lifetime, is determined by the time it takes to radiate all the energy released in the production of helium and heavy elements at the Eddington luminosity. It is independent of stellar mass, and given by:
| (3) |
The SFR needed to maintain the observed luminosity is independent of the stellar mass and given by yr-1. The rate of dust production is given by:
| (4) |
where is the amount of dust produced in these objects.
Dust formation in massive Pop III stars has only been calculated for 170 stars (Nozawa et al., 2003; Cherchneff & Dwek, 2010). Such a Pop III star will have a luminosity of . The dust yield depends on the whether the ejecta maintains its stratified compositional structure or becomes completely mixed, and ranges from to , for unmixed and fully mixed ejecta, respectively. The total mass of dust produced at time , assuming no grain destruction, is given by:
| (5) |
where the range of ages reflects the uncertainty in the dust yield of such stars. The time needed to create an average of dust by 170 Pop III stars is therefore Myr. This timescale is significantly longer than their main sequence lifetime, and too long to maintain a pristine reservoir of gas to feed the formation of metal-free stars. We therefore conclude that the massive amount of dust seen in AzTEC–3 cannot have been produced by a burst of Pop III stars that are currently giving rise to the observed far-IR luminosity of the galaxy.
6. DISCUSSION
Deriving the physical properties of high redshift galaxies from their spectra is an important goal for understanding their origin and evolution. In the absence of perfect and complete information, these derived physical properties are not unique, allowing for different evolutionary scenarios to explain the observations.
In this paper we explore a new method that can, in principle, discriminate between different evolutionary scenarios. The method requires that the mass of dust inferred from the far-IR emission to be present in these galaxies be produced within an allotted time span imposed by other observations. We applied our method to the analysis of the ultraluminous submillimeter galaxy AzTEC–3. The basic observations available to constrain the models are the high-resolution UV-optical spectrum, the UV to millimeter SED, and the CO transitions that were detected from this object.
A fundamental observed quantity is the bolometric luminosity of the galaxy which in AzTEC–3 is dominated by the far-IR emission, and can be used to infer the SFR of the galaxy. However, converting to a SFR requires knowledge of the stellar IMF and the age of the galaxy, since for a constant SFR and given IMF, the bolometric luminosity increases with time because of the contribution of long-lived low mass stars to the emission.
The IR region of the spectrum can be used to derive the mass of dust giving rise to the emission. The dust mass depends on the dust composition and the dust temperature distribution, both unknown quantities. Estimates of the dust mass can be derived for pure dust compositions (graphite, amorphous carbon, or silicates), based on dust models for the Milky Way. Alternatively, the dust mass can also be estimated by fitting the observed SED with that of known galaxies for which the dust mass has been derived from detailed models.
The CO emission spectrum can be used to derive the dynamical mass of the galaxy and the mass of molecular gas. Both quantities are uncertain. The dynamical mass estimate depends on the basic premise that the system has relaxed to a Keplerian disk, and the determination of the gas mass depends on the uncertain X-factor that converts the CO line intensity to an H2 mass. Without any further assumptions, only an upper limit can be obtained for the stellar mass in this galaxy.
The high-resolution UV spectrum can be used to determine the age of the system. Massive young stars exhibit characteristic P-Cygni profiles. The presence of these features in the spectrum can therefore be used to determine the age of the system. For an instantaneous burst of star formation, these features disappear as these massive stars die off within Myr. So their presence can be used to estimate the age. When star formation is a continuous process, the massive stars are always present, and the strengths of the features relative to the continuum changes then much more gradually. Therefore, the age inferred from such spectrum will be much longer than that inferred for an instantaneous burst. From our simulations, assuming a constant SFR, we find that the UV spectrum cannot discriminate between systems that are between to 400 Myr old, the relevant age limits for AzTEC–3.
The bolometric luminosity of AzTEC–3 lies between 0.6 to , and to be definitive we adopted a value of . For the dust mass we adopted a value of . We adopted a very conservative upper limit of on the stellar mass, based on the estimated dynamical and gas mass from this object.
Using these basic constraints, , , and , we constructed models to follow the evolution of the galaxy’s SED, stellar, and dust content as a function of time for 7 different stellar IMFs. Viable models were those that were able to produce the inferred mass of dust before the concurrently produced mass in stars exceeded the mass limit. The results of these models are depicted in Figure 10, and described in Section 4.
The results of the paper can be briefly summarized as follows:
-
1.
Most of the dust giving rise to the far-IR emission from AzTEC–3 must have been grown in molecular clouds. In the Milky Way, the need for grain growth in molecular clouds to explain the abundance of dust was first pointed out by Dwek & Scalo (1980), and more recently by Zhukovska et al. (2008) and Jones & Nuth (2011). Michałowski et al. (2010a) argued that growth in molecular clouds is the main source of dust in high-redshift () quasars. In this paper we have extended this point to the ultraluminous starburst AzTEC–3 using detailed chemical evolution models.
-
2.
There is a correlation between grain destruction and the required growth in molecular clouds. At the peak of its dust production, which occurs at Myr, the Top Heavy model can form the inferred dust mass in AzTEC–3 without resorting to grain growth in the ISM, but with a significantly reduced (compared to the Milky Way) efficiency of grain destruction. At earlier epochs grain growth in molecular clouds must account for a significantly larger fraction of the dust mass. In the Starburst model any grain destruction must be rapidly balanced by accretion in the ISM. The Salpeter and Galzebrook IMFs are less efficient in producing dust than the Top Heavy one. They can afford only little grain destruction, and therefore require a large fraction of their dust to be of interstellar origin.
-
3.
The model with the Top Heavy IMF is the most efficient one for producing the dust in AzTEC–3, and therefore the more favorable model for the origin of the dust in this galaxy. Taking the galaxy’s age to be 200 Myr, the longest time allowed by the stellar mass constraint, the constant SFR required to provide the observed bolometric luminosity and the required dust mass is yr-1. The inferred constant SFR is significantly smaller and the age is significantly longer than the previous estimates of yr-1and Myr, respectively, assuming a single burst of star formation.
-
4.
The Top Heavy model is, however, not unique. A clear discrimination between the different models requires a significant reduction in the uncertainties of the measured quantities. For example, a better determination of the stellar mass may have resulted in a lower value than the upper limit adopted in this paper, ruling out the models using the Salpeter or the Glazebrook functions to characterize the stellar IMF.
-
5.
Finally, Population III stars could not have produced both the currently observed luminosity and dust mass in AzTEC–3.
The studies presented here illustrate the power of multiwavelength observations and the simultaneous use of spectral, stellar, and dust mass constraints for determining the properties of high-redshift galaxies. Our studies also highlight the need for more observational data and improved model input parameters.
Acknowledgements ED acknowledges helpful discussions with Dominik Riechers. GISMO millimeter observations used in the analysis were supported through NSF grants AST-0705185 and AST-1020981. We also acknowledge useful comments by the referee that helped clarify the paper.
References
- Bromm & Larson (2004) Bromm, V. & Larson, R. B. 2004, ARA&A, 42, 79
- Calzetti et al. (2000) Calzetti, D., Armus, L., Bohlin, R. C., et al. 2000, ApJ, 533, 682
- Capak et al. (2011) Capak, P. L., Riechers, D., Scoville, N. Z., et al. 2011, Nature, 470, 233
- Cherchneff & Dwek (2010) Cherchneff, I. & Dwek, E. 2010, ApJ, 713, 1
- Coppin et al. (2006) Coppin, K., Chapin, E. L., Mortier, A. M. J., et al. 2006, MNRAS, 372, 1621
- Dunne et al. (2010) Dunne, L., Gomez, H., da Cunha, E., et al. 2010, ArXiv e-prints
- Dwek & Cherchneff (2011) Dwek, E. & Cherchneff, I. 2011, ApJ, 727, 63
- Dwek et al. (2007) Dwek, E., Galliano, F., & Jones, A. P. 2007, ApJ, 662, 927
- Dwek & Scalo (1980) Dwek, E. & Scalo, J. M. 1980, ApJ, 239, 193
- Elvis et al. (2002) Elvis, M., Marengo, M., & Karovska, M. 2002, ApJ, 567, L107
- Fioc & Rocca-Volmerange (1997) Fioc, M. & Rocca-Volmerange, B. 1997, A&A, 326, 950
- Gall et al. (2011a) Gall, C., Andersen, A. C., & Hjorth, J. 2011a, A&A, 528, A13+
- Gall et al. (2011b) Gall, C., Andersen, A. C., & Hjorth, J. 2011b, A&A, 528, A14+
- Galliano et al. (2008) Galliano, F., Dwek, E., & Chanial, P. 2008, ApJ, 672, 214
- Heger & Woosley (2010) Heger, A. & Woosley, S. E. 2010, ApJ, 724, 341
- Jones (2004) Jones, A. P. 2004, in ASP Conf. Ser. 309: Astrophysics of Dust, ed. A. N. Witt, G. C. Clayton, & B. T. Draine, 347–+
- Jones & Nuth (2011) Jones, A. P. & Nuth, J. A. 2011, A&A, 530, A44+
- Karakas & Lattanzio (2007) Karakas, A. & Lattanzio, J. C. 2007, Publications of the Astronomical Society of Australia, 24, 103
- Kennicutt (1998) Kennicutt, Jr., R. C. 1998, ARA&A, 36, 189
- Kovács et al. (2006) Kovács, A., Chapman, S. C., Dowell, C. D., et al. 2006, ApJ, 650, 592
- Kovács et al. (2010) Kovács, A., Omont, A., Beelen, A., et al. 2010, ApJ, 717, 29
- Leitherer et al. (2010) Leitherer, C., Ortiz Otálvaro, P. A., Bresolin, F., et al. 2010, ApJS, 189, 309
- Leitherer et al. (1999) Leitherer, C., Schaerer, D., Goldader, J. D., et al. 1999, ApJS, 123, 3
- Maiolino et al. (2004) Maiolino, R., Schneider, R., Oliva, E., et al. 2004, Nature, 431, 533
- Maraston (2005) Maraston, C. 2005, MNRAS, 362, 799
- Michałowski et al. (2010a) Michałowski, M. J., Murphy, E. J., Hjorth, J., et al. 2010a, A&A, 522, A15+
- Michałowski et al. (2010b) Michałowski, M. J., Watson, D., & Hjorth, J. 2010b, ApJ, 712, 942
- Morgan & Edmunds (2003) Morgan, H. L. & Edmunds, M. G. 2003, MNRAS, 343, 427
- Nozawa et al. (2009) Nozawa, T., Kozasa, T., Umeda, H., et al. 2009, in Astronomical Society of the Pacific Conference Series, Vol. 414, Cosmic Dust - Near and Far, ed. T. Henning, E. Grün, & J. Steinacker, 247–+
- Nozawa et al. (2003) Nozawa, T., Kozasa, T., Umeda, H., Maeda, K., & Nomoto, K. 2003, ApJ, 598, 785
- Riechers et al. (2010) Riechers, D. A., Capak, P. L., Carilli, C. L., et al. 2010, ApJ, 720, L131
- Robson et al. (2004) Robson, I., Priddey, R. S., Isaak, K. G., & McMahon, R. G. 2004, MNRAS, 351, L29
- Scott et al. (2008) Scott, K. S., Austermann, J. E., Perera, T. A., et al. 2008, MNRAS, 385, 2225
- Spergel et al. (2007) Spergel, D. N., Bean, R., Doré, O., et al. 2007, ApJS, 170, 377
- Todini & Ferrara (2001) Todini, P. & Ferrara, A. 2001, MNRAS, 325, 726
- Valiante et al. (2009) Valiante, R., Schneider, R., Bianchi, S., & Andersen, A. C. 2009, MNRAS, 397, 1661
- Vázquez & Leitherer (2005) Vázquez, G. A. & Leitherer, C. 2005, ApJ, 621, 695
- Weiß et al. (2009) Weiß, A., Kovács, A., Coppin, K., et al. 2009, ApJ, 707, 1201
- Woosley & Heger (2007) Woosley, S. E. & Heger, A. 2007, Phys. Rep., 442, 269
- Younger et al. (2007) Younger, J. D., Fazio, G. G., Huang, J.-S., et al. 2007, ApJ, 671, 1531
- Zhukovska et al. (2008) Zhukovska, S., Gail, H., & Trieloff, M. 2008, A&A, 479, 453