Young, UV-bright stars dominate dust heating in star forming galaxies
Abstract
In star forming galaxies, dust plays a significant role in shaping the ultraviolet (UV) through infrared (IR) spectrum. Dust attenuates the radiation from stars, and re-radiates the energy through equilibrium and non-equilibrium emission. Polycyclic aromatic hydrocarbons (PAH), graphite, and silicates contribute to different features in the spectral energy distribution; however, they are all highly opaque in the same spectral region – the UV. Compared to old stellar populations, young populations release a higher fraction of their total luminosity in the UV, making them a good source of the energetic UV photons that can power dust emission. However, given their relative abundance, the question of whether young or old stellar populations provide most of these photons that power the infrared emission is an interesting question. Using three samples of galaxies observed with the Spitzer Space Telescope and our dusty radiative transfer model, we find that young stellar populations (on the order of 100 million years old) dominate the dust heating in star forming galaxies, and old stellar populations (13 billion years old) generally contribute less than 20% of the far-IR luminosity.
Subject headings:
ISM: dust, extinction — Galaxies: star formation — Galaxies: stellar content — Methods: numerical — Methods: statistical1. INTRODUCTION
The infrared radiation from most star-forming galaxies is dominated by emission from dust grains heated by absorbed stellar energy. Dust emission is powered by absorption of radiation from ionizing and non-ionizing stars. Dust is most efficient at absorbing photons in the ultraviolet (UV) as the relative optical depth of dust is the highest in the UV (Gordon et al., 2003). Only early type (O and B) stars produce significant amounts of UV photons; however, these hot massive stars have short lifetimes (less than 100 million years) and are formed in relatively small numbers compared to less massive, less luminous, and cooler stars that produce very few UV photons. Given the initial mass function and evolutionary history, this implies that star-forming galaxies have a small mass fraction of UV bright, young stars as compared to UV faint, old stars. Thus, the question arises: which population of stars dominates the dust heating in star-forming clouds? The less numerous but much brighter in the UV young stars ( Myr) or the numerous but much fainter in the UV old stars? How does this answer change when we consider the emission at specific IR wavelengths?
The majority of the IR energy from star-forming galaxies is emitted at far-IR (100 µm) wavelengths. Historically, this far-IR emission has been identified as infrared cirrus emission from dust heated by non-ionizing populations (Helou, 1994), which are older than 10 Myr. Lonsdale Persson & Helou (1987) interpreted the far-IR emission from spiral disks in terms of two thermal components with different temperatures and found that the cirrus component contributes more than half of the total far-IR flux. However, as old stars emit very few of the UV photons that power dust emission, it is possible that UV-bright young stars could dominate cirrus emission. For example, a small number of young stars embedded in a large optically thin cloud can result in a dilute radiation field, cold dust temperature and therefore cold cirrus emission.
Star formation rate (SFR) indicators are important observational probes of the star formation histories of galaxies. They are usually single-band or wavelength-integrated quantities that are presumed to trace a specific regime of recent star formation in a region or galaxy (Kennicutt, 1998). The most common SFR indicators include the H flux (tracing unobscured ionizing stars, Myr), UV (tracing unobscured ionizing and UV-bright, non-ionizing stars, Myr), and total infrared (TIR, tracing obscured star formation).
The UV and H flux are heavily attenuated by dust, with a typical extinction of 0-4 mag and 0-2 mag respectively (Kennicutt et al., 2009). Since the UV and H flux only trace the stellar light unabsorbed by dust, an accurate estimation of star formation activity requires a correction factor to account for the effect of dust. For starburst galaxies, emission-line diagnostics and UV colors may be used to such purpose, but they are often difficult to obtain or highly uncertain (Kennicutt et al., 2009). An alternative way is to look at the IR flux, which accounts for the energy missing in the UV and the optical (Calzetti et al., 2007). Kennicutt et al. (2009) found that the combination of H and TIR provides a robust SFR measurement. Leroy et al. (2008) and Bigiel et al. (2008) used the 24 µm flux combined with the GALEX far-UV to study the SFR in nearby galaxies.
TIR alone as a SFR indicator suffers from a number of problems. It does not trace unobscured star formation, and for the typical amount of dust in galaxies, a non-trivial amount of energy escapes in the UV and optical. Recalling the “cirrus emission” problem, TIR can only work well as an SFR indicator if the total infrared emission correlates well with newly formed stars ( Myr), instead of old stars that formed long ago. Therefore, understanding whether young stars or old stars dominate the TIR dust emission is an important step in interpreting the TIR SFR indicator. In addition, TIR is often integrated over a sparsely sampled wavelength interval in intermediate or high-redshift galaxies, which may introduce many uncertainties (Calzetti et al., 2007). Sauvage & Thuan (1992) found a systematic decrease of the L(far-IR)/L(H-alpha) ratio from early- to late-type spirals, and suggested a systematically varying cirrus fraction as the explanation, accounting for 86 percent of L(far-IR) for Sa galaxies to about 3 percent for Sdm galaxies. Xu & Helou (1996) also found that the heating of the diffuse dust is dominated by optical radiation from stars at least a billion years old in M31. With these results, it would be important to subtract the cirrus emission from the total infrared luminosity in the calculation of star formation rate.
In the simplest model, dust emission can be thought of as modified blackbody radiation at a certain temperature plus emission features. However, equilibrium dust emission is not the only possible emission path. Duley (1973) pointed out that non-equilibrium dust emission should also be important and this has been confirmed observationally (e.g. Sellgren, 1984). Upon the absorption of an energetic photon, a large molecule or small dust grain can attain a very high temperature for a short period of time before it cools. In many situations, if non-equilibrium heating is not considered, the observed mid-IR luminosity implies an unrealistically high equilibrium dust temperature. While older stars can rarely excite dust grains to produce non-equilibrium heating, this type of heating clearly dominates the mid-IR emission from star-forming galaxies.
Recent interesting results from the Herschel observatory have begun exploring the problem of the source of dust heating using the far-IR and sub-mm. Specifically, in a study of M81, Bendo et al. (2010) found that the far-IR to sub-mm (160-500 µm) emission is dominated by dust heated by evolved stars while the 70 µm emission is caused by the active galactic nucleus and young stars in star forming regions. From a study of 51 nearby galaxies, Boselli et al. (2010) found that the warm dust (f60/f100) correlates with star formation, while cold dust (f350/f500) anti-correlates. Our study does not probe cold dust in the submillimeter range, but we plan to do so in a later paper.
In this paper, we examine the relationship between IR luminosity and the age of stellar populations. Through the use of a self-consistent radiative transfer and dust emission model, observed dust properties, and stellar and dust geometries designed to represent galactic environments, we compare our results to observed galaxies (the SINGS sample, Kennicutt et al. (2003), the starburst galaxies in Engelbracht et al. (2008), and the LVL sample, Dale et al. (2009)) and attempt to give a quantitative answer on the age of the stellar populations that dominates the IR emission in star forming galaxies.
2. METHOD
2.1. Model
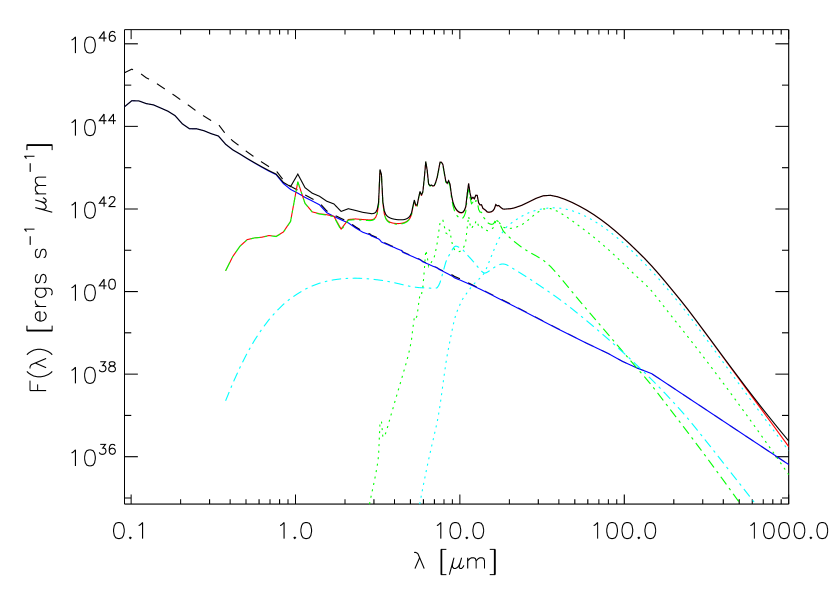
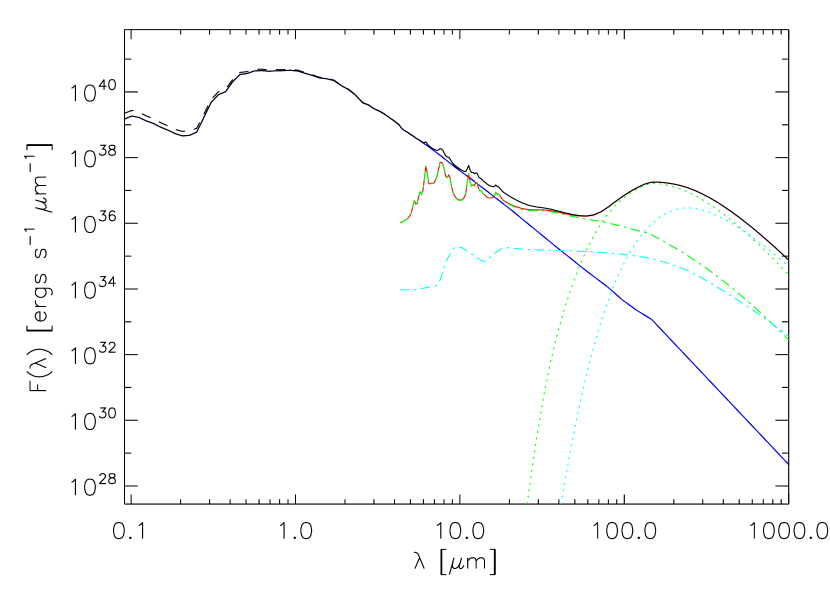
DIRTY (DustI Radiative Transfer, Yeah!) is a self-consistent Monte Carlo radiative transfer model (Gordon et al., 2001; Misselt et al., 2001). Due to its Monte Carlo nature, it allows for arbitrary dust and stellar distributions. It computes emission from the three standard dust grain components (Weingartner & Draine, 2001) - carbon grains, silicates, and polycyclic aromatic hydrocarbons (PAH). One of the key strengths of DIRTY is that it is completely self-consistent. It avoids assumptions whenever possible; the radiation field is directly calculated from radiative transfer, instead of the usual method of scaling the standard solar neighborhood radiation field (Draine, 2009). The initial radiation field is obtained from an external spectral evolutionary synthesis model. Both equilibrium and non-equilibrium emission are calculated from the radiation field and their contributions to the radiation field itself are iteratively taken into account. DIRTY has been used to model a variety of situations, for example, the dusty starburst nucleus of M33 (Gordon et al., 1999) and the general behavior of galaxies (Witt & Gordon, 2000). Figure 1 shows examples of global spectral energy distributions (SED) from DIRTY.
| Parameter | Values |
|---|---|
| Optical depth at V band () | 0.2 - 5.0 |
| Stellar age (Myr) | 1 - 13000 |
| Radius (pc) | 100 - 10000 |
| Dust model | Milky Way dust (with , ) and SMC Bar dust from Weingartner & Draine (2001) |
| Stellar model | PEGASE 2 (Fioc & Rocca-Volmerange, 1997) with instantaneous bursts |
| Metallicity | Solar (0.02) and 1/5 Solar (0.004) |
Young and old galaxies are best described by different dust geometries, which can lead to different dust absorption efficiencies and effective optical depths (Witt et al., 1992). Following the notation of Witt & Gordon (2000), we use the CLOUDY and SHELL geometries. In the CLOUDY geometry, stars are uniformly distributed in a spherical volume, and a dusty core is located within 0.69 times of the radius of the stellar distribution; whereas in the SHELL geometry, stars extend only to 0.3 times of the outer radius and are surrounded by a concentric shell of dust from 0.3 to 1.0 of the outer radius. See Figure 1 of Witt & Gordon (2000) for a graphical description of the CLOUDY and SHELL geometries.
For both geometries, the stellar density per unit volume is constant. The CLOUDY model reproduces the general characteristics of old stellar populations in galaxies with strong central bulges, where the majority of stars are found outside of the dust. The SHELL model mimics a young star cluster with surrounding clouds. It has been shown that starbursts require a SHELL geometry to explain various color-color plots (Gordon et al., 1997) and the attenuated-to-intrinsic ratios of hydrogen lines (Calzetti, 2001). In this study, we use SHELL for stars that are 100 Myr old or younger and CLOUDY for older ones. Other model parameters can be found in Table 1.
Witt & Gordon (1996) found that it is necessary to model interstellar dust as a multi-phase medium. To achieve this, a small fraction (15 % total filling factor) of clumps of high density dust is randomly placed into a field of low density dust with 100 times lower density in the global dust geometries mentioned previously. Without the clumpiness, the effectiveness of dust absorption would be overestimated. In this study, we exclusively use clumpy dust distributions. The optical depth averaged over all sightlines (from infinity to the center of the geometry) is normalized to the desired value of .
We use the spectral evolutionary synthesis (SES) model PEGASE 2 (Fioc & Rocca-Volmerange, 1997) as the stellar input to our model. We model starbursts of various ages with solar and 1/5 solar metallicity and the Padova evolutionary tracks. An old galaxy may contain both old stellar populations and young stellar populations, although the latter is expected to be much less abundant considering that the typical timescale for gas depletion is about 3 Gyr (Pflamm-Altenburg & Kroupa, 2009). The time-dependent profile of star formation could be modeled as an exponentially decaying burst (Searle et al., 1973; Conti et al., 2003). However, since we want to model the characteristics (the luminosity ratios) of stellar populations at a certain age, we use instantaneous starbursts. To bracket the possible real world scenarios, we model the extreme cases of very young (1 Myr) and very old (13 Gyr) starburst populations. Gas continuum and emission of recombination lines, as calculated by PEGASE, are included. See Gordon et al. (1999) for a detailed discussion on how we use spectral evolutionary synthesis models with our dusty radiative transfer model.
The dust extinction curve for stars in the Milky Way (MW), Small and Large Magellanic Clouds (SMC and LMC) are found to have overall similar shapes with significant variation in the UV (Gordon et al., 2003). There are two distinct features that differentiate the different types of dust. The first one is the 2175 Å bump, which is found to vary in strength on average between the MW diffuse ISM/LMC general (strong bump), LMC2 (near 30 Dor)/SMC Wing (weak bump), and SMC Bar (no bump). The second is the far UV rise, which generally varies in strength inversely with the 2175 Å bump. Dust properties can be influenced by star forming activity and metallicity. In particular, Gordon et al. (1997) found that the SMC Bar type dust (lacking a 2175 Å bump) describes the starburst galaxies better than either the LMC or MW type dust. From the GMASS survey, Noll et al. (2009) found that there is a wide range of UV dust properties, including those that are intermediate between SMC Bar and LMC2 type dusts. Modeling results show that the type of dust can affect the strength of PAH features (Draine et al., 2007), which in turn affects the IR observations. As a result, it is important to choose an appropriate dust type for our study, and to explore the sensitivity of our results to the dust type. To span the whole range of known dust properties, we use SMC Bar type dust and Milky Way type dust. For a fair comparison, we use the dust models of Weingartner & Draine (2001) for both the SMC and Milky Way type dust.
Radius and stellar mass are not independent dimensions in our model. Since the radiation intensity drops as the square of the radius, an increase in the model radius by a factor of can be compensated by an increase in the stellar mass by a factor of . The two cases give the same radiation intensity in each grid cell in the model, and therefore the same dust temperature. The resultant SEDs will have the same shape, with the only difference being the lower overall luminosity in the latter case. This has been confirmed by test runs of our model; for example, a stellar population with solar masses and 10 kpc radius gives the same SED as the one with solar masses and 1 kpc radius, when the luminosity in the latter is scaled up by a factor of 100 (all the other parameters are unchanged). Since our study is based on the ratios of luminosities, a larger, more luminous galaxy and a smaller, dimmer galaxy with same radiation field intensity give the same result.
Due to the Monte Carlo and iterative nature of our model, the run time varies significantly depending on the parameters. The fastest models take about 4 CPU hours on a 2.33 GHz Intel Xeon processor, while the slowest ones often need about 2 days. The average run time is about 20 hours. Each model uses a single thread and we launch multiple processes in parallel to utilize all the CPU cores in multi-core processors. We iterate the radiative transfer and dust emission processes until the global energy conservation error is within 5%. The resultant uncertainty of flux at each wavelength is usually within 1%.
2.2. Luminosity Ratios
To compare the modeled SED with infrared observations, we calculate the luminosities in the IRAC and MIPS bands with calibrated response functions (Hora et al., 2008; Engelbracht et al., 2007; Gordon et al., 2007; Stansberry et al., 2007). Since the galaxies in our sample have a very wide range of total luminosity, we study luminosity ratios instead of raw luminosities. We normalize the mid- and far-IR luminosities by the IRAC1 (3.6 µm) luminosity, and the resulting ratios are the characteristics of the dust and stellar populations that we compare with our model. These luminosity ratios are measures of the efficiency of the stellar and dust distribution at producing radiation in a certain wavelength regime (relative to IRAC1). At 3.6 µm, the IRAC1 band is only mildly contaminated by dust emission (e.g., the 3.3 µm aromatic/PAH feature), and is less affected by dust extinction than the shorter wavelengths. The IRAC1 luminosity can be considered as a proxy of stellar luminosity and an approximate measure of mass, although the mass-to-light ratio depends on their underlying stellar populations and the infrared colors (Bell & de Jong, 2001). The combination of the PEGASE SES and DIRTY models account for stellar age, dust emission, and absorption self-consistently. As we see in later discussions, the luminosity ratios are robust against changes in radius or total stellar luminosity.
2.3. Data
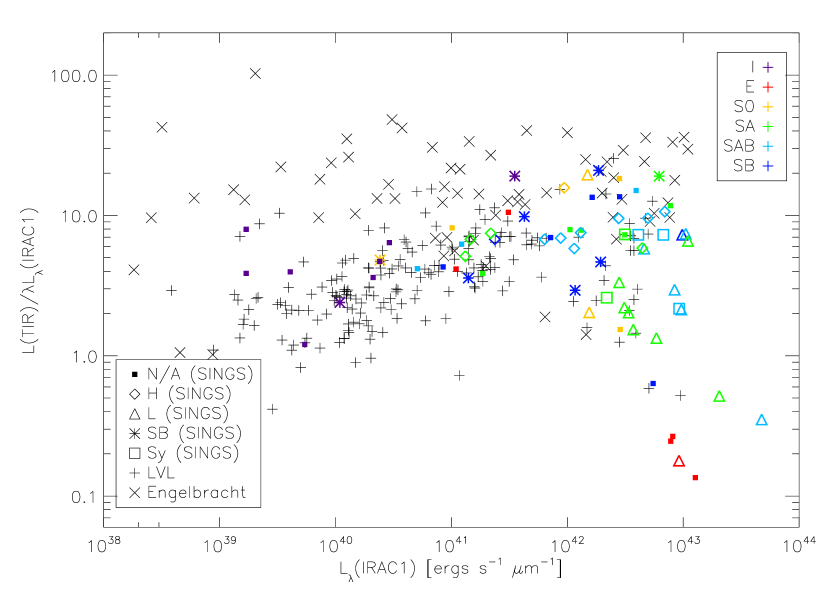
From the SINGS (Spitzer Nearby Galaxies Survey) dataset (Kennicutt et al., 2003), we have good measurements of the UV, visible and IR fluxes for a number of nearby galaxies. They range from spiral to elliptical to irregular galaxies, and are a good representation of a wide range of galaxies. We removed 4 galaxies (M81 Dwarf A, NGC 3034, Holmberg IX, and DDO 154) for which the IRAC or MIPS band fluxes are not well measured (either an upper limit or saturated). For the remaining 71 galaxies, we calculate the luminosity from the flux data from Dale et al. (2007) and distance data from Kennicutt et al. (2003). The metallicity is calculated from the average of the “high” and “low” oxygen abundance values from Moustakas et al. (2010); the same method was used in Calzetti et al. (2010). Figure 2 shows the wide range of galaxies types in the SINGS sample, where we have used Eq. 22 from Draine & Li (2007) to compute .
To expand the range of galaxies studied, we include the starburst galaxies from Engelbracht et al. (2008) and the Local Volume Legacy (LVL) sample from Dale et al. (2009). The starburst galaxies have a higher fraction of recent star formation and UV-bright young stars. Their data include imaging and spectroscopy from the Spitzer Space Telescope, as well as ground-based near-infrared imaging. The Engelbracht sample consists of 66 local star forming galaxies of which 65 have high quality IRAC and MIPS data available; UM 420 was dropped from our sample because the MIPS data were not available. For this sample we take all flux, distance and metallicity values from Engelbracht et al. (2008). On the other hand, the LVL is a statistically unbiased sample of 258 galaxies in the local universe out to 11 Mpc which consists mainly of dwarf galaxies, and we take flux and distance values from Dale et al. (2009) and metallicity values from Marble et al. (2010). We removed galaxies without good IRAC and/or MIPS measurements (no data or flux available only as an upper bound) and galaxies without metallicity data, and arrived at a sample of 194 galaxies.
| Dataset | Count | IRAC2/IRAC1 | IRAC3/IRAC1 | IRAC4/IRAC1 | MIPS24/IRAC1 | MIPS70/IRAC1 | MIPS160/IRAC1 |
|---|---|---|---|---|---|---|---|
| SINGS | 71 | 0.433 0.073 | 0.411 0.274 | 0.438 0.362 | 0.110 0.151 | 0.131 0.122 | 0.049 0.031 |
| H II nuclei | 13 | 0.469 0.147 | 0.567 0.402 | 0.604 0.329 | 0.140 0.181 | 0.141 0.058 | 0.066 0.017 |
| Starburst nuclei | 9 | 0.441 0.036 | 0.499 0.314 | 0.562 0.457 | 0.249 0.273 | 0.218 0.181 | 0.053 0.032 |
| LINER/Seyfert nuclei | 21 | 0.408 0.029 | 0.317 0.127 | 0.307 0.211 | 0.055 0.077 | 0.086 0.128 | 0.037 0.028 |
| Others | 28 | 0.434 0.045 | 0.381 0.244 | 0.419 0.406 | 0.091 0.093 | 0.133 0.105 | 0.049 0.034 |
| Type I | 9 | 0.465 0.041 | 0.282 0.186 | 0.226 0.288 | 0.138 0.224 | 0.145 0.121 | 0.035 0.019 |
| Type E | 6 | 0.397 0.034 | 0.232 0.163 | 0.188 0.271 | 0.050 0.095 | 0.061 0.104 | 0.014 0.021 |
| Type S0 | 7 | 0.507 0.200 | 0.616 0.622 | 0.594 0.630 | 0.245 0.262 | 0.247 0.207 | 0.047 0.036 |
| Type SA | 19 | 0.420 0.035 | 0.418 0.208 | 0.451 0.325 | 0.074 0.116 | 0.100 0.087 | 0.053 0.031 |
| Type SAB | 18 | 0.418 0.023 | 0.434 0.150 | 0.515 0.294 | 0.082 0.064 | 0.113 0.072 | 0.059 0.026 |
| Type SB | 12 | 0.431 0.041 | 0.431 0.255 | 0.495 0.342 | 0.137 0.143 | 0.164 0.143 | 0.059 0.033 |
| Engelbracht | 65 | 0.518 0.184 | 0.578 0.395 | 0.738 0.632 | 0.636 0.612 | 0.439 0.345 | 0.094 0.163 |
| LVL | 194 | 0.436 0.037 | 0.287 0.158 | 0.237 0.225 | 0.061 0.104 | 0.097 0.076 | 0.033 0.022 |
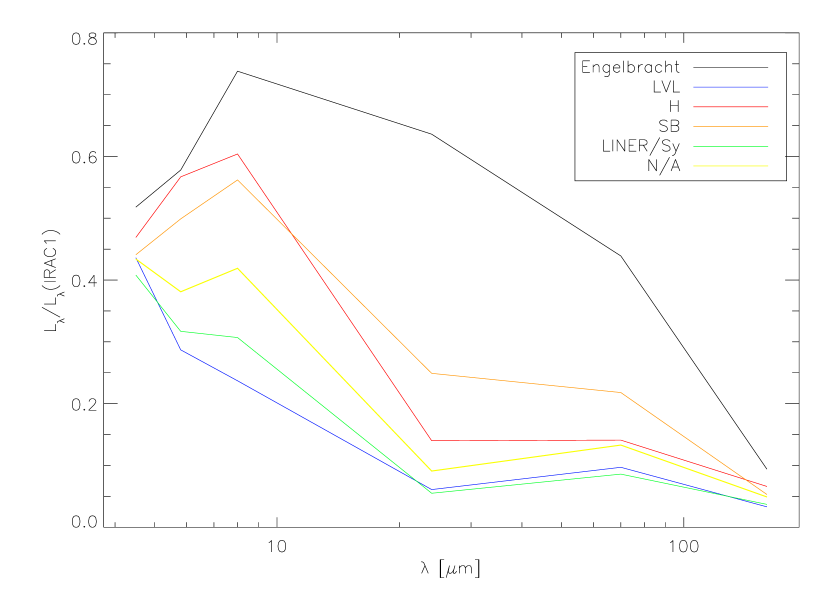
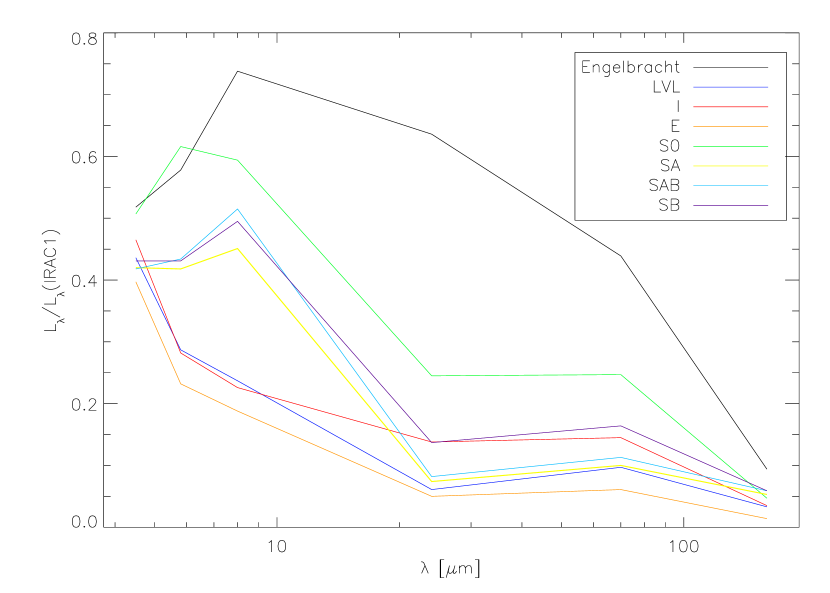
In Table 2 we list the statistics of the band ratios of our sample. The SINGS galaxies are classified into different nuclei and morphological types according to Kennicutt et al. (2003). We keep the Engelbracht sample (as a group of starburst galaxies) and the LVL sample (representing the dwarf galaxies) separate from the SINGS’ categories for a clear statistical comparison. Each number in the table is the average (plus or minus the standard deviation) of the ratio of the given band luminosity to the IRAC1 luminosity. Figure 3 shows the table entries graphically. Among the SINGS galaxies, the starburst and H II nuclei tend to have higher luminosity ratios while those without active nuclei tend to have lower luminosity ratios. Galaxies with Seyferts (Sy) and LINERS (L) nuclei are in between the two extremes. While our model does not simulate Seyfert (Sy) or LINERS (L) nuclei, the luminosity ratios of these galaxies are within the range of the other galaxies, and we keep them in our study. Focusing on the MIPS160 column, we notice that the luminosity ratio for elliptical galaxies is significantly lower than the other types of galaxies. On the other hand, the Engelbracht et al. (2008) starburst galaxies show a much higher ratio in all the MIPS bands, meaning that they are more efficient in producing far-infrared emission.
3. RESULTS
3.1. Dust Type
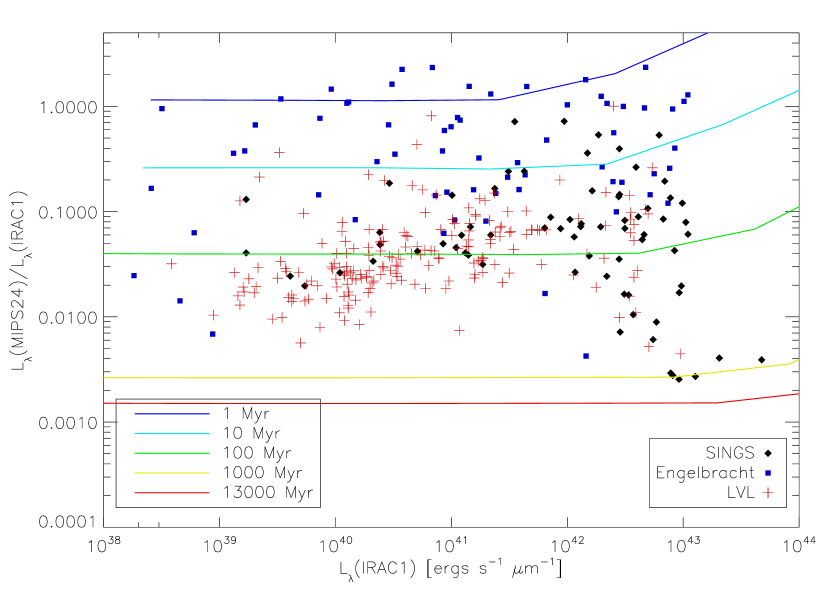
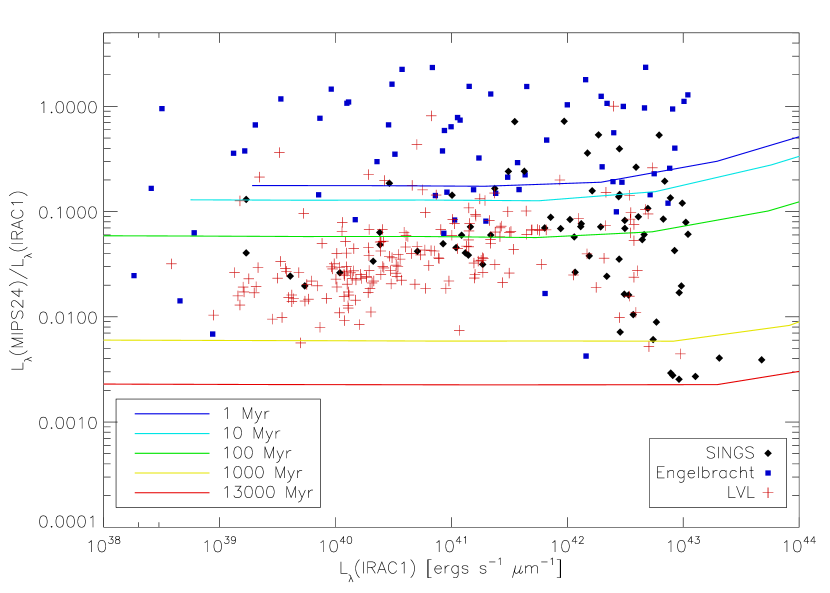
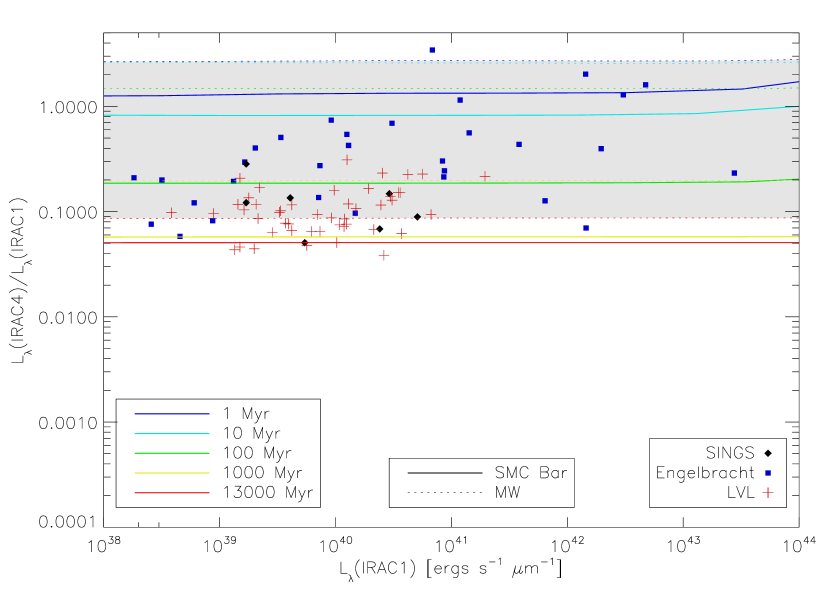
In Figure 4, we plot the MIPS24 to IRAC1 luminosity ratio for our galaxy sample, together with models with SMC Bar (left) and Milky Way type dust (right). Different models on the same curve have different stellar mass, characterized by their different IRAC1 luminosity on the x-axis. Here we use and radius = 10 kpc, but we see similar trends with other parameters. We note that the curves are relatively flat until they tick up in the regime of very high IRAC1 luminosity. This is because dust emission in the MIPS24 band is dominated by non-equilibrium heating for young stellar populations, or stellar continuum for old stellar populations. In either case, the fraction of MIPS24 to IRAC1 is a constant. Only at very high luminosity, does the dust temperature become high enough for equilibrium heating to make a comparable contribution and the curves start to turn up. We discuss the effects of non-equilibrium emission in section 3.4.
From 1 Myr old to 13 Gyr old, the models with SMC Bar type dust roughly span the whole range of luminosity ratios for the galaxies. On the other hand, the models with MW type dust are unable to cover all the galaxies. Even at the youngest age of 1 Myr, the model curve is below some galaxies (including most of the Engelbracht et al. (2008) starburst galaxies). At the other extreme, both types of dust do equally well for low MIPS24 to IRAC1 luminosity ratios. None of the galaxies have luminosity ratios lower than our oldest models (13 Gyr, close to the age of the universe). We see a similar distinction in the MIPS70 to IRAC1 luminosity ratios. From this perspective, the SMC Bar type dust is a better choice for our study, although this is different from Draine et al. (2007) who found that the SINGS galaxy sample has similar dust-to-gas ratio and similar PAH abundance to MW type dust. It is possible that the different results from the dust types are due to dust processing. If the MW type dust is more susceptible to destruction in a UV radiation field compared to the SMC Bar type dust, the former will produce less far-IR emission per unit IRAC1 luminosity and therefore a lower luminosity ratio. Unless otherwise specified, discussions in the following sections refer to SMC Bar type dust. Despite the differences we discuss here, the conclusion we draw about the age of stellar populations heating the dust (see section 3.5) is independent of the type of dust.
3.2. Age
To study what stellar age would best reproduce the observed luminosity ratios, we fix the other model parameters and see how the model results change as a function of stellar age. Knowing that is on the order of unity for normal disk galaxies (Holwerda et al., 2007), we assume an optical depth of . Dale et al. (2006) also found that the average attenuation is (which equals ) for a large portion of SINGS and some archival sources from ISO and Spitzer. We set the radius to be 10 kpc, a reasonable size of a galaxy. Our results do depend on the choice of optical depth and radius, but we first see what we find with these values. In section 3.3 we examine the effect of varying the optical depth and radius.
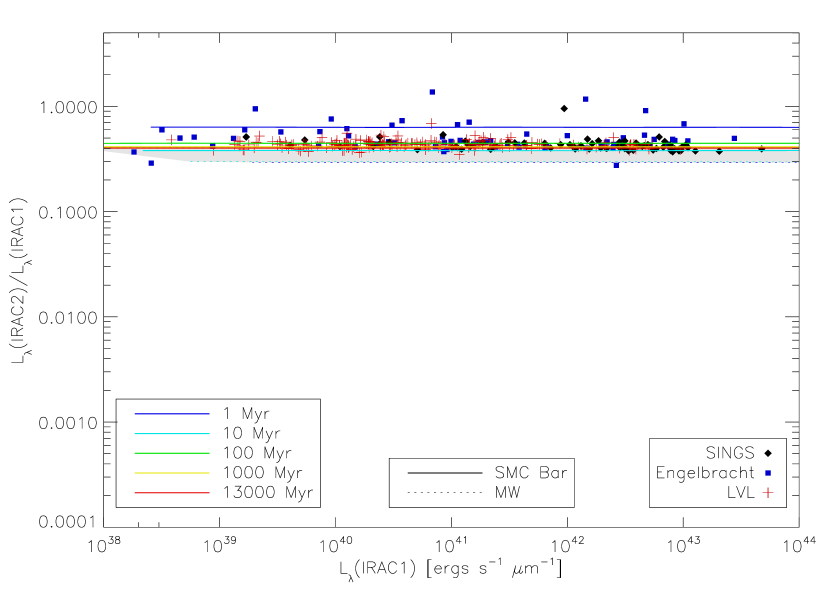
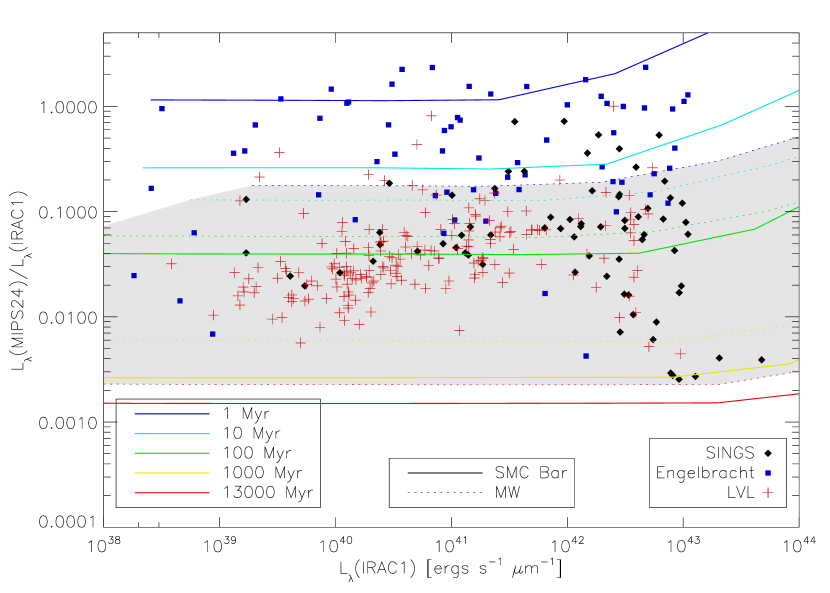
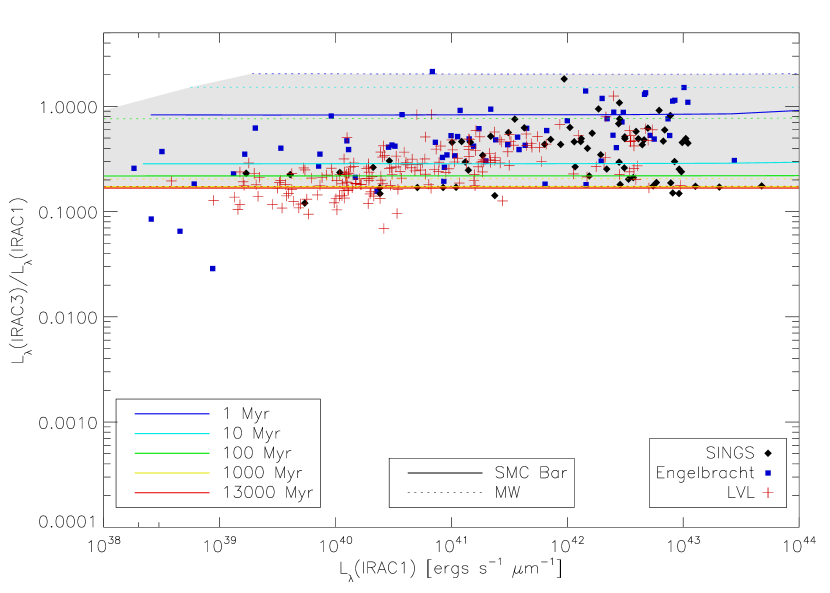
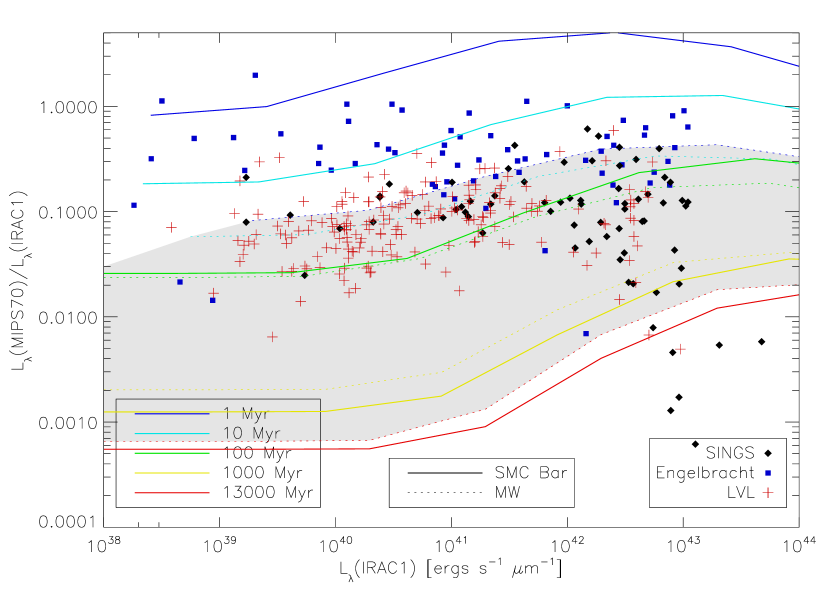
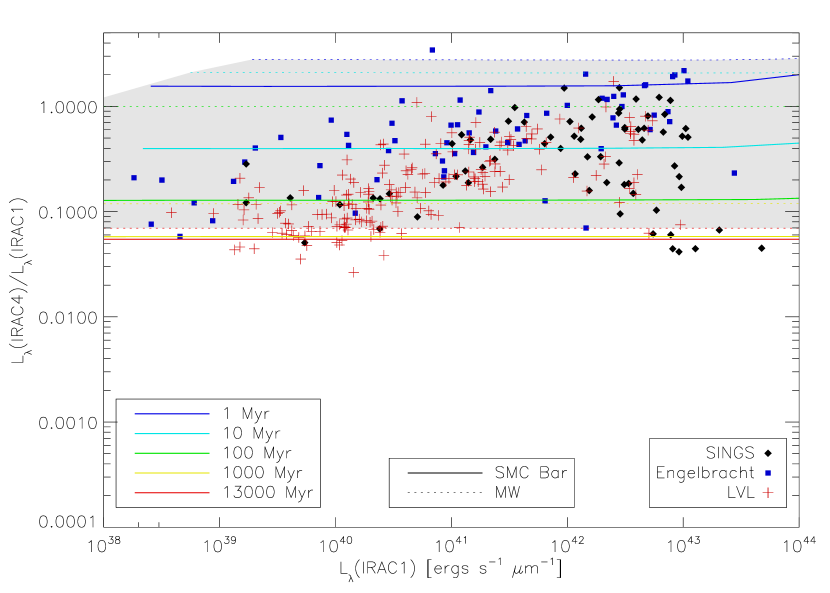
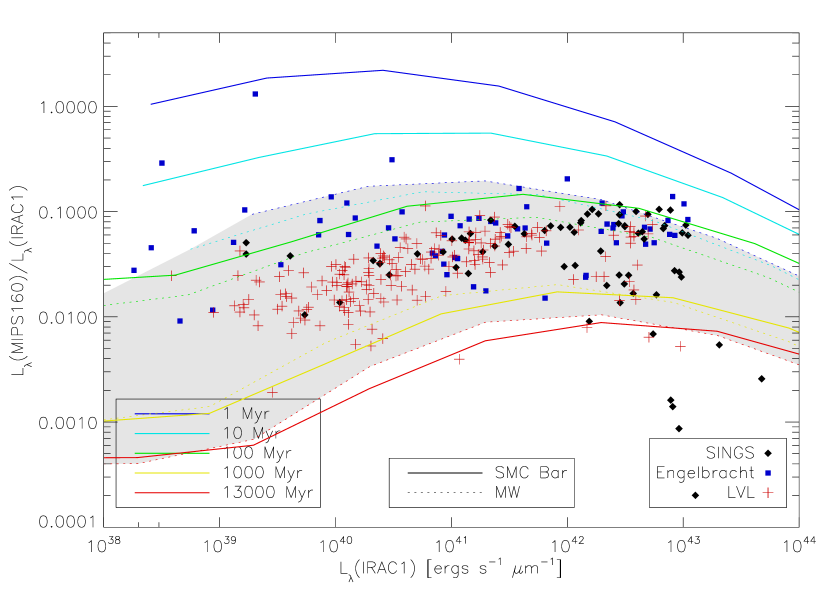
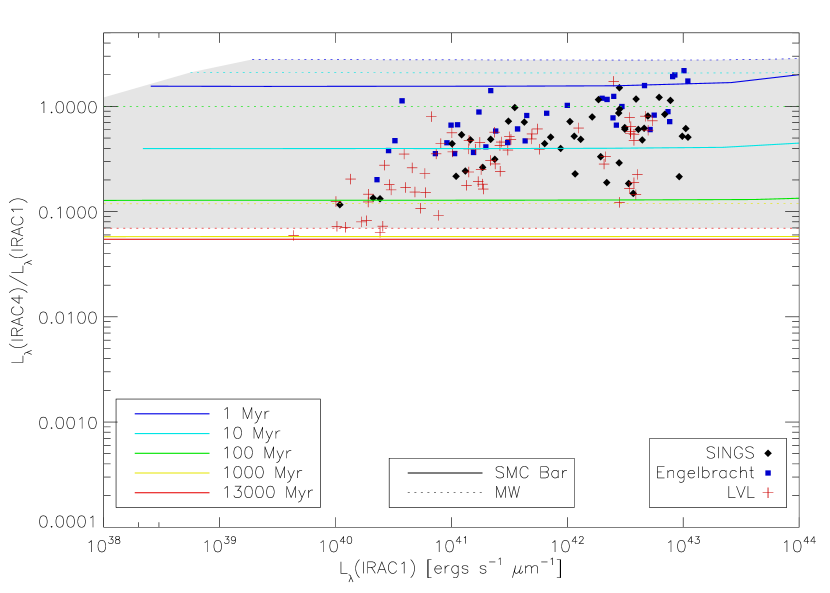
In Figure 5, we plot the luminosity ratios versus IRAC1 luminosity for IRAC and MIPS bands; the five curves correspond to five different stellar ages. The younger three (1, 10 and 100 Myr) are modeled with the SHELL geometry and the older two (1 and 13 Gyr) are modeled with the CLOUDY geometry. Younger populations are more efficient in producing IR due to being more embedded in the dust and their much higher intrinsic L(UV)/L(IRAC1) ratios, and the difference is most pronounced in the mid-IR. Taking the IRAC4/IRAC1 vs IRAC1 plot as an example, we see that the 10 Myr line matches the data the best (among the models with SMC type dust). The 1 Myr old models produce too much 8 µm flux (per unit 3.6 µm flux, on average), while the older models produce too little. For the MIPS24/IRAC1 plot, a combination of the 10 Myr old and 100 Myr old models match the median of the data, while for the MIPS160/IRAC1 plot, a combination of the 100 Myr old and 1 Gyr old models would do. This shows that the age of the stellar populations that dominates IR emission is on the order of 100 million years. The difference from IRAC4 to MIPS160 shows that the importance of younger stellar populations (less than 100 Myr) is relatively higher at shorter wavelengths.
As we vary the age, the IRAC2-to-IRAC1 plot shows a different trend from the other plots. Both the data and the models fall into a very narrow range (0.5 dex). This is because this color is dominated by stars only and the colors of populations of stars in the mid-IR are relatively constant; it is much less sensitive to dust compared to the longer wavelengths.
Note that the data points that have very low luminosity ratios in the MIPS bands are elliptical galaxies. The elliptical galaxies are shown as red symbols in Figure 2, and they show up in the lower right corner in the MIPS70 and MIPS160 plots. From our models, older stellar populations produce less dust emission per unit near-IR luminosity, and therefore should be better at explaining elliptical galaxies. However, the luminosity ratios of these galaxies are so low that even the oldest models (at about the age of the universe) cannot explain them. Noting that we have used and 10 kpc radius in Figure 5, this result suggest that the optical depth of elliptical galaxies could be lower than the average galaxy, or that their radii are larger than our modeled value. The former is the most probable explanation, as the zero-dust case for our oldest model gives a value of 0.0005 for MIPS160/IRAC1, low enough to explain the elliptical galaxies.
3.3. Optical depth and radius
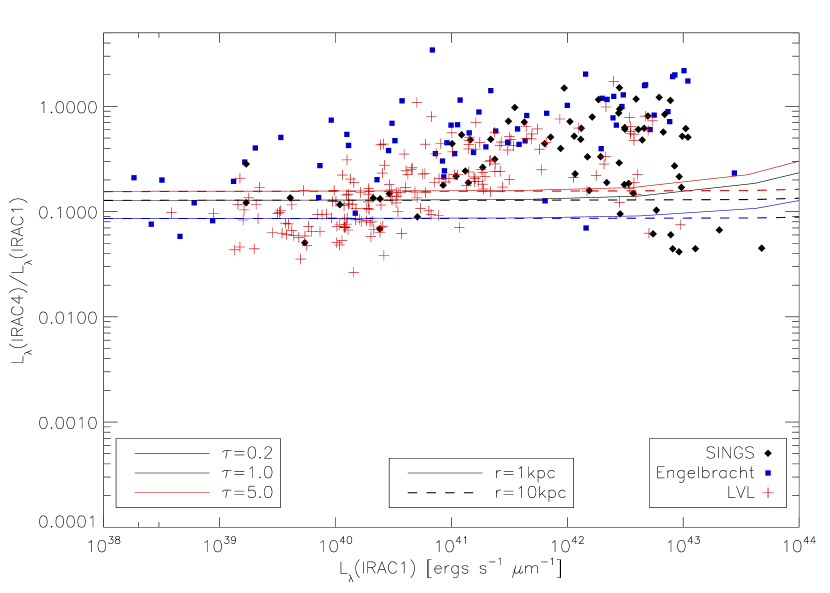
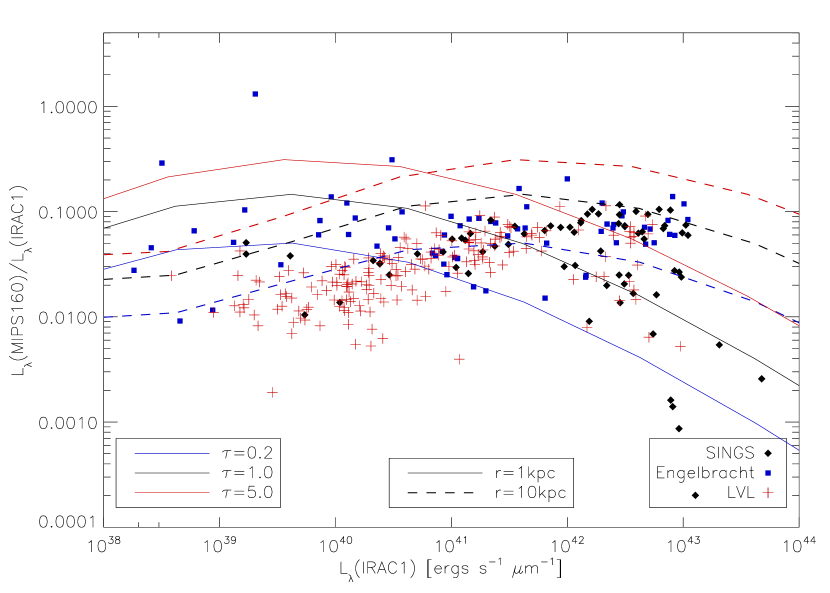
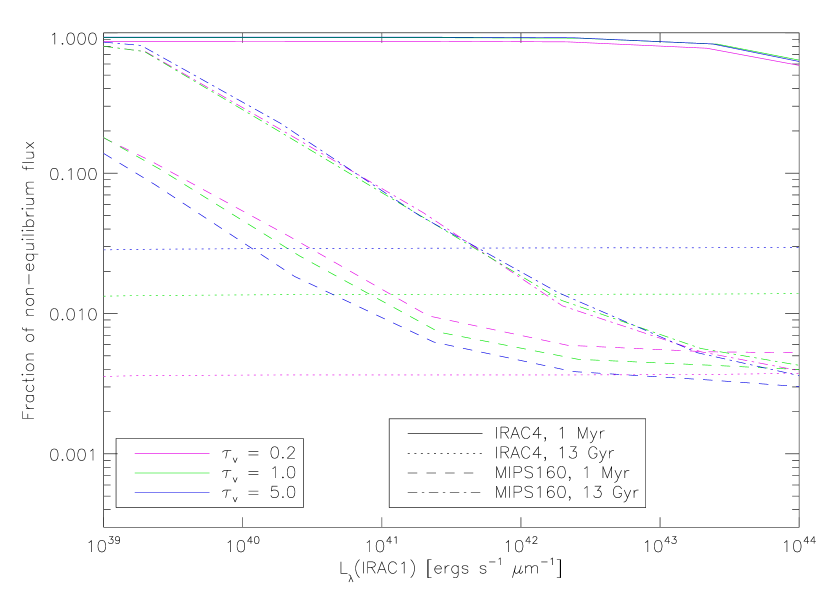
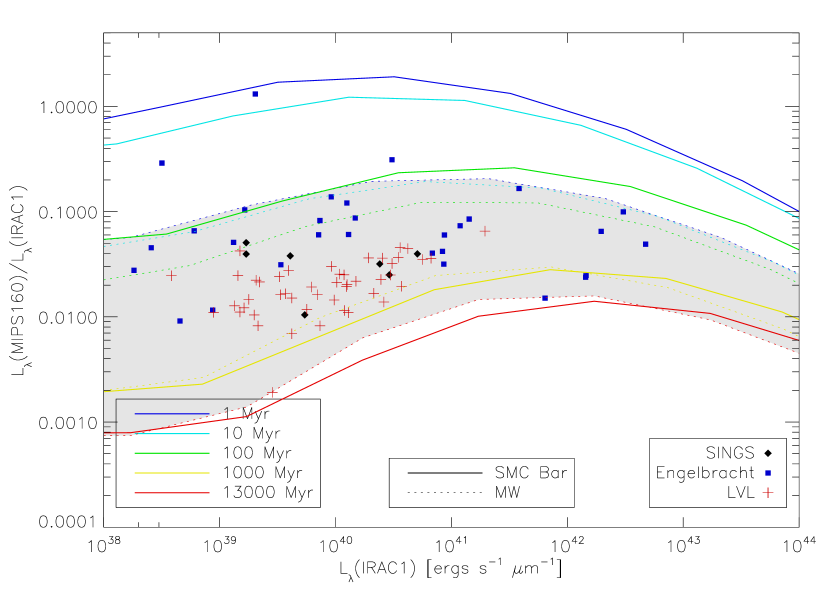
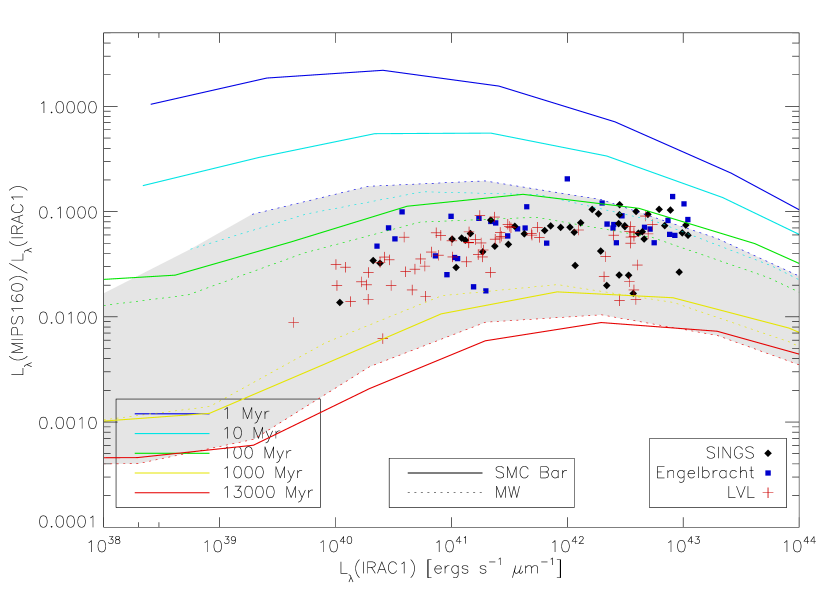
To illustrate the effect of the optical depth and radius of the model region on the results, we fix the stellar age at 100 Myr and vary the optical depth and radius in Figure 6. Dust with higher optical depth absorbs more energy and emits more far-IR radiation, and therefore gives a higher ratio in the plots. A larger radius dilutes the radiation field, lowers the dust temperature and shifts the equilibrium dust emission peak to a longer wavelength in the SED. In our luminosity ratio diagrams, it shifts the curves horizontally to the right. Because of the behavior of our model as explained in Section 2.1, we may also interpret the effect with mass surface density (). With the same reasoning, as the mass surface density decreases, the curves shift to the right.
As we study the effects of variations in optical depth and radius, we find a noticeable difference for the IRAC bands and the MIPS bands. For MIPS bands, changing the two parameters can change the curves significantly. This is evident on the plot for MIPS160 (Figure 6, right). However, in the IRAC bands, the curves are flatter and span a narrower range. As explained in section 3.1, this is because the dust emission in the IRAC bands is dominated by non-equilibrium heating. And since the curves are flat, shifting them horizontally makes no difference in our results; they are not very sensitive to the choice of radius. See section 3.4 for a discussion on equilibrium vs non-equilibrium dust emission.
From Figure 6 we can see that old stellar populations could possibly reproduce the observed luminosity ratios in Figure 5 only if the optical depth is very high, say 5 or 10. This is not realistic, as Holwerda et al. (2007) has shown that for normal disk galaxies is on the order of unity. In addition, if has such a high value, the optical depth at shorter wavelengths will be even greater and we wouldn’t be able to observe these galaxies in UV.
3.4. Equilibrium and non-equilibrium emission
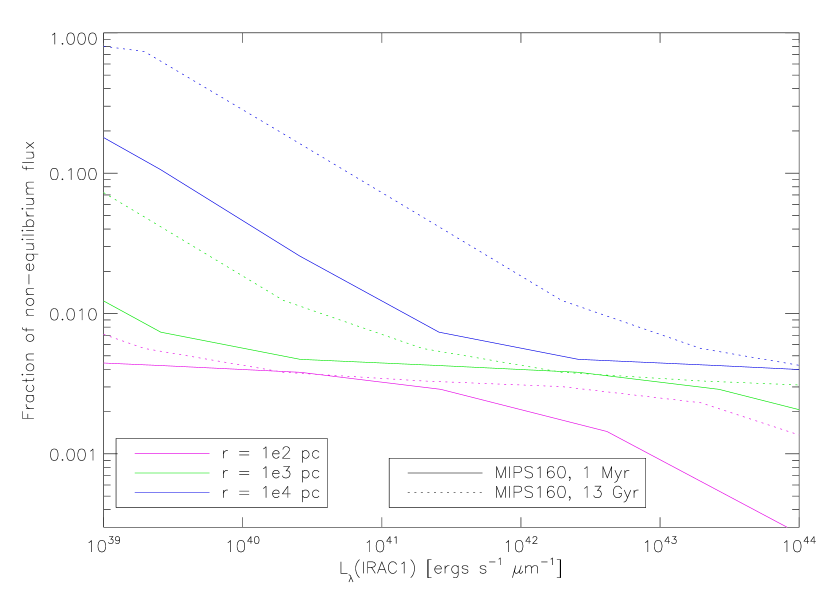
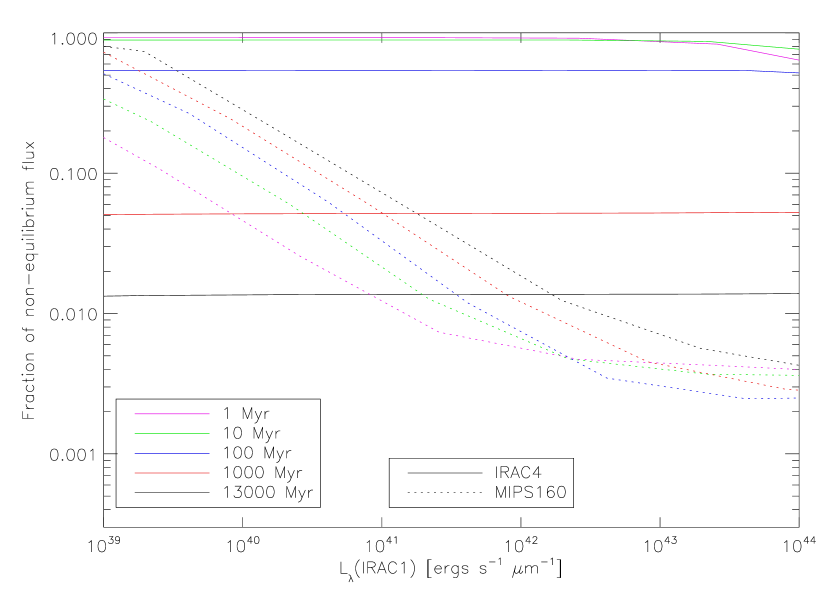
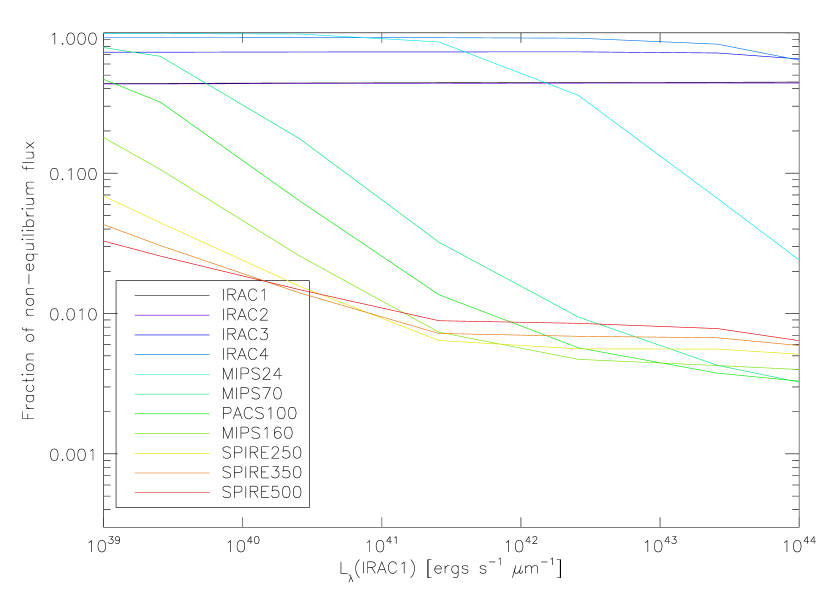
To help interpret our results, we examine the fraction of luminosity due to non-equilibrium heating. The plots in Figure 7 shows the different behavior of the fraction in different IR bands.
In the far-IR (MIPS70 to SPIRE500), non-equilibrium emission is negligible compared to equilibrium emission for a wide range of IRAC1 luminosity. Only at very low IRAC1 luminosity and large ( kpc) radii does non-equilibrium emission contribute significantly in the far-IR. When the flux is dominated by equilibrium emission, it depends on the dust temperature and therefore model parameters like the radius, and this can be seen in the MIPS160 curves of Figure 6.
On the other hand, the mid-IR bands (e.g. IRAC) exhibit different behavior. When modeled with young stellar populations (1 - 100 Myr old), the flux is dominated by non-equilibrium emission because of the large amount of highly energetic UV photons. When modeled with older stellar populations, the fraction of non-equilibrium emission is small, so equilibrium emission is the major source of the IR flux from dust. However, the dust temperature is not high enough to emit significant energy in mid-IR, so the flux is dominated by the stellar continuum. Either way, equilibrium emission does not play a significant role in the mid-IR bands, except at extremely high luminosities. Therefore, the radius parameter (which affects the dust temperature) does not change the result as much as they do for the far-IR bands.
Non-equilibrium emission is dominated by very high energy UV photons. As opacity goes up with the energy of the photon, most high energy UV photons are likely to be absorbed even in a low environment. IRAC4 is dominated by non-equilibrium emission, therefore further increases in do not result in more high energy UV photons being absorbed and so the IRAC4 to IRAC1 luminosity ratio would not change significantly. If we go back to Figure 6, we see that the luminosity ratio is less sensitive to the optical depth in IRAC4 then in MIPS160. MIPS24 is the turnover point for the two behaviors. This explains why the curves behave so differently in IRAC plots and MIPS plots as we change the model parameters in the previous sections.
3.5. Constraints on the fraction of luminosity from old stars
In this section, we attempt to calculate the fraction of IR luminosity that could be due to old stars using simple assumptions. Assume there are two non-interacting populations of stars, one younger and one older. When we look at models with the same IRAC1 luminosity as an observed galaxy, if the observed luminosity (say in MIPS160) is in between the younger (higher) and older (lower) luminosities, there exists a fraction of old stars of which the combination of the two model stellar populations reproduces the observed luminosity. We can write the luminosity of the galaxy at wavelength , as
| (1) |
where is the fraction of old stars, and and are the luminosities of the young and old models (e.g. 1 Myr and 13 Gyr) that have the same IRAC1 luminosity as the galaxy, respectively. The two terms represent the contribution of luminosity from the two populations. Eq. 1 can be inverted to solve for to yield
| (2) |
When we use the formula for galaxies that have a luminosity (per unit IRAC1 luminosity) lower than the one given by the old model, will be greater than 1, which is not physical. This corresponds to the case where the real galaxy is less efficient than the old model in producing dust emission. Such a situation can arise if, for example, the galaxy has a lower average optical depth than that assumed in our model. As a simplification we simply set in these cases. On the other hand, for galaxies with the luminosity per unit IRAC1 luminosity higher than our young model, will be negative and we set . After solving for the fraction of old stars , we can calculate the fraction of luminosity due to old stars :
| (3) |
| Dust Type | Flux band | Fraction of | Fraction of luminosity | Number of galaxies | Number of galaxies |
|---|---|---|---|---|---|
| old stars | from old stars | with | with | ||
| MW | IRAC4 | 0.854 0.018 | 0.285 0.078 | 5 | 1 |
| MW | MIPS24 | 0.611 0.102 | 0.068 0.017 | 1 | 9 |
| MW | MIPS70 | 0.569 0.110 | 0.145 0.071 | 3 | 8 |
| MW | MIPS160 | 0.572 0.107 | 0.181 0.062 | 4 | 7 |
| SMC Bar | IRAC4 | 0.736 0.055 | 0.220 0.061 | 2 | 1 |
| SMC Bar | MIPS24 | 0.942 0.008 | 0.050 0.007 | 1 | 1 |
| SMC Bar | MIPS70 | 0.964 0.001 | 0.120 0.053 | 3 | 1 |
| SMC Bar | MIPS160 | 0.931 0.004 | 0.203 0.055 | 3 | 1 |
| Dust Type | Flux band | Fraction of | Fraction of luminosity | Number of galaxies | Number of galaxies |
|---|---|---|---|---|---|
| old stars | from old stars | with | with | ||
| MW | IRAC4 | 0.758 0.049 | 0.191 0.058 | 1 | 1 |
| MW | MIPS24 | 0.184 0.101 | 0.021 0.006 | 1 | 40 |
| MW | MIPS70 | 0.174 0.083 | 0.022 0.014 | 1 | 36 |
| MW | MIPS160 | 0.516 0.105 | 0.088 0.016 | 1 | 8 |
| SMC Bar | IRAC4 | 0.590 0.097 | 0.139 0.040 | 1 | 6 |
| SMC Bar | MIPS24 | 0.630 0.118 | 0.017 0.003 | 1 | 7 |
| SMC Bar | MIPS70 | 0.830 0.039 | 0.020 0.005 | 1 | 2 |
| SMC Bar | MIPS160 | 0.913 0.013 | 0.097 0.009 | 1 | 1 |
| Dust Type | Flux band | Fraction of | Fraction of luminosity | Number of galaxies | Number of galaxies |
|---|---|---|---|---|---|
| old stars | from old stars | with | with | ||
| MW | IRAC4 | 0.950 0.006 | 0.512 0.102 | 35 | 1 |
| MW | MIPS24 | 0.775 0.050 | 0.081 0.013 | 2 | 9 |
| MW | MIPS70 | 0.512 0.076 | 0.031 0.012 | 2 | 25 |
| MW | MIPS160 | 0.803 0.029 | 0.155 0.029 | 4 | 1 |
| SMC Bar | IRAC4 | 0.887 0.021 | 0.410 0.083 | 16 | 1 |
| SMC Bar | MIPS24 | 0.954 0.005 | 0.061 0.008 | 1 | 1 |
| SMC Bar | MIPS70 | 0.945 0.008 | 0.028 0.009 | 2 | 1 |
| SMC Bar | MIPS160 | 0.969 0.003 | 0.128 0.022 | 4 | 1 |
Using 1 Myr (young) models and 13 Gyr (old) models, we calculate the fractions and for the 3 samples of galaxies, and tabulate the results for the IRAC4, MIPS24, MIPS70 and MIPS160 bands in Tables 3-5. Again, = 1 and 10 kpc radius are used. The fractions are shown here as the average plus or minus the standard deviation. The number of galaxies with out-of-range in each sample is given in columns 4 and 5. They are adjusted to = 0 or 1 as explained above.
While the fraction of old stars can exceed 90% (as in some of the calculation for models with SMC Bar dust), the fraction of the luminosity produced by old stars, , is much lower; it is generally lower than 20%, with the exception of the IRAC4 band for the LVL galaxies. Although is high for LVL/IRAC4, the remaining bands in the LVL sample yield lower values of , consistent with the other two galaxy samples. If we take the LVL/IRAC4 combination out of the picture and restrict our results to SMC Bar dust, the highest value of is 22.0%. Or, if we use 10 (100) Myr old stars instead of 1 Myr old stars as the younger population, the highest fraction becomes 27.9% (25.2%), again with MW/IRAC4/SINGS. On the other hand, if we keep the 1 Myr old stars but change the older population to 1 Gyr old stars, the highest fraction becomes 42.8%.
The fraction of luminosity is generally higher for MW type dust, but the choice of dust does not affect our conclusion that dust emission is dominated by young stars. It is remarkable that the values of computed from the MIPS luminosities are similar for both types of dust even when the fractions of old stars is consistently higher for SMC Bar type dust (this is generally true for different stellar ages as well). This could be attributed to the steeper far-UV rise in the SMC Bar extinction curve; for the same value of , the SMC Bar type dust is more effective in absorbing far-UV photons, and therefore requires fewer young stars to produce the same IR luminosity. The higher number of galaxies with for MW type dust can be understood by looking at Figure 5; the MW 1 Myr old line is below a significant number of galaxies.
If we do a more complex study to include more than two stellar ages in this analysis, the fraction will only be lower. We assume a linear contribution from the 2 stellar populations, which is not necessarily accurate because the effect of dust temperature on dust emission is non-linear. The more well-mixed the young and old stars are, the more non-linear their contribution will be. However, as older stars release many fewer UV photons compared to younger stars, it is almost certain that increasing the fraction of old stars would decrease the far-IR/IRAC1 ratios. Therefore, the far-IR/IRAC1 ratios are monotonically decreasing functions of the fraction of old stars (when all other parameters are fixed). Real stellar populations include a wide range of stellar ages, and with our analysis we can see whether such populations are closer to the “old” population or the “young” population. While this simple analysis cannot tell us what the best stellar age for the observed galaxies is, and the calculated fraction of old stars may suffer from non-linear effects, it is evident that dust emission is dominated by young stars.
3.6. Metallicity
In stars with high metallicity, absorption lines form a continuum that leads to the production of a soft UV radiation field. This stellar atmosphere effect is known as “line blanketing”. In contrast, stars with lower metallicity produce a harder radiation field. Empirically, metallicity correlates with the amount of dust (and therefore a low metallicity is often associated with a high gas-to-dust ratio). In the previous sections, we use a fixed (solar) metallicity for our models. However, the combination of a harder radiation field and a lower optical depth may give different results.
Metallicity has a somewhat phase-transition like effect. For the relatively high metallicities observed in the LMC and the Milky Way, observables are qualitatively similar. However, when we go to the low metallicity found in SMC, we find qualitatively different results, such as the lack of aromatic emission. For example, Engelbracht et al. (2005) found an abrupt change in the 8-to-24 µm color at around 1/4 solar metallicity. Calzetti et al. (2010) choose a metallicity of as a rough dividing line for the two behaviors. We use the same value to divide our sample into two groups: the high metallicity galaxies with metallicity higher than 8.1, and the low metallicity galaxies with metallicity lower than 8.1.
In Fig. 8, we compare the high metallicity galaxies with the low metallicity ones. We plot the high metallicity galaxies with solar metallicity models (as in Fig. 5), but 1/5 solar metallicity models for the low metallicity galaxies. The low metallicity sample has lower luminosity ratios in both IRAC4 and MIPS160 bands, showing that metallicity does have an effect on dust heating. They also have lower IRAC1 luminosity on average, consistent with the view that the big luminous galaxies are more evolved and have more metals, while the less luminous galaxies have relatively more young stars and lower metallicity. Calculations of the fraction of luminosity from old stars () shows that the results for the MIPS bands are qualitatively the same for the two metallicity groups; but for the IRAC4 band, of the low metallicity group can be as high as two times that of the high metallicity group. For SINGS and LVL, of the low metallicity group is higher than 0.5 for IRAC4. It suggests that the non-starburst, low metallicity galaxies may have lower PAH abundance than our dust model. Since there is no significant trend in the MIPS bands, metallicity does not affect our main conclusion.
3.7. Sub-mm Predictions
| Data Sample | Dust Type | ||||
|---|---|---|---|---|---|
| Engelbracht | MW | 0.046 0.006 | 0.136 0.028 | 0.176 0.036 | 0.213 0.044 |
| Engelbracht | SMC Bar | 0.032 0.001 | 0.227 0.028 | 0.349 0.039 | 0.463 0.044 |
| SINGS | MW | 0.129 0.059 | 0.237 0.067 | 0.277 0.072 | 0.308 0.077 |
| SINGS | SMC Bar | 0.111 0.052 | 0.355 0.053 | 0.477 0.049 | 0.572 0.045 |
| LVL | MW | 0.105 0.025 | 0.311 0.037 | 0.397 0.040 | 0.463 0.042 |
| LVL | SMC Bar | 0.068 0.021 | 0.375 0.029 | 0.566 0.025 | 0.706 0.020 |
The Herschel Space Observatory was recently launched in May 2009. The far infrared imaging camera of the Spectral and Photometric Imaging Receiver (SPIRE) has 3 photometric bands centered at 250, 350 and 500 µm. In addition, the Photodetector Array Camera and Spectrometer (PACS) has a photometric band at 100 µm that MIPS does not have. It is interesting to see, from a model point of view, the contribution of luminosity of old stars at these wavelengths.
Table 6 shows the fraction of luminosity () due to old stars at 100, 250, 350 and 500 µm, calculated with Equation 4. For the th galaxy, we use the fraction of old stars () calculated with Equation 2 for MIPS160 and the luminosity from the corresponding old () and young models () to estimate . The denominator is the estimated luminosity at the SPIRE wavelengths, and the numerator is the luminosity due to old stars only.
| (4) |
We convolve our model SEDs with the relative spectral response functions of the SPIRE bands (SPIRE Observers’ Manual, 2010) and the PACS 100 µm band (PACS Observer’s Manual, 2010) to compute the band integrated luminosity. We calculate the average and standard deviation for each combination of data sample (SINGS, Engelbracht and LVL) and model dust type (MW, SMC bar). We choose MIPS160 for the estimation of because it is the longest wavelength in this study. As we go from 100 µm to 500 µm, increases, showing that old stars are increasing in importance at longer wavelengths.
Moreover, in general has an increasing trend from the Engelbracht to the SINGS and the LVL sample. We have similar trends in some of the other bands but the trend in the SPIRE bands is much clearer, especially in the longest wavelength. This shows the order of the importance of the old stars in the 250-500 µm regime for the three catalogs. It is easy to understand the lower in the starburst sample as it has more recent star formation activity. So for starburst galaxies, young stars still contribute more luminosity in the sub-mm range (up to 500 µm) compared to old stars. The difference between of LVL and of SINGS is likely due to a combination of their stellar populations, galaxy type and composition. We will continue to explore this wavelength regime and have a better understanding when Herschel data is available.
4. CONCLUSION
Using our dusty radiative transfer model, together with IRAC and MIPS observations on the SINGS galaxies, the starburst galaxies in Engelbracht et al. (2008) and the LVL galaxies, we have studied the effect of stellar age on infrared luminosity. We found that MW type dust tends to produce too little infrared luminosity for some of the galaxies (especially for the starburst galaxies), and so SMC Bar type dust is a more appropriate choice. However, we also note that we have similar results with both types of dusts when we calculate the luminosity due to old stars.
From an analysis of the IRAC4/IRAC1 and MIPS160/IRAC1 luminosity ratios vs IRAC1 luminosity plots, we found that the observed luminosity cannot be produced by 13 Gyr old stellar populations alone. The stellar age that dominates dust heating is on the order of 100 Myr. However, a small number of galaxies - the elliptical galaxies - did not fit well into our analysis. Their lower far-IR to IRAC1 ratios could be attributed to their deficiency of dust.
We found that the models are more sensitive to changes in parameters (such as stellar age, radius and optical depth) in the far-IR bands compared to the mid-IR bands. This can be explained by the fact that non-equilibrium emission dominates mid-IR, but is mostly negligible in far-IR. When non-equilibrium emission dominates, the luminosity ratio is less dependent on dust temperature and is therefore less affected by changes in the radius and stellar mass; it is also less sensitive to optical depth because the extinction for highly energetic photons saturates.
With the simplistic assumption that the observed galaxies are composed of two stellar populations of different ages, we found that the fraction of far-IR luminosity from 13 Gyr old stars is generally less than 20%. The result does not depend on the metallicity. Therefore, cold does not necessarily mean old; our study shows that far-IR radiation is dominated by a small number of younger stars.
We are currently building a large grid of dusty radiation models and spectral evolutionary synthesis models. With the model grid we will attempt to further confirm this study by fitting each galaxy individually and derive properties such as stellar age. We will compare the statistics of the resultant properties to the results in this paper and explain any differences or new features observed.
References
- Bell & de Jong (2001) Bell, E. F. & de Jong, R. S. 2001, ApJ, 550, 212
- Bendo et al. (2010) Bendo, G. J., et al. 2010, A&A, 518, L65+
- Bigiel et al. (2008) Bigiel, F., et al. 2008, AJ, 136, 2846
- Boselli et al. (2010) Boselli, A., et al. 2010, A&A, 518, L61+
- Calzetti (2001) Calzetti, D. 2001, PASP, 113, 1449
- Calzetti et al. (2007) Calzetti, D., et al. 2007, ApJ, 666, 870
- Calzetti et al. (2010) —. 2010, ApJ, 714, 1256
- Conti et al. (2003) Conti, A., et al. 2003, AJ, 126, 2330
- Dale et al. (2009) Dale, D. A., et al. 2009, ApJ, 703, 517
- Dale et al. (2007) —. 2007, ApJ, 655, 863
- Dale et al. (2006) —. 2006, ApJ, 646, 161
- Draine (2009) Draine, B. T. 2009, in EAS Publications Series, Vol. 35, EAS Publications Series, ed. F. Boulanger, C. Joblin, A. Jones, & S. Madden, 245–268
- Draine et al. (2007) Draine, B. T., et al. 2007, ApJ, 663, 866
- Draine & Li (2007) Draine, B. T. & Li, A. 2007, ApJ, 657, 810
- Duley (1973) Duley, W. W. 1973, Ap&SS, 23, 43
- Engelbracht et al. (2007) Engelbracht, C. W., et al. 2007, PASP, 119, 994
- Engelbracht et al. (2005) —. 2005, ApJ, 628, L29
- Engelbracht et al. (2008) —. 2008, ApJ, 678, 804
- Fioc & Rocca-Volmerange (1997) Fioc, M. & Rocca-Volmerange, B. 1997, A&A, 326, 950
- Gordon et al. (1997) Gordon, K. D., Calzetti, D., & Witt, A. N. 1997, ApJ, 487, 625
- Gordon et al. (2003) Gordon, K. D., et al. 2003, ApJ, 594, 279
- Gordon et al. (2007) —. 2007, PASP, 119, 1019
- Gordon et al. (1999) —. 1999, ApJ, 519, 165
- Gordon et al. (2001) —. 2001, ApJ, 551, 269
- Helou (1994) Helou, G. 1994, in Astronomical Society of the Pacific Conference Series, Vol. 58, The First Symposium on the Infrared Cirrus and Diffuse Interstellar Clouds, ed. R. M. Cutri & W. B. Latter, 223–+
- Holwerda et al. (2007) Holwerda, B. W., Keel, W. C., & Bolton, A. 2007, AJ, 134, 2385
- Hora et al. (2008) Hora, J. L., et al. 2008, PASP, 120, 1233
- Kennicutt et al. (2009) Kennicutt, R. C., et al. 2009, ApJ, 703, 1672
- Kennicutt (1998) Kennicutt, Jr., R. C. 1998, ARA&A, 36, 189
- Kennicutt et al. (2003) Kennicutt, Jr., R. C., et al. 2003, PASP, 115, 928
- Leroy et al. (2008) Leroy, A. K., et al. 2008, AJ, 136, 2782
- Lonsdale Persson & Helou (1987) Lonsdale Persson, C. J. & Helou, G. 1987, ApJ, 314, 513
- Marble et al. (2010) Marble, A. R., et al. 2010, ApJ, 715, 506
- Misselt et al. (2001) Misselt, K. A., et al. 2001, ApJ, 551, 277
- Moustakas et al. (2010) Moustakas, J., et al. 2010, ApJS, 190, 233
- Noll et al. (2009) Noll, S., et al. 2009, A&A, 499, 69
- Pflamm-Altenburg & Kroupa (2009) Pflamm-Altenburg, J. & Kroupa, P. 2009, ApJ, 706, 516
- Sauvage & Thuan (1992) Sauvage, M. & Thuan, T. X. 1992, ApJ, 396, L69
- Searle et al. (1973) Searle, L., Sargent, W. L. W., & Bagnuolo, W. G. 1973, ApJ, 179, 427
- Sellgren (1984) Sellgren, K. 1984, ApJ, 277, 623
- Stansberry et al. (2007) Stansberry, J. A., et al. 2007, PASP, 119, 1038
- Weingartner & Draine (2001) Weingartner, J. C. & Draine, B. T. 2001, ApJ, 548, 296
- Witt & Gordon (1996) Witt, A. N. & Gordon, K. D. 1996, ApJ, 463, 681
- Witt & Gordon (2000) —. 2000, ApJ, 528, 799
- Witt et al. (1992) Witt, A. N., Thronson, Jr., H. A., & Capuano, Jr., J. M. 1992, ApJ, 393, 611
- Xu & Helou (1996) Xu, C. & Helou, G. 1996, ApJ, 456, 163