Exploring the variable stars in the globular cluster NGC 5024 (M53): New RR Lyrae and SX Phoenicis stars††thanks: Based on observations collected at the Indian Astrophysical Observatory, Hanle, India.
Abstract
We report CCD and time series photometry of the globular cluster NGC 5024 (M53). The technique of difference image analysis has been used which enables photometric precisions better than 10 mmag for stars brighter than mag even in the crowded central regions of the cluster. The high photometric precision has resulted in the discovery of two new RR1 stars and thirteen SX Phe stars. A detailed identification chart is given for all the variable stars in the field of our images of the cluster. Periodicities were calculated for all RR Lyraes and SX Phe stars and a critical comparison is made with previous determinations.
Out of four probable SX Phe variables reported by Dékány & Kovács (2009), the SX Phe nature is confirmed only for V80, V81 is an unlikely case while V82 and V83 remain as dubious cases. Previous misidentifications of three variables are corrected. Astrometric positions with an uncertainty of arcsec are provided for all variables.
The light curve Fourier decomposition of RR0 and RR1 is discussed, we find a mean metallicity of [Fe/H]= in the scale of Zinn & West from 19 RR0 stars. The true distance moduli and and the corresponding distances and kpc are found from the RR0 and RR1 stars respectively. These values are in agreement with the theoretical period-luminosity relations for RR Lyrae stars in the band and with recent luminosity determinations for the RR Lyrae stars in the LMC.
The age of 13.250.50 Gyr (Dotter et al. 2010), for NGC 5024, and the above physical parameters of the cluster, as indicated from the RR0 stars, produce a good isochrone fitting to the observed CMD.
The PL relation for SX Phe stars in NGC 5024 in the and bands is discussed in the light of the 13 newly found SX Phe stars and their pulsation mode is identified in most cases.
keywords:
Globular Clusters: NGC 5024 – Variable Stars: RR Lyrae, SX Phe.1 Introduction
This paper is part of a series on CCD photometry of globular clusters in which we employ the technique of difference image analysis (DIA) to produce precise time series photometry of individual stars down to 19.5 mag even in crowded regions. The DIA photometry has proved to be a very useful tool in obtaining high quality light curves of known variables, and for discovering and classifying new variables. We also estimate the mean [Fe/H], and for the RR Lyrae stars by the technique of light curve Fourier decomposition (see e.g. Arellano Ferro et al. 2010; Bramich et al. 2011 and references there in).
The globular cluster NGC 5024 (M53) RA , Dec. , J2000; , is located in the intermediate Galactic halo at 17.5 kpc, RG=18.3 kpc (Harris 1996) hence its reddening is very low (). With [Fe/H] , it is among the most metal deficient globular clusters in the Galaxy.
The present edition of the Catalogue of Variable stars in Globular Clusters (CVSGC) (Clement et al. 2001) lists 90 variable stars in NGC 5024, 62 of which are RR Lyrae stars of either RR0 or RR1 type, 11 confirmed and 4 suspected SX Phe, 2 confirmed and 6 suspected semi-regular variables at the Red Giant tip, 3 suspected slow irregular variables (or Lb’s), and 2 stars which were found not to be variables (V22 and V39).
The cluster has been the subject of two recent studies based on CCD photometry by Kopacki (2000) (K00) and Dékány & Kovács (2009) (DK09). Our images cover a larger field than those of K00 and are a bit smaller than those of DK09. However the resolution of our images is much better than those in these previous works: 0.296 arcsec pix-1, compared to 0.688 arcsec pix-1 for K00 and 1.026 arcsec pix-1 for DK09, leading to better deblending of stars in crowded regions, hence the number of measured stars almost triples to about 8910 in and 8619 in . For these reasons we feel that our study can contribute to a better understanding of the properties of the many variables in NGC 5024, to their field identification and to the search for new variables. We also note that although our observations obtained in 2009 and 2010 represent an extension of the observations by K00 and DK09 acquired in 1998-1999 and 2007-2008 respectively, we choose not to combine the data for period finding purposes since a close inspection of the light curves from K00 showed that they have a large intrinsic scatter and some difference in zero point. Likewise the precision of the light curves measured by DK09 particularly in crowded regions, most likely due to the low resolution of their images, was not very good.
The major goal of our studies of variable stars in globular clusters has been to obtain internally precise light curves of RR Lyrae stars and use them to estimate mean values of [Fe/H] and by their Fourier decomposition into their harmonics. Two colour photometry permits to estimate the age of the cluster and to discover and discuss the nature of some variables from their position in the CMD.
In this paper we present a complete census of the variables in the cluster, and estimate the mean values of the metallicity and distance to the cluster using monoperiodic RR Lyrae stars. We provide astrometric positions of the variable stars with an accuracy of 0.3 arcsec.
In Sect. 2 we describe the observations and data reductions. In Sect. 3 a detailed discussion is presented on the variability and identification of many individual objects and some new variables are presented. In Sect. 4 we calculate the metallicity and absolute magnitude of the RR Lyrae stars using the Fourier light curve decomposition method and discuss the transformations to homogeneous scales. In Sect. 5 we present the newly found SX Phe stars and calibrate their PL relationship. In Sect. 6 brief comments on the long term variables in the cluster are made in the light of our present data. Section 7 contains comments on the age of NGC 5024 and in Section 8 our findings are summarized.
2 Observations and Reductions
2.1 Observations
The observations employed in the present work were performed using the Johnson and filters on April 17, 18 and 19, 2009, on January 22 and 23, February 21 and 22, March 7 and 8, April 7 and 25, and on May 6 2010. A total of 177 epochs in the filter and 184 in the filter were obtained. The 2.0m telescope of the Indian Astronomical Observatory (IAO), Hanle, India, located at 4500m above sea level was used. The estimated seeing was 1 arcsec. The detector was a Thompson CCD of 2048 2048 pixels with a pixel scale of 0.296 arcsec/pix and a field of view of approximately arcmin2.
2.2 Difference Image Analysis
We employed the technique of difference image analysis (DIA) to extract high precision photometry for all point sources in the images of NGC 5024 (Alard & Lupton 1998; Alard 2000; Bramich et al. 2005). We used a pre-release version of the DanDIA111 DanDIA is built from the DanIDL library of IDL routines available at http://www.danidl.co.uk pipeline for the data reduction process (Bramich et al., in preparation) which includes a new algorithm that models the convolution kernel matching the point-spread function (PSF) of a pair of images of the same field as a discrete pixel array Bramich (2008).
The DanDIA pipeline was used to perform a number of image calibration steps that include the bias and flat corrections, the cosmic ray cleaning of all raw images, and the creation of a reference image for each filter by stacking a set of the best-seeing calibrated images taken on a single night. In each reference image, we measured the fluxes (referred to as reference fluxes) and positions of all PSF-like objects (stars) by extracting a spatially variable (with polynomial degree 3) empirical PSF from the image and fitting this PSF to each detected object. The detected stars in each image in the time-series sequence were matched with those detected in the corresponding reference image, and a linear transformation was derived which was used to register each image with the reference image. For each filter, a sequence of difference images was created by subtracting the relevant reference image, convolved with an appropriate spatially variable kernel, from each registered image. The differential fluxes for each star detected in the reference image were measured on each difference image. Light curves for each star were constructed by calculating the total flux in ADU/s at each epoch from:
| (1) |
where is the reference flux (ADU/s), is the differential flux (ADU/s) and is the photometric scale factor (the integral of the kernel solution- see Section 2.2 of Bramich 2008). Conversion to instrumental magnitudes was achieved using:
| (2) |
where is the instrumental magnitude of the star at time . Uncertainties were propagated in the correct analytical fashion.
The above procedure and its caveats have been described in detail in a recent paper (Bramich et al. 2011) and the interested reader is refered to it for the relevant details.

| Variable | Filter | HJD | ||||||||
|---|---|---|---|---|---|---|---|---|---|---|
| Star ID | (d) | (mag) | (mag) | (mag) | (ADU s-1) | (ADU s-1) | (ADU s-1) | (ADU s-1) | ||
| V1 | 2454939.20002 | 17.167 | 18.487 | 0.003 | 661.567 | 1.722 | -299.031 | 1.098 | 1.1564 | |
| V1 | 2454939.23093 | 17.187 | 18.507 | 0.003 | 661.567 | 1.722 | -309.195 | 1.076 | 1.1625 | |
| ⋮ | ⋮ | ⋮ | ⋮ | ⋮ | ⋮ | ⋮ | ⋮ | ⋮ | ⋮ | ⋮ |
| V1 | 2454939.19220 | 16.541 | 17.935 | 0.003 | 782.781 | 3.855 | -134.485 | 2.042 | 1.1907 | |
| V1 | 2454939.20744 | 16.528 | 17.922 | 0.003 | 782.781 | 3.855 | -122.903 | 1.961 | 1.1757 | |
| ⋮ | ⋮ | ⋮ | ⋮ | ⋮ | ⋮ | ⋮ | ⋮ | ⋮ | ⋮ | ⋮ |
2.3 Photometric Calibrations
The instrumental and magnitudes were converted to the Johnson-Kron-Cousins photometric system by using the standard stars in the field of NGC 5024 from the collection of Stetson (2000)222 (http://www3.cadc-ccda.hia-iha.nrc-cnrc.gc.ca/community/STETSON/standards). These stars have magnitudes in the interval . We identified 48 and 46 standard stars in the and reference images with a homogeneous colour distribution between . The transformations between the instrumental and the standard systems can be fitted by a linear relation and no colour term was found to be significant. The linear correlation coefficients are of the order of (see Fig. 1). These relations were used to transform all detected point sources in our images to the Johnson-Kron-Cousins photometric system (Landolt 1992). All our photometry for the variables in the field of our images for NGC 5024 is reported in Table 1. Only a small portion of this table is given in the printed version of this paper but the full table is available in electronic form.
2.4 Astrometry
A linear astrometric solution was derived for the filter reference image by matching 1000 hand-picked stars with the USNO-B1.0 star catalogue (Monet et al. 2003) using a field overlay in the image display tool GAIA (Draper 2000). We achieved a radial RMS scatter in the residuals of 0.3 arcsec. The astrometric fit was then used to calculate the J2000.0 celestial coordinates for all the confirmed variables in our field of view (see Table 2). The coordinates correspond to the epoch of the reference image, which is the heliocentric Julian day 2455249.332 d.
3 Variable stars in NGC 5024
Of the 90 stars listed in the most recent version of the Catalogue of Variable stars in Globular Clusters (Clement et al. 2001), 13 stars are not in the field of our images and 7 are saturated. The star V39 has been shown to be non variable by Cuffey et al. (1965). We confirm from our present data that the star is not variable at the level of 0.01 mag and hence it is not included. The remaining 69 stars are listed in Table 2. In this paper we also report the discovery of two RR1 stars near the central regions of the cluster, now labeled V91 and V92 (included in Table 2), and of 13 SX Phe stars. In this section we discuss the results of our exploration of their variability, periodicity, field identification and celestial coordinates.


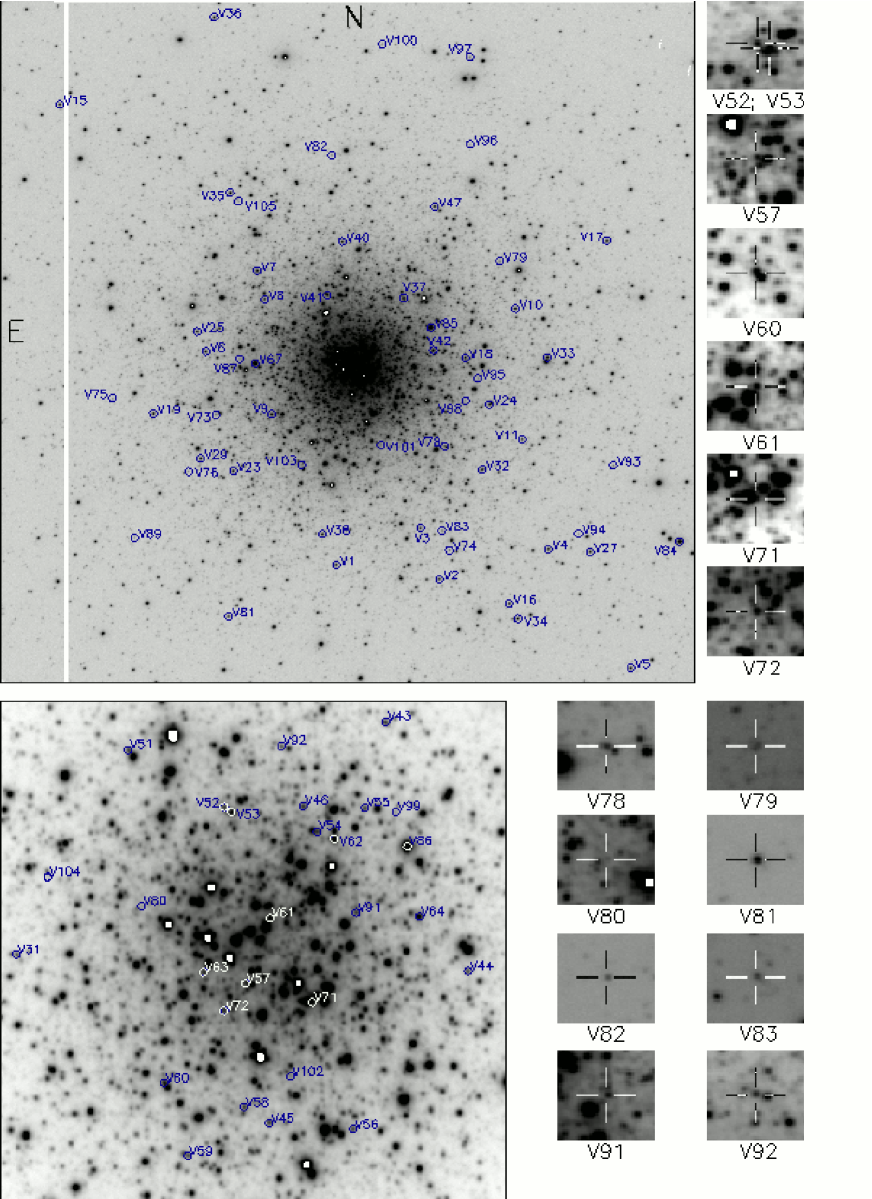
3.1 Identification of variable stars
Many variable stars in this cluster are located in the central crowded region and some are blended. Probably due to this the identifications of some variables in previous publications has been in error. Also, for many of the most recently discovered variables no identification charts have ever been published. The 8 candidate RR Lyrae stars announced by Rey et al. (1998) turned out to be previously known variables as has been pointed out by K00 and confirmed by us. In this paper we provide a chart and accurate celestial coordinates for all the known and the newly discovered variables in the cluster. In the following paragraphs we remark on those variables whose identification was wrong or dubious in previous publications.
V57. The star identified on the map of K00 shows no variations in our photometry, while the star to the NE at RA=13h 12m 55.56s dec=+18o 09’ 58.2” shows a clear variation with an amplitude of 0.8 mag and a period of 0.568198d, thus, we confirm our identification of V57 (see Fig. 2) and its RR0 nature. Incidentally, the correct star does not appear in the chart of K00.
V60. This star is blended with another star of similar brightness. We have confirmed that the variable is the star to the NE as identified on Fig. 2, which coincides well with the identification made by K00. However caution is advised on future work. Due to the contamination of the neighbouring star, the magnitude, colour and amplitude of V60 have been altered. Its mean and magnitudes are brighter compared to other RR Lyraes, hence its peculiar position on the CMD of Fig. 4.
V61. This star is misidentified in the chart of K00. The star marked is a magnitude star and hence it is nearly three magnitudes brighter than the RR Lyrae stars in the cluster. The RR1 star is in fact the fainter star to the NW as marked in the finding chart of Fig. 2. This star has a period of 0.369917 d and a light curve typical of an RR1 both in and , thus we confirm the identification of the star. However due to the contamination of the brighter neighbour, V61, like V60, has a peculiar magnitude, color and amplitude.
V62. This star is too bright both in and to be a RR Lyrae, although its period and light curve are those of a typical RR1. Its position on the CMD is correspondingly peculiar. In fact in our images this is an exceptionally close blend of two bright stars as can be seen by the residuals on the reference image when the PSF model is subtracted. This explains the very low amplitude of the light curve and why it is so bright on the CMD. It is not possible to isolate the RR Lyrae star with the present data.
V64. Similar to V62 this star in our images is a very close blend of two bright stars, one of them being the RR1 variable. We cannot isolate the true variable. Its low amplitude and peculiar position on the CMD are due to the blending.
V71. We identified this star on our astrometric image using the RA and DEC from DK09. Their coordinates on our astrometric image fall on a 14 mag star which is not variable. A close inspection of the neighbouring stars in our difference images led us to infer that the variable star is the faint one blended to the W. See the detailed identification chart in Fig. 2. We confirm its variability as reported by DK09 but have found a slightly different period. The light curve is scattered and the colour is peculiar probably due to contamination of two close neighbours.
V72. We identified this star on our astrometric image using the RA and Dec from DK09. The star marked by DK09 is not variable. We explored the neighbouring stars and found that the star labeled as V72 in Fig. 2 is the true RR1 which coincides in amplitude and period with the star discovered by DK09 which indicates that we have identified the genuine variable.
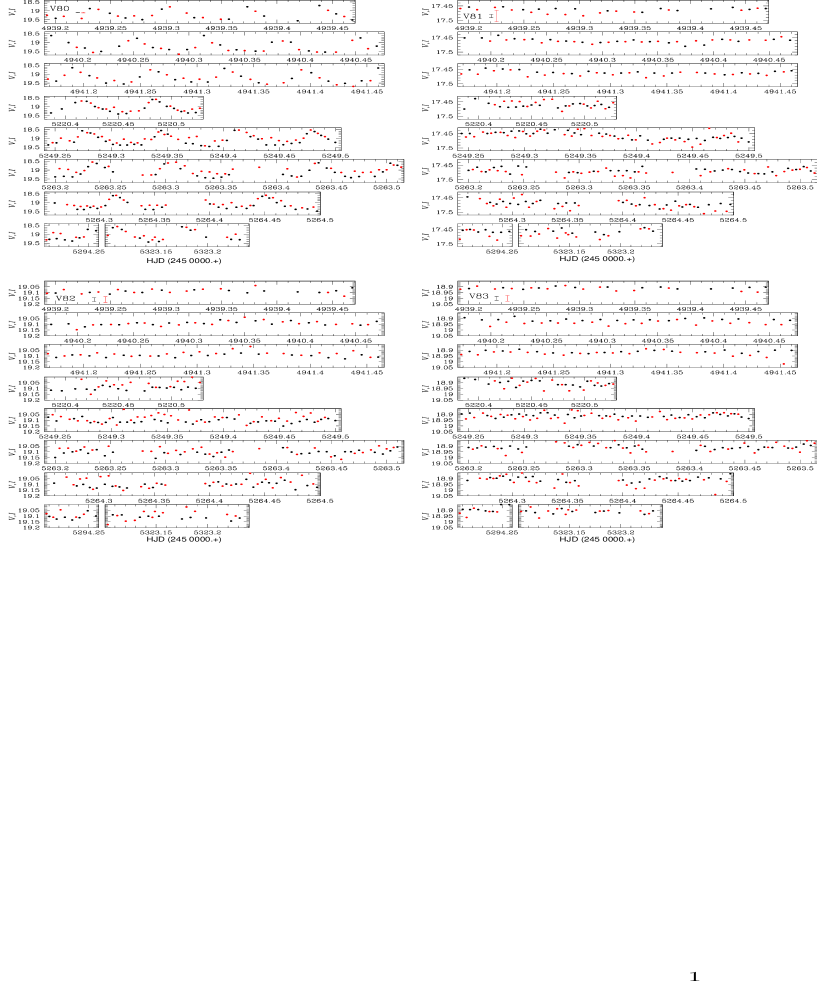
V80. This star was listed as suspected SX Phe variable by DK09 although they do not provide a finding chart for the star. We have used the coordinates given by these authors (RA , Dec. ) to identify the star. Their coordinates correspond to a V=17.8 magnitude star that does not show variations above the mean photometric error for its brightness which is of about 0.01 mag. We explored the light curves of the neighbouring stars and confirm the SX Phe is the faint star to the W, at RA , Dec. . Its light curve is shown in Fig. 5 and it is identified in Fig. 2.
V81. Like DK09 we find this star to be located in the lower part of the RGB (see Fig. 4). We found no clear traces of variability in the light curve of this star above the mean photometric error, which for its brightness is of about 0.01 mag (see Fig. 5), and we did not succeed in finding any frequency above the noise level in the period spectrum. Thus we do not confirm the period found by DK09 (0.07137d) nor we confirm this star as an SX Phe variable.
V82 and V83. We have identified these stars using the coordinates published by DK09. The stars are quite isolated, still we do not see clear signs of variability in their light curves above the photometric error of mag for their corresponding brightness (Fig. 5). The period analysis of V82 does not reproduce the frequency reported by DK09 (45.33). Thus we do not confirm its variability and hence its SX Phe nature. For V83 we find some signal at although of very low amplitude (0.008 mag). The reported frequency by DK09 is . Thus even if some indications of variability might be present for V83, its status as an SX Phe variable remains uncertain.
V91 and V92. These are two newly discovered RR1 stars with periods 0.302423d and 0.277219d respectively. They are found to be located right in the HB along with the other RR1 stars known in the cluster. Detailed identification of these stars is given in Fig. 2.
The light curves of all RR Lyrae stars in the field of our images are shown in Fig. 3.
| Variable | Bailey’s | Other | (days) | HJDmax | (days) | (days) | (days) | RA | Dec. |
|---|---|---|---|---|---|---|---|---|---|
| type | type | this work | (+240 0000.) | J03 | K00 | DK09 | J(2000.0) | J(2000.0) | |
| V1 | RR0 | 0.609823 | 54939.438 | – | 0.6098298 | 13 12 56.32 | +18 07 13.9 | ||
| V2 | RR1-Bl | 0.386133 | 54940.342 | – | 0.386122 | 13 12 50.28 | +18 07 00.9 | ||
| V3 | RR0 | 0.630598 | 55323.198 | – | 0.630605 | 13 12 51.38 | +18 07 45.4 | ||
| V4 | RR1 | 0.385635 | 54939.278 | – | 0.385545 | 13 12 43.88 | +18 07 26.4 | ||
| V5 | RR0 | 0.639421 | 55249.474 | – | 0.639426 | 13 12 39.08 | +18 05 42.7 | ||
| V6 | RR0 | 0.664017 | 55294.248 | 0.6640142 | 0.664020 | 13 13 03.90 | +18 10 19.9 | ||
| V7 | RR0 | 0.544861 | 54940.391 | 0.5448460 | 0.5448584 | 13 13 00.86 | +18 11 30.0 | ||
| V8 | RR0 | 0.615524 | 55249.468 | 0.6155072 | 0.615528 | 13 13 00.41 | +18 11 05.1 | ||
| V9 | RR0 | 0.600375 | 54941.190 | 0.6003482 | 0.6003690 | 13 13 00.07 | +18 09 25.1 | ||
| V10 | RR0 | 0.608264 | 55294.226 | 0.6082530 | 0.6082612 | 13 12 45.72 | +18 10 55.5 | ||
| V11 | RR0-Bl | 0.629959 | 55220.523 | 0.6299424 | 0.629940 | 13 12 45.38 | +18 09 02.0 | ||
| V15 | RR1-Bl: | 0.308704 | 55220.482 | – | 0.3086646 | 13 13 12.38 | +18 13 55.3 | ||
| V16 | RR1-Bl | 0.303158 | 55294.257 | – | 0.3031686 | 13 12 46.19 | +18 06 39.3 | ||
| V17 | RR1-Bl | 0.381055 | 55323.183 | – | 0.381282 | 13 12 40.34 | +18 11 54.1 | ||
| V18 | RR1-Bl | 0.336050 | 54939.325 | 0.33611 | 0.336054 | 13 12 48.6 | +18 10 13.2 | ||
| V19 | RR1-Bl | 0.391160 | 55294.248 | 0.3909871 | 0.391377 | 13 13 07.01 | +18 09 26.4 | ||
| V23 | RR1-Bl | 0.366099 | 54940.391 | 0.36579 | 0.365804 | 13 13 02.34 | +18 08 36.0 | ||
| V24 | RR0 | 0.763195 | 54940.407 | 0.7631901 | 0.763198 | 13 12 47.28 | +18 09 32.4 | ||
| V25 | RR0 | 0.705144 | 55264.341 | 0.7051473 | 0.705162 | 13 13 04.41 | +18 10 37.3 | ||
| V27 | RR0 | 0.671073 | 54940.342 | 0.671071 | 13 12 41.43 | +18 07 23.8 | |||
| V29 | RR0 | 0.823243a | 55220.397 | 0.8232550 | 0.823243 | 13 13 04.26 | +18 08 47.0 | ||
| V31 | RR0 | 0.705671 | 55323.183 | 0.70572 | 0.705665 | 13 12 59.57 | +18 10 04.9 | ||
| V32 | RR1-Bl | 0.390524 | 55323.183 | 0.39041 | 0.390623 | 13 12 47.73 | +18 08 35.9 | ||
| V33 | RR0-Bl | 0.624584 | 54941.416 | 0.624585 | 0.6245815 | 13 12 43.86 | +18 10 13.1 | ||
| V34 | RR1-Bl | 0.289626 | 54941.266 | – | 0.289611 | 13 12 45.70 | +18 06 26.2 | ||
| V35 | RR1-Bl | 0.372668 | 55264.280 | – | 0.372666 | 13 13 02.42 | +18 12 37.9 | ||
| V36 | RR1-Bl | 0.373320 | 54941.430 | – | 0.373242 | 13 13 03.29 | +18 15 10.4 | ||
| V37 | RR0 | 0.717620 | 54941.309 | 0.717611 | 0.717615 | 13 12 52.28 | +18 11 05.4 | ||
| V38 | RR0-Bl | 0.705798 | 55220.482 | – | 0.705792 | 13 12 57.14 | +18 07 40.6 | ||
| V40 | RR1-Bl: | 0.314819 | 55264.433 | 0.31466 | 0.3147939 | 13 12 55.86 | +18 11 54.7 | ||
| V41 | RR0-Bl | 0.614429 | 55323.107 | 0.61455 | 0.614438 | 13 12 56.75 | +18 11 08.5 | ||
| V42 | RR0 | 0.713713 | 54939.419 | 0.713694 | 0.713717 | 13 12 50.54 | +18 10 20.1 | ||
| V43 | RR0 | 0.712008 | 54941.204 | 0.71205 | 0.712017 | 13 12 53.08 | +18 19 55.5 | ||
| V44 | RR1-Bl | 0.374924 | 55220.488 | 0.27276 | 0.375099 | 13 12 51.66 | +18 10 00.6 | ||
| V45 | RR0 | 0.654946 | 54939.200 | 0.654966 | 0.654950 | 13 12 55.16 | +18 09 27.4 | ||
| V46 | RR0 | 0.703649 | 55263.430 | 0.70363 | 0.703655 | 13 12 54.53 | +18 10 37.0 | ||
| V47 | RR1-Bl | 0.335377a | 55249.380 | – | 0.335377 | 13 12 50.42 | +18 12 24.7 | ||
| V51 | RR1-Bl | 0.355216 | 55249.403 | 0.35519 | 0.355203 | 13 12 57.59 | +18 10 49.7 | ||
| V52 | RR1-Bl | 0.374357 | 55249.410 | 0.37414 | – | 13 12 55.92 | +18 10 37.1 | ||
| V53 | RR1-Bl | 0.389076 | 54941.266 | 0.38911 | – | – | – | ||
| V54 | RR1-Bl: | 0.315105 | 55323.107 | 0.31512 | 0.315122 | 13 12 54.31 | +18 10 31.5 | ||
| V55 | RR1 | 0.443264 | 54939.356 | 0.30677 | 0.443386 | 13 12 53.46 | +18 10 36.6 | ||
| V56 | RR1 | 0.328883 | 55220.457 | 0.32895 | 0.328796 | 13 12 53.69 | +18 09 26.0 | ||
| V57 | RR0-Bl | 0.568198 | 54941.266 | 0.56831 | 0.568234 | 13 12 55.56 | +18 09 58.2 | ||
| V58 | RR1-Bl | 0.354966 | 55263.200 | 0.35499 | 0.354954 | 13 12 55.60 | +18 09 31.0 | ||
| V59 | RR1 | 0.303936 | 55263.422 | 0.30393 | 0.303941 | 13 12 56.66 | +18 09 20.8 | ||
| V60 | RR0 | 0.644766 | 55294.233 | 0.64475 | 0.644755 | 13 12 56.98 | +18 09 36.5 | ||
| V61 | RR1 | 0.369917 | 54940.178 | 0.37951 | – | 13 12 55.12 | +18 10 12.5 | ||
| V62 | RR1 | 0.359911 | 55263.438 | 0.35992 | 0.359891 | 13 12 54.00 | +18 10 29.8 | ||
| V63 | RR1-Bl | 0.310497 | 55264.357 | 0.310476 | 0.310476 | 13 12 56.29 | +18 10 00.7 | ||
| V64 | RR1-Bl | 0.319719 | 55249.424 | 0.31955 | 0.319529 | 13 12 52.52 | +18 10 12.5 | ||
| V67 | SR? | 29.4 | – | – | 13 13 01.01 | +18 10 09.6 | |||
| V71 | RR1-Bl: | 0.304508 | 54939.249 | – | 0.304242 | 13 12 54.38 | +18 09 54.0 | ||
| V72 | RR1 | 0.340749 | 55249.327 | – | 0.254155 | 13 12 55.94 | +18 09 52.3 | ||
| V73 | SX | 0.07011 | 0.0701 | 0.07010 | 13 13 03.35 | +18 09 25.1 | |||
| V74 | SX | 0.04537 | 0.0454 | 0.04537 | 13 12 49.7 | +18 07 26.0 | |||
| V75 | SX | 0.04425 | 0.0442 | 0.04425 | 13 13 09.4 | +18 09 39.8 | |||
| V76 | SX | 0.04149 | 0.0415 | 0.04149 | 13 13 04.97 | +18 08 35.8 | |||
| V78 | SX | 0.04493 | 0.04493 | 13 12 49.91 | +18 08 56.6 | ||||
| V79 | SX | 0.04632 | 0.04631 | 13 12 46.60 | +18 11 37.0 | ||||
| V80 | SX? | 0.06743 | – | 0.06743 | 13 12 57.37 | +18 10 15.2 | |||
| V81 | SX? | – | – | – | 0.07137 | 13 13 02.69 | +18 06 29.7 | ||
| V82 | SX? | – | – | 0.02206 | 13 12 56.46 | +18 13 09.9 | |||
| V83 | SX? | – | – | – | 0.12470 | 13 12 50.11 | +18 07 43.0 | ||
| V84 | Lb? | – | 22.4 | 13 12 36.17 | +18 07 32.2 | ||||
| V85 | Lb? | – | 19.8 | 13 12 50.69 | +18 10 39.6 | ||||
| V86 | Lb? | – | 22.2 | 13 12 52.71 | +18 10 28.1 | ||||
| V87 | SX | 0.04633 | 0.0479 | – | 13 13 01.92 | +18 10 13.2 | |||
| V89 | SX | 0.04336 | 0.0435 | – | 13 13 08.16 | +18 07 38.5 | |||
| V91 | RR1 | 0.302423 | 55220.435 | – | – | 13 12 53.62 | +18 10 13.6 | ||
| V92 | RR1 | 0.277219 | 54940.191 | – | – | 13 12 54.91 | +18 10 50.3 |
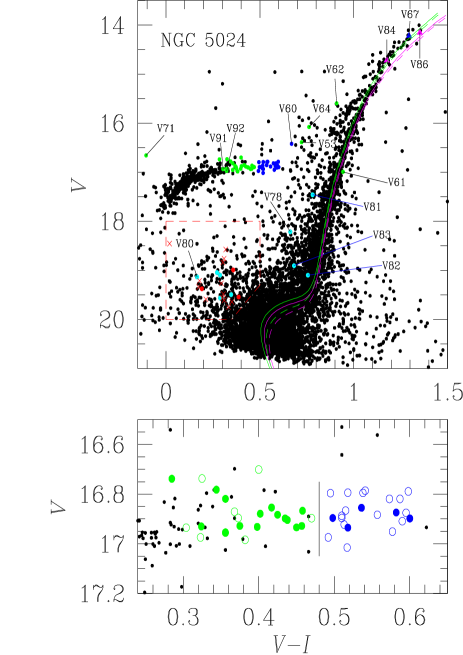
3.2 The Colour-Magnitude-Diagram
We calculated a magnitude weighted mean to the light curves of about 8900 stars measured in the and frames to construct the Colour-Magnitude Diagram (CMD) shown in the top panel of Fig. 4. For the non-variable stars and the sinusoidal symmetric and well phased covered variables, like RR1 and SX Phe, the magnitude and colour weighted means are virtually identical to better approaches to the static star, like the intensity weighted means (Bono et al. 1995). However for the asymmetric RR0 stars, and despite their evenly good phase coverage, we have calculated from the mean values of and obtained from the Fourier fit of the light curve ( in eq. 4). For the five RR0 Blazhko variables we used only the light curve at maximum amplitude. Marked on the figure are all the variables in NGC 5024 contained in the field of our images and an approximate location of the Blue Straggler region where eclipsing binaries and SX Phe variables are expected to be. Most of the known RR Lyrae stars and SX Phe fall in the expected region except for a few labeled stars. The reasons for the peculiar positions of these stars are related either to contamination from a neighbouring star or an inaccurate reference flux estimation in a crowded region, or both. We notice the presence of non-variable stars in the RR Lyrae instability strip. We have inspected their light curves and confirm their non-variable nature. These stars are mostly located in the crowded central region of the cluster and then contamination by neighbours may have rendered incorrect magnitudes and/or colour for some of them. See sections 3.1 and 5 for individual comments for RR Lyrae and SX Phe stars respectively.
The bottom panel of Fig. 4 displays a blow-up of the HB region. RR Lyrae stars are indicated with colours as in the top panel but now the non-modulated stars are plotted with empty circles, and the Blazhko variables with filled circles. RR0 and RR1 stars are clearly separated by the vertical line at which may be interpreted as the border between the inter-mode region first overtone - fundamental (OF) region and the fundamental (F) region. As schematically shown by Caputo et al. (1978) (their Fig 3), one could only find a clean separation between RR1 and RR0 if the evolution on the HB is predominantly to the red.
We note that the Blazhko RR1 stars tend to clump in the OF and a detaliled discussion on the origin of their amplitude and phase instability being associated with their evolution will be presented in a forthcoming paper (Arellano Ferro et al. 2011).
3.3 Period determination
To calculate the periodicity of each light curve we used the string-length method (Burke et al. 1970; Dworetsky 1983) which determines the best period and a corresponding normalized string-length statistic . Exploration of the light curves with the smallest values of by phasing them with their best period recovered all the known RR Lyrae stars and their periods. In column 4 of Table 2 we report the period found for each RR Lyrae star and include, in columns 6 and 7, the periods given by K00 and DK09. The agreement between our periods and those of DK09 is in general very good, the differences are smaller than d. Some stars having larger differences are V17, V19, V44, V63, V71 and V72. While this might be considered as an indication of a secular period change, the presence of amplitude and phase modulations (Blazhko effect), has been detected or suspected in all these stars (see Arellano Ferro et al. 2011). For V17, V71 and V72 we note that the periods of DK09 do not phase our data properly. None of these stars was included in the photometry of K00. The data set of DK09 combined with our data have a time span of only about 3 years, thus we refrain from a numerical analysis in search of a period change. Attention should be paid to these stars in future studies for possible period changes.
For the shorter period stars SX Phe we used the period04 program of Lenz & Breger (2005) as described below.
3.4 Search for new variables
Given the deepness of our collection of images and the precision of our photometry down to V20, we attempted to find new variables in the field of NGC 5024. We used four different approaches.
First, the exploration of the statistic parameter produced by the string-length method (section 3.3) in stars with smaller than a threshold value, recovered all the known RR Lyrae and brighter variables and allowed us to discover variables V91 and V92. We note that this method fails for identifying the small amplitude and short period SX Phe stars, for which a different approach was used (see also Arellano Ferro et al. 2010).
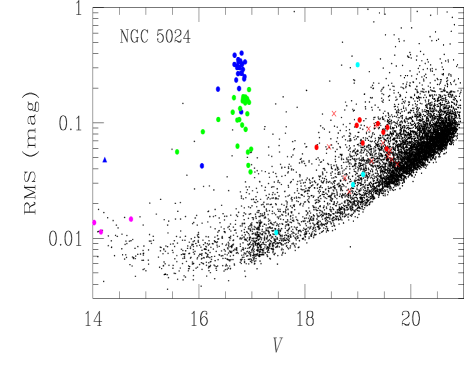
Second, from Fig. 6 it can be seen that variable stars have larger values of the RMS for its corresponding mean magnitude. However, some stars in that plot may have large RMS due to outlier photometric measurements. We have individually explored the light curves of a large fraction of these ”candidates” down to V mag and with RMS larger than 0.01 mag to discriminate between authentic variables and false detections. We used this approach mainly to search for RR Lyrae stars or brighter variables. For the fainter variables in the Blue Straggler region we used a different approach. By adopting this method we confirmed the discovery of the two RR1 stars V91 and V92.
Third, mainly searching for eclipsing binaries and SX Phe stars in the mag range, the sequence of difference images in our data collection were inspected. By converting each difference image to an image of absolute deviations in units of sigma and then constructing the sum of all such images for each filter, one can identify candidate variable sources as PSF-like peaks in the image . Using this method we recovered all known the RR Lyrae and SX Phe stars, confirmed the variability of the previously suspected SX Phe star V80 (DK09), and discovered 13 new SX Phe stars.
Fourth, the individual and light curves of all the stars contained in the red box in the CMD of Fig. 4 were inspected. To allow for uncertainties in the colour and hence in the position of the candidate star on the CMD, stars with were also checked. A total of 400 candidates were identified. Since the and observations were carried out alternatively, in order to have a more continuous light curve we applied an arbitrary shift in magnitude to the data to match the data. Then, when variations were seen in the light curve, we performed a period analysis using period04. To a certain extent the majority of stars in the BS region present some kind of small amplitude irregular variations. However we classify a star as variable when prominent clear variations are seen above the mean photometric uncertainties and the data produced a frequency spectrum with a peak whose signal is at least twice that of the frequency noise level. This procedure recovered all the known SX Phe stars listed in Table 2 and confirmed the discovery of 13 new SX Phe stars which have been labeled as V93, V94,…, V105. These new variables are also identified in the charts of Fig. 2 and discussed in section 5.
4 RR Lyrae stars
4.1 Oosterhoff type and Bailey diagram
The average periods of the 24 RR0 and 31 RR1 stars in Table 2 are 0.6610.064 and 0.3470.039 d respectively and 55% of the RR Lyrae stars in this cluster are RR1. The corresponding numbers for OoII clusters from the CVSGC are 0.659 and 0.368 respectively, and 48% are RR1 stars (Clement et al. 2001). These numbers clearly identify NGC 5024 as an OoII cluster.
A plot of amplitude versus period in Fig. 7 (the Bailey diagram) offers and additional insight to the Oosterhoff classification and is useful in identifying stars with peculiar amplitudes which may introduce noise in the determination for [Fe/H] and MV by the Fourier decomposition of their light curves. The top panel of Fig. 7 shows the distribution of RR0 and RR1 stars, compared with the mean distributions of the OoI cluster M3, shown as solid curves and taken from Cacciari et al. (2005). It is clear that the RR0 stars are displaced towards longer periods. Similar distributions are displayed by the OoII clusters M9, M15 and M68 (see Fig. 4 of Cacciari et al. 2005). No outliers are seen among the RR0 stars, and the five stars known to display the Blazhko effect (V11, V33, V38, V41, V57, plotted as filled triangles) do follow the trend of the RR0 stars equally well. This confirms the Oosterhoff type II of the cluster.
The distribution of RR1 stars is very scattered and can be seen that many appear to have shorter than expected periods for a given amplitude. A similar result was found by Contreras et al. (2010) for the OoI cluster M62 and these authors cite Clement & Shelton (1999) as ascribing these differences to metallicity dependence, in the sense that for RR1 stars present systematic deviations toward shorter period with increasing metallicity. Since NGC 5024 is more metal poor, this explanation is not satisfactory. We note that Clement & Shelton based their comment on three OoI clusters with a low number of RR1 stars (M107, M4 and M5) which in fact do not show the large scatter seen in Fig.7 or for M62 (Contreras et al. 2010).
It is true that Fig.7 contains a large number of RR1 stars with Blazhko amplitude and phase modulations (open triangles; to be discussed by Arellano Ferro et al. 2011). For these stars we have measured the maximum observed amplitude which in fact may be underestimated if we have failed to observe the star at maximum amplitude. Given the large incidence of Blazhko variables among the RR1 stars we think that it is possible that even the stars with apparently stable light curves (open circles in Fig. 7), may turn out to show amplitude modulations if precise photometry is obtained over long time spans. If the Blazhko effect is a temporary peculiarity in the evolution of an RR Lyrae star that may involve a switch of pulsation modes, as it seems to be the case of star V79 in M3 (Goranskij, Christine & Thompson, 2010), the RR1 stars in NGC 5024 may be evolving through such a stage and further monitoring may reveal unprecedented observations of structural changes in stars in a globular cluster.

While the presence of Blazhko variables may contribute to the dispersion, we note that such a dispersion does not come as a surprise on theoretical grounds. Theoretical calculations by Bono et al. (1997) show that the distribution of first overtone pulsators on the log P vs. plane is not linear for a given luminosity, mass and helium content. Thus, as these quantities may have intrinsic scatter from star to star in a cluster, the resulting distribution may look as scattered as it is observed in NGC 5024 (and in M62).
As a new feature, in the bottom panel of Fig. 7 we have produced the Bailey diagram using the RR Lyrae amplitudes in the filter, . The star distribution resemble that in the plane. The solid line is a least squares fit to the RR0 stars (V3 and V60 were omitted) and has the form of eq. 3 which, being NGC 5024 a OoII cluster rich in RR Lyrae stars, it should be representative of the RR0 stars distribution in the version of the Bailey’s diagram for an OoII cluster.
| (3) |
The Oosterhoff type can also be defined from the average physical parameters of RR0 and RR1 stars derived by the Fourier decomposition of their light curves (Corwin et al. 2003). In the following section we shall show that the derived parameters for the RR0 stars support the OoII type for NGC 5024.
The Oosterhoff type determination of globular clusters is of relevance in early formation history of the Galactic halo. The scenario has been summarized most recently by Catelan (2009) who describes in detail how the Oosterhoff dichotomy present among the bona fide Galactic globular clusters is not shown by clusters associated with several neighbouring galaxies, from which it is inferred that the halo was not formed by accretion of dwarf galaxies similar to the present Milky Way satellites.
| Variable | ||||||||||
| Star ID | ( mag) | ( mag) | ( mag) | ( mag) | ( mag) | |||||
| RR0 stars | ||||||||||
| V1 | 16.930(1) | 0.365(2) | 0.179(2) | 0.127(2) | 0.085(2) | 3.904(11) | 8.187(16) | 6.166(23) | 10 | 0.8 |
| V3 | 16.956(1) | 0.299(2) | 0.147(2) | 0.100(2) | 0.064(2) | 3.987(15) | 8.332(22) | 6.440(32) | 10 | 1.2 |
| V5 | 16.791(1) | 0.338(2) | 0.165(2) | 0.114(2) | 0.081(2) | 3.903(14) | 8.196(22) | 6.204(30) | 10 | 1.7 |
| V6 | 16.862(1) | 0.338(1) | 0.174(1) | 0.116(1) | 0.078(1) | 4.014(11) | 8.323(17) | 6.431(24) | 9 | 1.4 |
| V7 | 16.980(1) | 0.393(2) | 0.177(2) | 0.137(2) | 0.091(2) | 3.823(13) | 7.946(18) | 5.840(28) | 10 | 0.7 |
| V8 | 16.973(1) | 0.367(1) | 0.178(1) | 0.127(1) | 0.087(1) | 3.955(11) | 8.218(15) | 6.260(21) | 10 | 0.9 |
| V9 | 16.963(1) | 0.384(1) | 0.182(1) | 0.138(1) | 0.089(1) | 3.865(11) | 8.099(16) | 5.962(22) | 10 | 1.8 |
| V10 | 16.862(1) | 0.383(1) | 0.180(1) | 0.134(1) | 0.090(1) | 3.886(8) | 8.100(11) | 6.023(16) | 10 | 1.4 |
| V24 | 16.826(1) | 0.223(1) | 0.104(1) | 0.057(1) | 0.025(1) | 4.328(15) | 8.891(25) | 7.265(50) | 10 | 1.7 |
| V25 | 16.900(1) | 0.286(2) | 0.145(2) | 0.094(2) | 0.048(2) | 4.165(16) | 8.481(6) | 6.748(42) | 8 | 1.5 |
| V27 | 16.867(1) | 0.310(2) | 0.158(2) | 0.104(2) | 0.063(2) | 4.079(13) | 8.421(20) | 6.622(30) | 9 | 1.1 |
| V29 | 16.821(1) | 0.167(1) | 0.061(1) | 0.029(1) | 0.010(1) | 4.384(23) | 9.077(41) | 7.908(108) | 5 | 4.2 |
| V31 | 16.809(1) | 0.341(1) | 0.182(1) | 0.114(1) | 0.069(1) | 4.147(1) | 8.495(15) | 6.802(22) | 7 | 2.8 |
| V37 | 16.880(1) | 0.289(2) | 0.147(2) | 0.090(2) | 0.045(2) | 4.212(15) | 8.652(23) | 7.028(40) | 10 | 2.1 |
| V42 | 16.870(1) | 0.305(1) | 0.153(1) | 0.097(1) | 0.055(1) | 4.161(12) | 8.558(18) | 6.857(29) | 7 | 1.9 |
| V43 | 16.771(1) | 0.257(2) | 0.129(2) | 0.080(2) | 0.040(2) | 4.184(16) | 8.588(25) | 6.863(43) | 7 | 1.1 |
| V45 | 16.848(1) | 0.337(1) | 0.171(1) | 0.116(1) | 0.080(1) | 3.967(10) | 8.253(15) | 6.260(21) | 10 | 1.1 |
| V46 | 16.886(1) | 0.312(2) | 0.157(2) | 0.099(2) | 0.061(2) | 4.132(15) | 8.489(24) | 6.764(36) | 9 | 3.0 |
| V60 | 16.392(1) | 0.224(2) | 0.114(2) | 0.075(2) | 0.051(2) | 3.892(25) | 8.174(36) | 6.156(51) | 8 | 2.3 |
| RR1 stars | ||||||||||
| V4 | 16.906(1) | 0.223(2) | 0.031(2) | 0.021(2) | 0.009(2) | 4.827(58) | 3.592(85) | 1.852(187) | 7 | — |
| V40 | 16.949(1) | 0.206(1) | 0.031(1) | 0.008(1) | 0.007(1) | 4.590(38) | 2.781(136) | 1.398(153) | 6 | — |
| V55 | 16.703(1) | 0.228(1) | 0.005(1) | 0.012(1) | 0.009(1) | 5.215(212) | 5.026(83) | 3.396(115) | 6 | — |
| V56 | 16.894(1) | 0.231(1) | 0.040(1) | 0.020(1) | 0.015(1) | 4.715(34) | 2.954(62) | 1.620(89) | 7 | — |
| V59 | 16.886(1) | 0.125(1) | 0.012(1) | 0.002(1) | 0.001(1) | 5.013(75) | 2.766(414) | 1.838(1832) | 4 | — |
| V62 | 15.592(1) | 0.074(1) | 0.009(1) | 0.004(1) | 0.002(1) | 4.506(122) | 3.117(283) | 2.082(432) | 4 | — |
| V64 | 16.082(1) | 0.111(2) | 0.024(2) | 0.014(2) | 0.010(2) | 4.500(73) | 2.513(122) | 1.154(175) | 4 | — |
| V91 | 16.938(1) | 0.056(1) | 0.004(1) | 0.002(1) | – | 4.430(302) | 6.217(571) | – | 3 | — |
| V92 | 16.976(1) | 0.053(1) | 0.001(1) | – | – | 1.982(972) | – | – | 2 | — |
NGC 5024 is indeed a rather emblematic OoII cluster in the sense that it has the second largest number of RR Lyrae stars, after M15, and a very blue HB (= (B-R)/(B+V+R) = 0.81; Rey et al. (1998)). This and its low metallicity places the cluster among other OoII Galactic globulars, following the clear Oosterhoff dichotomy found in Galactic globular clusters.
4.2 Fourier light curves decomposition of the RR Lyrae stars
The Fourier decomposition of RR Lyrae light curves into their harmonics has proved to be useful to estimate physical parameters, such as metallicity, luminosity and temperatures through the use of semi-empirical relationships (e.g. Jurcksic & Kovács 1996, Morgan et al. 2007). The light curves can be represented by an equation of the form:
| (4) |
where are magnitudes at time , the period and the epoch. A linear minimization routine is used to fit the data with the Fourier series model, deriving the best fit values of and of the amplitudes and phases of the sinusoidal components.
4.3 [Fe/H] and MV from light curve Fourier decomposition
The Fourier decomposition parameters can be used to calculate [Fe/H] and MV for both RR0 and RR1 stars by means of semi empirical calibrations given in eqs. 5, 6, 7 and 8.
The calibrations for [Fe/H] and MV used for RR0 stars are:
| (5) |
and
| (6) |
given by Jurcsik & Kovács (1996) and Kovács & Walker (2001) respectively. In eq. 6 we have used K=0.41 to scale the luminosities of the RR0 with the distance modulus of 18.5 for the LMC (see the discussion in Arellano Ferro et al. 2010, in their section 4.2). The metallicity scale of eq. 5 was transformed into the widely used scale of Zinn & West (1984) using the relation [Fe/H]J = 1.431[Fe/H]ZW + 0.88 (Jurcsik 1995). These two metallicity scales closely coincide for [Fe/H] while for [Fe/H], the [Fe/H]J is about 0.24 dex less metal poor than [Fe/H]ZW (see also Fig. 2 of Jurcsik 1995). Therefore, for a metal poor cluster such as NGC 5024, the two scales are not significantly different.
| Star | [Fe/H]ZW | log | ||||
|---|---|---|---|---|---|---|
| (mag) | (K) | (kpc) | ||||
| V1 | 0.50 | 1.702 | 6381. | 18.81 | 0.71 | |
| V3 | 0.52 | 1.691 | 6333. | 18.81 | 0.68 | |
| V5 | 0.48 | 1.709 | 6315. | 17.80 | 0.70 | |
| V6 | 0.45 | 1.721 | 6289. | 18.64 | 0.71 | |
| V7 | 0.56 | 1.675 | 6467. | 18.67 | 0.72 | |
| V8 | 0.49 | 1.706 | 6372. | 19.29 | 0.71 | |
| V9 | 0.49 | 1.702 | 6399. | 19.11 | 0.71 | |
| V10 | 0.48 | 1.707 | 6378. | 18.35 | 0.72 | |
| V24 | 0.49 | 1.733 | 6159. | 18.58 | 0.66 | |
| V25 | 0.44 | 1.724 | 6211. | 19.03 | 0.69 | |
| V27 | 0.46 | 1.715 | 6276. | 18.57 | 0.69 | |
| V29 | 0.40 | 1.740 | 6026. | 18.71 | 0.68 | |
| V31 | 0.39 | 1.743 | 6233. | 18.66 | 0.72 | |
| V37 | 0.42 | 1.732 | 6216. | 19.04 | 0.69 | |
| V42 | 0.41 | 1.736 | 6218. | 19.03 | 0.70 | |
| V43 | 0.46 | 1.718 | 6209. | 17.82 | 0.67 | |
| V45 | 0.46 | 1.716 | 6299. | 18.42 | 0.70 | |
| V46 | 0.42 | 1.733 | 6226. | 19.12 | 0.71 | |
| V60 | 0.57 | 1.672 | 6253. | 14.19a | 0.65 | |
| Weighted | ||||||
| Mean | -1.724(9) | 0.46 | 1.714 | 6282. | 18.68 | 0.70 |
| 0.06 | 0.05 | 0.020 | 101. | 0.42 | 0.02 |
avalue not included in the average.
For the RR1 stars we employ the calibrations:
| (7) |
and
| (8) |
given by Morgan et al. (2007) and Kovács (1998) respectively. For eq. 8 the zero point was reduced to 1.061 to make the luminosities of the RR1 consistent with the distance modulus of 18.5 for the LMC (see discussions by Cacciari et al. 2005 and Arellano Ferro et al. 2010). The original zero point given by Kovács (1998) is 1.261.
In the above calibrations the phases are calculated either from series of sines or of cosines as indicated by the superscript. We transformed our cosine series phases into the sine ones where necessary by the correlation .
Although it has been argued that the [Fe/H]() relationship gives good results for mean light curves in Blazhko RR0 variables (Jurcsik et al. 2002; Cacciari et al. 2005; Jurcsik et al. 2009), we choose to use only the high quality light curves of stars with stable light curves to reduce the scatter and uncertainties in the estimation of the metallicity. Since for the RR1 stars no similar tests have been done, and having detected common amplitude modulations among RR1 stars in this cluster (Arellano Ferro et al. 2011), we prefer to avoid those multiperiodic variables.
There are 24 RR0 and 31 RR1 stars reported in Table 2. The Blazhko effect was found by DK09 in 2 RR0 (V11 and V57) and 1 RR1 (V16). We discovered the effect in a further 3 RR0 and 21 RR1 and the discussion of these stars will be presented in a separate paper (Arellano Ferro et al. 2011). For the remaining 19 RR0 and 9 RR1, their light curves seem to be stable enough to perform a Fourier decomposition and to calculate their physical parameters.
From the apparently non-modulated RR1 stars we omitted six stars with too small amplitudes for their period shown in Figs. 3 and 7, V59, V61, V62, V72, V91 and V92.
The results are reported in Tables 4 and 5 for all the mono periodic stars without apparent amplitude modulation. Eq. 5 is applicable to RR0 stars with a deviation parameter , defined by Jurcsik & Kovács (1996) and Kovács & Kanbur (1998), not exceeding a upper limit. These authors suggest . The is listed in the last column of Table 3.
The values of in Tables 4 and 5 were transformed into . The bolometric correction was calculated using the formula [Fe/H] given by Sandage & Cacciari (1990). We adopted the value
| Star | [Fe/H]ZW | log | (kpc) | ||
|---|---|---|---|---|---|
| V4 | 0.507 | 1.697 | 7158. | 18.49 | |
| V55 | 0.435 | 1.726 | 7146. | 17.41 | |
| V56 | 0.540 | 1.684 | 7266. | 18.11 | |
| average | -1.84 | 0.49 | 1.702 | 7190. | 18.02 |
| 0.13 | 0.05 | 0.021 | 66. | 0.55 |
4.4 [Fe/H] discrepancies
The internal error of our estimations of [Fe/H] reported in Tables 4 and 5 are small, which is due to the high quality of the light curves and the Fourier representations, as can also be seen from the small uncertainties in Table 3. However our [Fe/H] estimate differs from other determinations for the cluster. The values of [Fe/H] for NGC 5024 reported in the literature have been reviewed recently by DK09 who pointed out that most values indicate a metallicity lower than but values below are not unusual. DK09 have also estimated the metallicity for twelve giants in NGC 5024 employing a photometric method and found a value of . It seems then that the average value of for the RR0 stars produced by eq. 5 is too large by 0.2 to 0.3 dex.
The fact that eq. 5 predicts higher metallicities by 0.2 dex at the low-metallicity end, has been pointed out in the past (e.g. Nemec 2004; Jurcsik & Kovács 1996; Kovács 2002; Arellano Ferro et al . 2010). A good agreement between the [Fe/H]() and the spectroscopic values for the LMC RR Lyrae stars has been found by Gratton et al. (2004) and Di Fabrizio et al. (2005) only after this metallicity scale difference is taken into account.
Similar systematic offset has been found for the RR Lyraes in metal poor clusters, e.g. Arellano Ferro et al. (2006) for M15; Nemec (2004) and Arellano Ferro et al. (2008) for NGC 5466; and Arellano Ferro et al. (2010) for NGC 5053. This problem has been addressed in detail most recently by DK09, who offer a series of possible explanations, such as the low number of low-metallicity field RR Lyrae stars in the sample of calibrators for eq. 5 for which no high-dispersion spectroscopy is available. On the other hand the metallicity for the RR1 stars from eq. 7, seems to predict metallicities closer independent spectroscopic estimations (see also the case of M15, NGC 5053 and NGC 5466 in the above cited papers). DK09 have pointed out that in using eq. 7 one has to keep in mind that RR1 stars contain less distinct features than RR0 stars; due to the lack of individual spectroscopic metallicity values for the 106 calibrator stars, the mean values of the parent cluster had to be adopted and as a result only 12 independent metallicity values were considered in the calibration; also the metallicity range of the sample is about half of the one covered by the calibration of eq. 5. DK09 attribute the good overall agreement between metallicities to the strong dependence of [Fe/H] on the period for both RR0 and RR1 stars.
Given the above reasons and the fact that our result for the RR1 stars is based only on three stars and that the amplitudes of most RR1 stars in NGC 5024 display peculiarities (many Blazhko variables and large scatter in the Bailey’s diagram) we do not consider the RR1 metallicity as very reliable. On the other hand, a systematic correction of 0.2 dex to the Fourier estimate of [Fe/H] for RR0 stars in extreme low metallicity globular clusters leads to a mean value [Fe/H] = .
4.5 Distance to NGC 5024 from the RR Lyraes stars
The mean absolute magnitudes MV for the RR0 and the RR1 stars are not significantly different. The true distance modulus, as calculated for the RR0 and RR1 stars is and respectively which correspond to the distances and kpc, where the quoted uncertainties are the standard deviation of the mean. These results are sensitive to the adopted values of reddening and the ratio . We have adopted (Harris 2010, Schlegel et al. 1998) and (Clayton & Cardelli 1988). Since the above distances for the RR0 and RR1 stars are calculated from two independent empirical calibrations, with their own systematic uncertainties, they should be considered as two separate estimates. The distance to NGC 5024 listed in the catalogue of Harris (1996) is 17.9 kpc, estimated from the mean magnitude of 19 RR Lyraes stars from the work of K00.
In order to provide an independent test to the distance reported above, we have considered the period-luminosity relation for RR Lyrae stars in the plane . Fig. 8 shows the distribution of the RR Lyrae stars in NGC 5024 on this plane. The colours and symbols are as in Fig. 4. The RR1 stars periods were fundamentalized using (Catelan 2009). Then we have used the theoretical period-luminosity relation in the band, calculated by Catelan et al. (2004). These authors offer PL relations of the form for several filters, values of the metallicity and HB type . We used their Table 5 for to interpolate for (Rey et al. 1998) and found the relation . Then we have shifted this relation to the observational plane according to the mean distance 18.7 kpc from the RR0 stars (section 4.5) and adopting and (Rieke & Lebofsky 1985). The result is the solid line in Fig. 8 which matches the observations very well. The data dispersion in Fig. 8 corresponds to an average uncertainty in the distance of kpc.
In their paper Catelan et al. (2004) offer average versions of the PL relation for the bands. For the band they propose; . We calculated log Z from the equation log Z=[Fe/H]zw-1.765+ log (0.638 f+ 0.362) (Catelan et al. 2004) with f==1.995 corresponding to [/Fe]=+0.3 (Carney 1966). The resulting relation was shifted to the data as described in the previous paragraph. The result is the segmented line in Fig. 8 which fails matching our data. This illustrates the importance of using the HB structure dependent versions of the PL relation whenever the parameter can be estimated.
4.6 Masses for the RR0 stars
The masses of the RR0 stars with stable light curves can be estimated from the calibration of Jurcsik (1998);
| (9) |
Although the validity of this equation has been questioned by Cacciari et al. (2005), in a recent paper (Arellano Ferro et al. 2010) we have compared the masses from eq. 9 with the predicted masses from the van Albada & Baker (1971): for a sample of RR0 stars in NGC 5053, and found that they agree to within a few percent. We have calculated the masses of the RR0 stars in NGC 5024 with eq. 9 and report them in the last column of Table 4. The average mass is
We did not calculate the masses for RR1 stars due to the amplitude and phase modulations discussed in previous sections for these stars.
5 SX Phe stars
We have carried out an inspection of the light curves in our data of the four suspected SX Phe by DK09: V80, V81, V82 and V83 but have only confirmed the variability and periodicities reported by DK09 for V80. V81 and V82 are not found to be variable. The variability of V83 is marginal but its SX Phe nature cannot be ascertained.
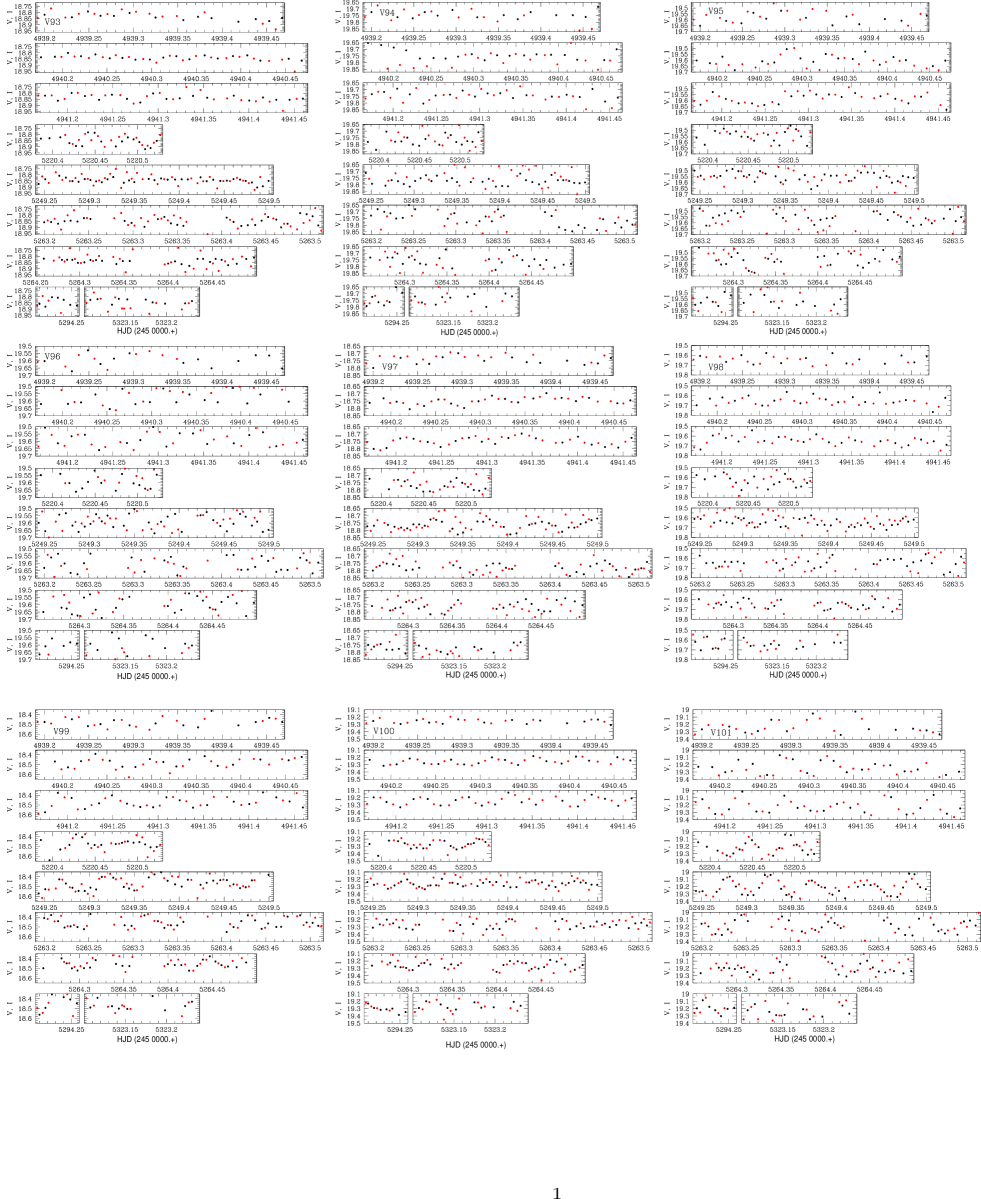
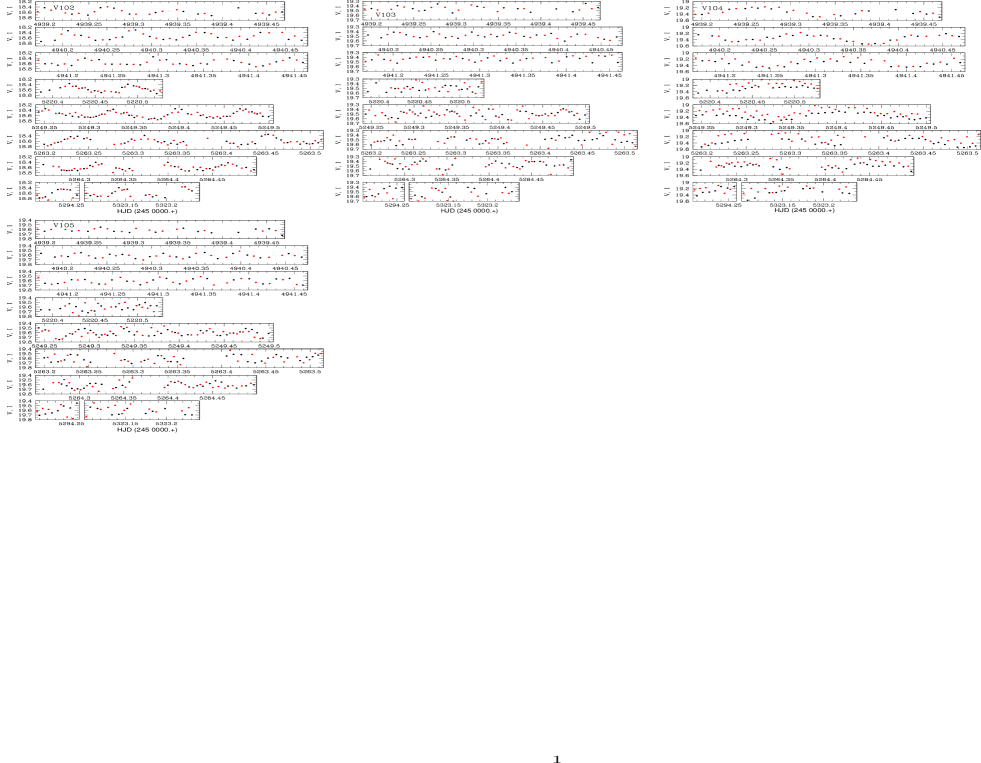
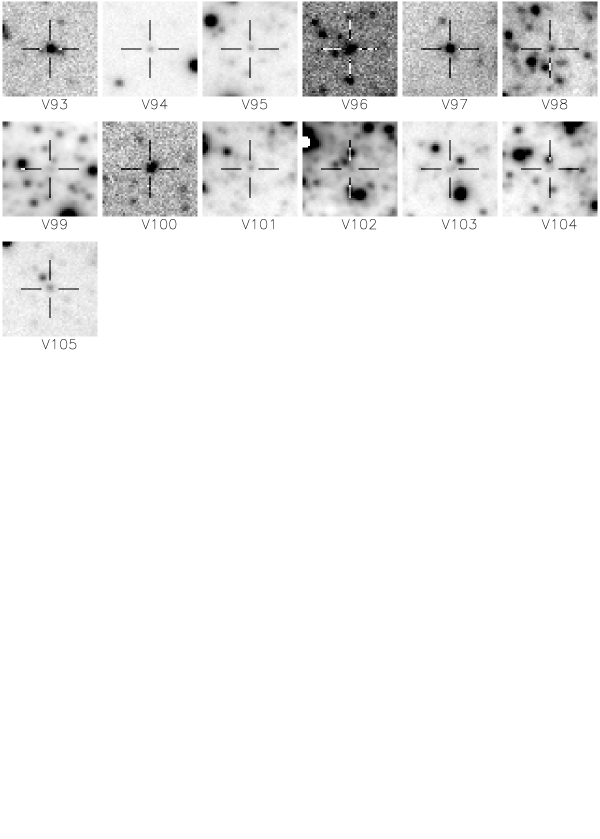
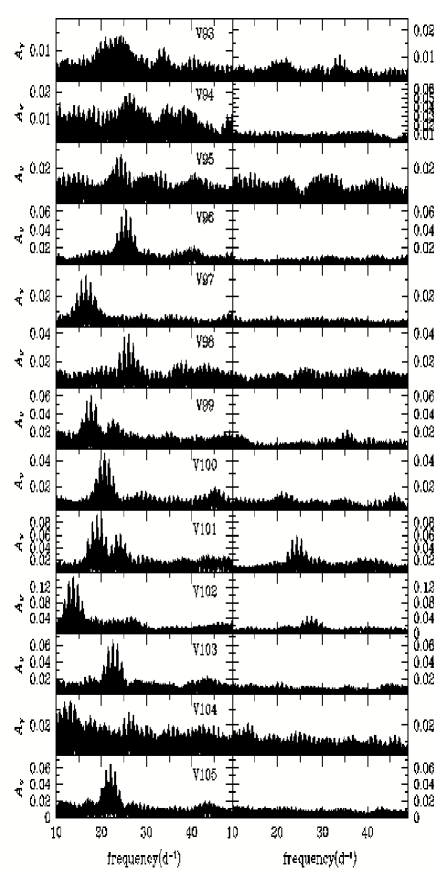
In the present work 13 new SX Phe stars have been found and another 5 marginal cases are retained as suspected. The light curves of some of these new SX Phe stars are shown in Fig 10. Accurate finding charts for the these new SX Phe stars are given in Fig. 9. We have performed a period analysis for all these stars with period04. Due to the limited time span of our data, it is not possible to assess the existence and values for more than one, and in some cases two, frequencies. However the determination of the main frequency with the largest amplitude is quite clear. In Fig 11 we present the frequency spectra for all the newly found SX Phe stars.
The corresponding variable names assigned to the new variables are from V93 to V105. Their frequencies, mode identification and celestial coordinates are given in Table 6. For the mode identification we have assumed that the main frequency, with the largest amplitude, is the fundamental mode . When secondary frequencies are identified, the mode is suggested by the frequency ratio (e.g. V99, V101, V102). However the final mode assignment has been defined by the position of each star on the PL plane of Fig. 12 relative to the fundamental and first overtone loci as discussed the following section.
| Variable | RA | Dec. | mode id. | |||||
|---|---|---|---|---|---|---|---|---|
| (d-1) | (mag) | (d) | J2000.0 | J2000.0 | ||||
| V93a | 18.840 | 0.303 | 24.95330(17) | 0.014(2) | 0.04007 | 13 12 40.00 | +18 08 39.0 | |
| V94 | 19.750 | 0.333 | 26.32849(21) | 0.022(4) | 0.03798 | 13 12 42.11 | +18 07 39.8 | |
| V95 | 19.564 | 0.290 | 24.36281(18) | 0.029(5) | 0.04105 | 13 12 47.94 | +18 09 55.2 | |
| 13.95330(30) | 0.017(5) | 0.07167 | ||||||
| V96 | 19.589 | 0.213 | 25.46587(6) | 0.063(3) | 0.03927 | 13 12 48.29 | +18 13 18.9 | |
| V97 | 18.762 | 0.309 | 16.61477(3) | 0.033(2) | 0.06019 | 13 12 48.27 | +18 14 34.6 | |
| V98 | 19.642 | 0.351 | 26.04022(11) | 0.040(4) | 0.03840 | 13 12 48.67 | +18 09 35.9 | |
| V99 | 18.456 | 0.019 | 17.72343(6) | 0.064(4) | 0.05642 | 13 12 52.91 | +18 10 35.8 | |
| 22.66610(15) | 0.028(4) | 0.04412 | ; | |||||
| V100 | 19.264 | 0.295 | 20.74930(8) | 0.045(3) | 0.04819 | 13 12 53.42 | +18 14 46.2 | |
| 21.00011(22) | 0.016(4) | 0.04762 | ||||||
| V101 | 19.211 | 0.179 | 19.04200(4) | 0.096(4) | 0.05252 | 13 12 53.65 | +18 08 57.9 | |
| 24.34878(7) | 0.061(4) | 0.04107 | ; | |||||
| V102 | 18.576 | 0.318 | 13.80387(3) | 0.153(4) | 0.07244 | 13 12 54.76 | +18 09 37.7 | |
| 27.60780(9) | 0.047(4) | 0.03622 | ; | |||||
| 21.18330(24) | 0.016(4) | 0.04721 | ; | |||||
| V103 | 19.484 | 0.306 | 22.56317(8) | 0.068(5) | 0.04432 | 13 12 58.32 | +18 08 41.2 | |
| V104 | 19.342 | 0.174 | 6.77748(30) | 0.115(10) | 0.14756 | 13 12 59.00 | +18 10 22.0 | |
| V105 | 19.609 | 0.310 | 22.09475(6) | 0.067(4) | 0.04526 | 13 13 01.92 | +18 12 30.4 |
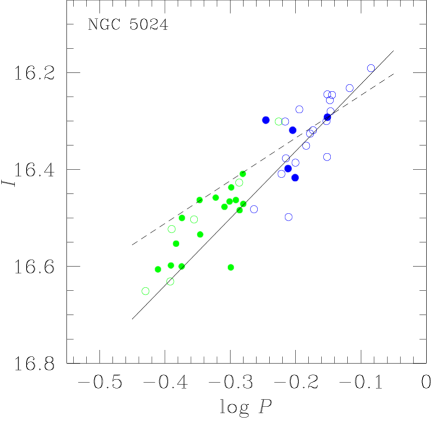
5.1 SX Phe PL relationship
The existence of a period-luminosity relationship for SX Phe stars has been firmly established both from theoretical (e.g. Santolamazza et al. 2001) and empirical grounds (e.g. McNamara 1997; 2000, Jeon et al. 2003; 2004, Poretti et al. 2008). In Fig. 12 we have plotted on the log and log planes, the previously known and suspected SX Phe stars, as given in the CVSGC, and the 13 SX Phe stars stars found in this work. The solid lines in both panels are least square fits to the evident fundamental pulsator stars. Small and large dashed lines correspond to relationships inferred for first and second overtone pulsators respectively, assuming the ratios and (see Santolamazza et al. 2001 or Jeon et al. 2003; Poretti et al. 2005). The distribution of the stars along one of these PL relations is very clear in most cases. On the basis of this distribution and the frequency ratios from the period analysis we have assigned the pulsation mode given in column 9 of Table 6. Although the stars V78 and V90 are not in the field of our images, we included them by adopting their periods and magnitudes from the CVSGC. The previously suspected SX Phe star V81 is not included since we have not confirmed its variability. Two positions are plotted for V101 and V104. V101 is a clear case for which the fundamental mode and first overtone have been detected. For V104 however, the main frequency found is too short for its magnitude both in and . If we assume that we have detected an alias and that the fundamental frequency , then the star positions right on the fundamental sequence of the PL relationship. We concede that this is forcing the case but it is tempting to assume that. In any case we have not used V104 in the calculation of the fundamental log relation. There are outstanding outliers such as V78, and the two of the suspected SX Phe stars V82 and V83. It is noted that these three stars fall outside the BS region on the CMD of Fig. 4. The variability of V78 is clear but it is too bright for its period. We speculate that the star has an unseen companion that makes it appear brighter. The star V83 in filter falls sharp on the fundamental sequence. The case of V82 and V83 has been addressed in section 3.1 and their SX Phe nature has not been confirmed.
Now, the above procedure has produced some peculiarities. For instance, for the star V99 the frequency analysis showed very clearly two frequencies whose ratio is the expected one between the fundamental and first overtone for metallicities [Fe/H] (e.g. Fig. 4 in Poretti et al. 2005). However, when plotted on the log plane of Fig. 12 with the principal period, the star falls on the second overtone locus and on the log plane on the first overtone! It is likely that the star is a blend. A similar case is that of V102. Both stars appear to be too bright for their putative fundamental period. Although we do not have a ready explanation for this, it may be possible that the stars are not SX Phe and hence do not follow the corresponding PL relation and/or that they are members of a binary system and their magnitude is contaminated by the companion.

All the peculiar stars were ignored in the calculation of the least squares fits of the apparently fundamentally pulsating stars, the solid lines in Fig. 12. The fundamental log and log relationships are of the form:
| (10) |
| (11) |
which, by adopting the average distance modulus obtained from the RR0 stars = and (section 4.5) correspond to:
| (12) |
| (13) |
Eq. 12 can be compared with the one found by Jeon et al. (2003) for NGC 5024 based only on the six fundamental SX Phe stars then known: . This relationship is also shown in Fig. 12 as a dotted line. The new calibration has essentially the same slope but it is fainter by about 0.05 mag.
The slope and zero point of the PL relation for SX Phe have been obtained for several clusters and discussed by Jeon et al. (2003) (see for instance their Fig. 7). The slope for M55 ( Pych et al. 2001) and for NGC 5024 ( Jeon et al. (2003)) and also the slopes from theoretical studies ( Santolamazza et al. 2001; Templeton et al. 2002) are, within the uncertainties, similar to our value in eq. 12. Slightly larger values have been obtained by recent analysis of 153 Galactic and extragalactic stars Scuti and SX Phe stars, (Poretti et al. 2008), and for 29 Galactic Scuti and SX Phe stars (McNamara 1997). It is intriguing that the Galactic globular cluster with the largest number of known SX Phe stars, Cen (Kaluzny et al. 1997), displays a slope as steep as (McNamara 2000). It is likely that a precise PL relation conveys a metallicity dependence, hence studying homogeneous samples in globular clusters is of great relevance. Unfortunately the population of known SX Phe in globular clusters is generally small. The discovery of 13 new SX Phe in NGC 5024 nearly triples the number and allows to firmly include this cluster in the general discussion of the PL relation calibration. It is comforting to see that the resulting PL relation found above is in a good agreement with independent previous results.
5.2 Suspected Variables
A few stars whose light curves show mild but rather clear variations were identified. However, we failed to find a convincing frequency above the noise level. These stars are retained as suspected variables and they have been labeled with an ”S” prefix. They are listed in Table 7 along with their celestial coordinates. One should refrain from assigning these stars a variable number until their variability can be confirmed.
| Star | RA | Dec. | ||
|---|---|---|---|---|
| J(2000.0) | J(2000.0) | |||
| S1 | 19.977 | 0.055 | 13 12 47.0 | +18 10 22.8 |
| S2 | 18.998 | 0.320 | 13 12 49.3 | +18 10 05.6 |
| S3 | 18.163 | 13 12 51.0 | +18 10 04.3 | |
| S4 | 19.866 | 0.31 | 13 12 53.9 | +18 09 15.1 |
| S5 | 18.084 | -0.316 | 13 12 56.0 | +18 09 14.4 |
6 Long Term Variables
Of the known long term variables in NGC 5024, only three are not saturated; V67, V84, and V86. V84 falls very close to the edge of our field, and a CCD defect has randomly affected the images of this star. Hence we do not claim good observations for V84. For both V67 and V86 our and photometry is reliable keeping in mind that such bright stars usually suffer from systematic problems with the photometry to a greater extend than most other stars.
We have attempted period determinations for these stars using period04. For V67 and V86 no photometry is given by DK09. The analysis of our data suggests periods of 29.4 days for V67 and 12.2 days for V86. No other period is known for V67 while for V86 DK09 report a period of 22.2 days. We note that neither 12.2 nor 22.2 days produce a reliable folding of our data but also note that the time span or our data set is much shorter than that of DK09, thus it is likely that their period is closer to the reality.
V85 is saturated in the filter reference image and hence we publish only reliable data, that have been used to discuss its periodicity below. data are available from DK09 and we have noticed a small shift of about 0.04 mag between the two data sets. Since applying a correction would be inaccurate and would affect the period analysis, we chose to analyze the two data sets separately. We have confirmed the 19.8 day period reported by DK09 based on their data set alone and found that this period phases well our data.
In Table 8 we report the mean magnitude and colour which in fact place the stars correctly on the RGB of the CMD as shown in Fig. 4.
| Star | ||
|---|---|---|
| V67 | 14.221 | 1.295 |
| V84 | 14.720 | 1.176 |
| V85 | 14.024 | – |
| V86 | 14.154 | 1.352 |
7 On the age of NGC 5024 and a reddening estimation
Ages of globular clusters have been estimated from the so called ”vertical” and ”horizontal” methods, i.e. estimating , the difference of magnitudes of the ZAHB and the Turn Off (TO) point and or , the difference between the TO and a fiducial point on the RGB (Rosenberg et al. 1999; Salaris & Weiss 2002). Both and are age and metallicity dependent. The usage of any of these methods to the CMD of NGC 5024 in Fig. 4 faces the immediate problem of locating the TO point given the large scatter at mag. Therefore, instead of attempting an independent determination of the age of the cluster, we have adopted the recent age estimate of 13.250.50 Gyr reported by Dotter et al. (2010) which was achieved from isochrone fitting on a deep CMD based on Hubble Space Telescope, Advanced Camera Survey photometry.
We have plotted on the CMD of Fig. 4 the isochrones from the library of VandenBerg, Bergbusch & Dowler (2006) for [Fe/H]= (purple lines) and (green lines), [/Fe]= and the ages 12 (continuous lines) and 14 Gyr (segmented lines), which bracket the calculated metallicity from the RR0 stars and the adopted age for the cluster. The isochrones were shifted until a satisfactory fit to the RGB was observed. We found the best solution for an apparent modulus =16.42, and which are consistent with our estimated true distance modulus and the adopted in section 4.5. The CMD in Fig. 4 is consistent the [Fe/H] and distance values obtained from the Fourier decomposition approach to the RR0 stars, and the age of 13.250.50 Gyr adopted from Dotter et al. (2010).
8 Conclusions
The technique of difference imaging has proved to be a powerful tool to find new variables even in crowded image regions. Here we report the discovery of two RR1 and 13 SX Phe stars. These discoveries were possible thanks to the spatial resolution of our images and to the deepness and quality of our time series photometry. The difference imaging approach employed for the image analysis played a major role in improving the quality of the light curves and the discovery of very faint variables. This also permitted us to correct previous misidentifications of some variables in the cluster.
Physical parameters of astrophysical relevance, [Fe/H], , , , and mass, have been derived for selected RR Lyrae stars in NGC 5024 using the Fourier decomposition of their light curves. Special attention has been paid to the conversion of these parameters onto broadly accepted scales.
Mean values of [Fe/H] and distance of NGC 5024 were calculated from individual values of carefully selected RR Lyrae stars whose light curves are stable and have been shown to have a good quality. The final estimates are [Fe/H]= from 19 RR0 stars and the distance moduli and obtained independently for RR0 and RR1 stars respectively, and which correspond to the distances and kpc.
We found 13 new SX Phe stars of magnitudes between 18.4 and 19.7 and their pulsation periods were calculated. In a few cases more than one period was detected. The 13 newly discovered SX Phe stars together with the 8 previously known, allowed new calibrations of the PL relationship of SX Phe stars in the and bands, and to assign a pulsation mode for most of these elusive faint stars. The calibration of the PL relationship for cluster SX Phe provides a powerful tool for distance determination and it agrees with independent calculations in different stellar systems.
Acknowledgments
We are grateful to the support astronomers of IAO, at Hanle and CREST (Hosakote) for their very efficient help while acquiring the data. We thankfully acknowledge the numerous comments and suggestions from an anonymous referee. AAF acknowledges the hospitality of the Indian Institute of Astrophysics during his sabbatical leave in 2010. This project was supported by DGAPA-UNAM grant through project IN114309 and by the INDO-MEXICAN collaborative program by DST-CONACyT. This work has made a large use of the SIMBAD and ADS services.
References
- [\citeauthoryearAlard2000] Alard C., 2000, A&AS, 144, 363
- [\citeauthoryearAlard & Lupton1998] Alard C., Lupton R.H., 1998, ApJ, 503, 325
- [\citeauthoryearArellano Ferro et al.2011] Arellano Ferro A., Figuera Jaimes R., Bramich D.M., Giridhar, S., 2011, submitted to MNRAS. (Paper II)
- [\citeauthoryearArellano Ferro et al.2006] Arellano Ferro A., García Lugo G., Rosenzweig P., 2006, RevMexAA, 42, 75
- [\citeauthoryearArellano Ferro et al.2010] Arellano Ferro A., Giridhar S., Bramich D.M., 2010, MNRAS, 402, 226
- [\citeauthoryearBond et al2001] Bond I. A., Abe F., Dodd R. J., 2001, MNRAS, 327, 868
- [AAF] Bono, G., Caputo, F., Stellingwerf, R.F., 1995, ApJS, 99, 263
- [AAF] Bono, G., Caputo, F., Castellani, V., Marconi, M., 1997, A&AS, 121, 327
- [\citeauthoryearBramich2008] Bramich D.M., 2008, MNRAS, 386, L77
- [AAF] Bramich D. M., Figuera Jaimes R., Giridhar S., Arellano Ferro A., 2011, MNRAS, 413, 1275
- [AAF] Bramich D. M., Horne K., Bond I. A., Street R. A., Cameron A. C., Hood B., Cooke J., James D., Lister, T. A., Mitchell D., Pearson K., Penny A., Quirrenbach A., Safizadeh N., Tsapras Y., 2005, MNRAS, 359, 1096
- [\citeauthoryearBurke et al.1970] Burke E.W., Rolland W.W. & Boy W.R., 1970, JRASC, 64, 353
- [\citeauthoryearCacciari, Corwin & Carney2005] Cacciari, C., Corwin, T.M., Carney, B.W., 2005, AJ, 129, 267
- [\citeauthoryearCacciari, Corwin & Carney2005] Cáceres, C., Catelan, M., 2008, ApJS, 179, 242
- [\citeauthoryearAlard2000] Caputo, F., Tornambe, A., Castellani, V., 1978, A&A, 67, 107
- [\citeauthoryearAlard2000] Carney, B.W., 1996, PASP, 108, 900
- [\citeauthoryearAlard2000] Catelan, M., Pritzl, B. J., Smith, H. A., 2004, ApJS, 154, 633
- [\citeauthoryearAlard2000] Catelan, M., 2009, Ap&SS, 320, 261
- [\citeauthoryearAlard2000] Clayton, G. C., Cardelli, J. A. 1988, AJ, 96, 695
- [\citeauthoryearAlard2000] Clement, C. M., Shelton, I., 1999, AJ, 118, 453
- [\citeauthoryearAlard2000] Clement, C. M., Muzzin, A., Dufton, Q., Ponnampalam, T., Wang, J.,; Burford, J., Richardson, A., Rosebery, T., Rowe, J., Hogg, H. S., 2001, AJ, 122, 2587
- [\citeauthoryearAlard2000] Contreras R., Catelan, M., Smith, H. A., Pritzl, B. J., Borissova, J., Kuehn, C. A., 2010, AJ, 140, 1766
- [\citeauthoryearAlard2000] Corwin, T.M., Catelan, M., Smith, H.A., Borissova, J., Ferraro, F.R., Raburn, W.S., 2003, AJ, 125, 2543
- [\citeauthoryearAlard2000] Dékány, I., Kovács, G., A&A, 2009, 507, 803 (DK09)
- [\citeauthoryearAlard2000] Di Fabrizio, L., Clementini, G., Maio, M., Bragaglia, A., Carretta, E., Gratton R. G., Montegriffo, P., Zoccali, M., 2005, A&A, 430, 603
- [\citeauthoryearAlard2000] Dotter, A., Sarajedini, A., Anderson, J., and 14 authors, Ap. J., 2010, 708, 698
- [\citeauthoryearAlard2000] Draper P.W., 2000, in Manset N., Veillet C., Crabtree D., eds. ASP Conf. Ser. Vol. 216, Astronomical Data Analysis Software and Systems IX. Astron. Soc. Pac., San Francisco, p. 615
- [\citeauthoryearDworetsky1983] Dworetsky M.M., 1983, MNRAS, 203, 917
- [\citeauthoryearDworetsky1983] Gratton R. G., Bragaglia, A., Clementini, G., Carretta, E., Di Fabritzio, L., Maio, M., Taribello, E., 2004, A&A, 221, 937
- [\citeauthoryearAlard2000] Goranskij, V., Clement, C.M. & Thompson, M. 2010, in Variable stars, the galactic halo and galaxy formation. Proceedings of an international conference held in Zvenigorod, Russia, 12-16 October 2009. Eds. C. Sterken, N. Samus and L. Szabados. Sternberg Astronomical Institute of Moscow University
- [\citeauthoryearAlard2000] Harris W. E., 2010, 2010arXiv1012.3224H (http://www.physics.mcmaster.ca/Globular.html)
- [\citeauthoryearAlard2000] Jurcsik, J., 1998, A&A, 333, 571
- [\citeauthoryearJurcsik et al.2001] Jurcsik J., Benkõ, J.M., Szeidel, B., 2002, A&A, 390, 133
- [\citeauthoryearJeon et. al2003] Jeon,Y.-B., Lee M.G., Kim S.-L., et al. 2003, AJ, 125, 3165
- [\citeauthoryearAlard2000] Jeon Y.-B., Lee M.G., Kim S., Lee H., 2004, AJ, 128, 287
- [\citeauthoryearAlard2000] 2011 Johnson, H.L., 1968, in Middlehurst, B.L. & Aller, L.H., eds., Nebulae adn Interstellar Matter, U. Chicago Press, CHicago, p. 167
- [\citeauthoryearAlard2000] Jurcsik, J., Kovács G., 1996, A&A, 312, 111
- [\citeauthoryearAlard2000] Kaluzny, J., Kubiak, M., Szymanski, M., Udalski, A., Krzeminski, W., Mateo, M., Stanek, K., A&AS, 122, 471
- [\citeauthoryearKopacki2000] Kopacki, G., 2000, A&A, 358, 547 (K00)
- [\citeauthoryearAlard2000] Kovács, G., 2002, in ASP Conf. Ser. 265, Centauri: A Unique Window into Astrophysics. Eds. van Leeuwen, F., Hughes, J., Pioto, G., (San Francisco; ASP), p. 163
- [\citeauthoryearLandolt1992] Landolt, A.U., 1992, AJ, 104, 340
- [\citeauthoryearLenz & Breger2005] Lenz P. & Breger M., 2005, Communications in Asteroseismology, 146, 53
- [\citeauthoryearAlard2000] McNamara, D. H., 1997, PASP, 109, 1221
- [\citeauthoryearAlard2000] McNamara, D. H., 2000, PASP, 112, 1096
- [\citeauthoryearMonet et al.2003] Monet D.G., Levine, S.E., Canzian, B., and 26 authors, 2003, AJ, 125, 984
- [\citeauthoryearNemec2004] Nemec, J.M., 2004, AJ, 127, 2185
- [\citeauthoryearAlard2000] Poretti, E., Clementini, G., Held, E. V., Greco, C., Mateo, M., Dell’Arciprete, L., Rizzi, L., Gullieuszik, M., Maio, M., 2008, ApJ, 685, 947
- [\citeauthoryearAlard2000] Poretti, E., Suárez, J. C., Niarchos, P. G., and 13 coauthors, 2005, A&A, 440, 1097
- [\citeauthoryearAlard2000] Pych, W., Kaluzny, J., Krzeminski, W., Schwarzenberg-Czerny, A., Thompson, I. B., 2001, A&A, 367, 148
- [\citeauthoryearRey1998] Rey, S.-C., Lee, Y.-W., Byun, Y.-I., Chun, M.-S., 1998, AJ, 116, 1775
- [\citeauthoryearAlard2000] Rieke, G. H., Lebofsky, M. J., 1985, ApJ, 288, 618
- [\citeauthoryearAlard2000] Santolamazza, P., Marconi, M., Bono, G., Caputo, F., Cassisi, S., Gilliland, R. L., 2001, ApJ, 554, 1124
- [\citeauthoryearAlard2000] Sandage, A., Cacciari, C., 1990, ApJ, 350, 645
- [\citeauthoryearAlard2000] Schlegel, D.J., Finkbeiner, D.P., Davis, M., 1998, ApJ, 500, 525
- [\citeauthoryearAlard2000] Stetson, P.B., 2000, PASP, 112, 925
- [\citeauthoryearAlard2000] van Albada, T. S., Baker, N., 1971, ApJ, 169, 311
- [\citeauthoryearAlard2000] VandenBerg, D. A., Bergbusch, P.A., Dowler, P.D., 2006, ApJS, 162, 375
- [\citeauthoryearZinn1985] Zinn R., 1985, ApJ, 293, 424
- [\citeauthoryearZinn & West1984] Zinn R., West, M. J., 1984, ApJS, 55, 45
Supporting Information
Additional supporting information may be found in the online version of this article.
Table 1. Time-series and photometry for all the confirmed variables in our field of view.
Two tar files containing the individual and light curves for all stars measured in the field of our images are also included as online material.
Please note: Wiley-Blackwell are not responsible for the content or functionality of any supporting materials supplied by the authors. Any queries (other than missing material) should be directed to the corresponding author for the article.